

The Mitochondrial Respiratory Chain Is Required for Organismal Adaptation to Hypoxia
- PMID: 27068470
- PMCID: PMC4838509
- DOI: 10.1016/j.celrep.2016.03.044
The Mitochondrial Respiratory Chain Is Required for Organismal Adaptation to Hypoxia
Abstract
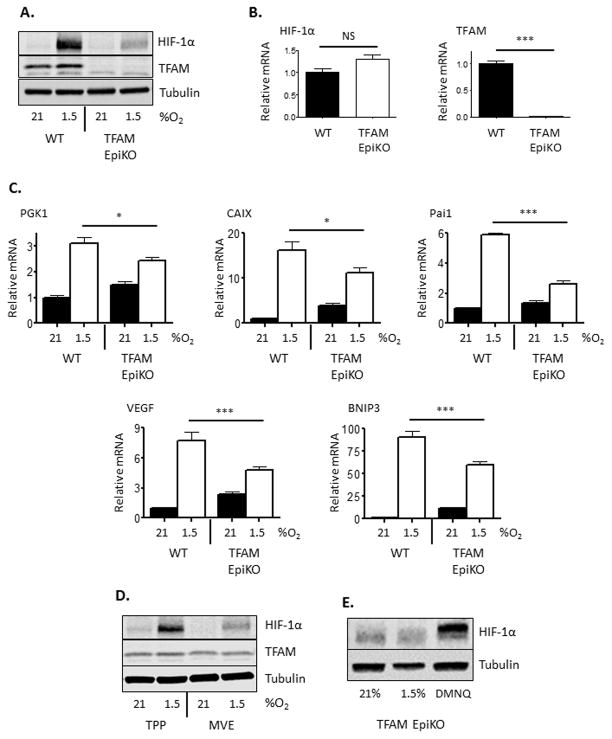
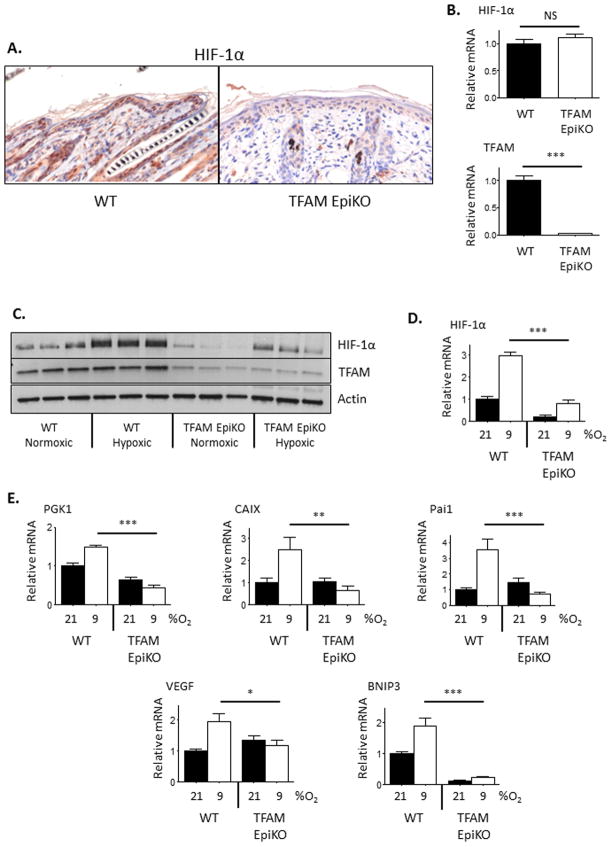
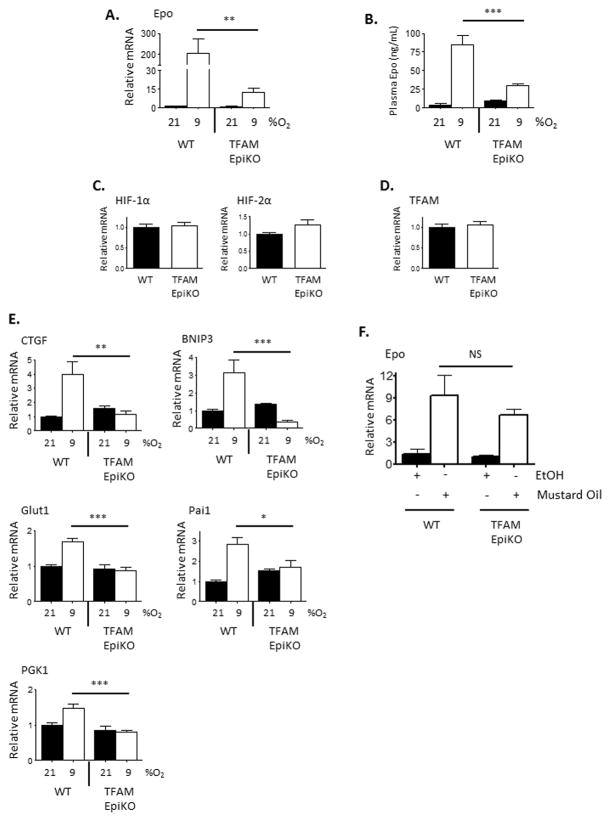
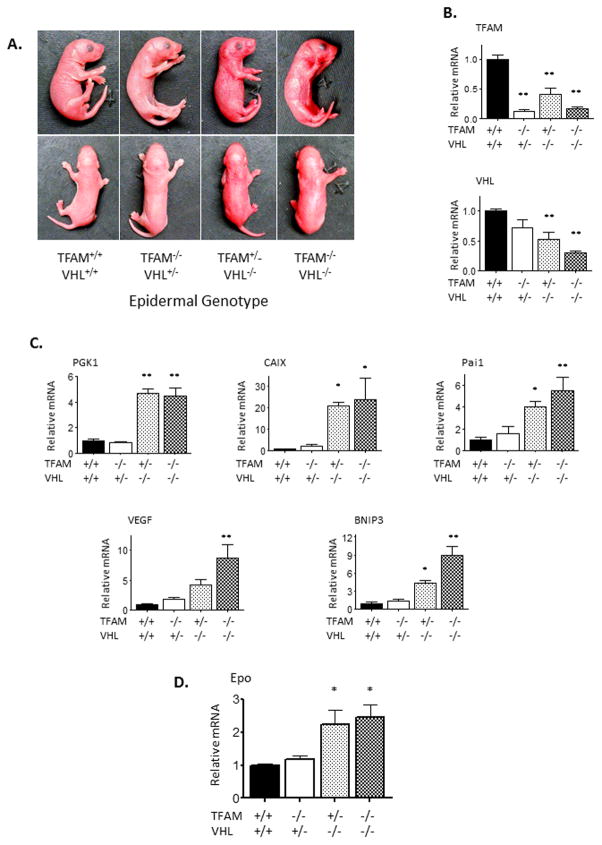
Hypoxia-inducible factors (HIFs) are crucial for cellular and organismal adaptation to hypoxia. The mitochondrial respiratory chain is the largest consumer of oxygen in most mammalian cells; however, it is unknown whether the respiratory chain is necessary for in vivo activation of HIFs and organismal adaptation to hypoxia. HIF-1 activation in the epidermis has been shown to be a key regulator of the organismal response to hypoxic conditions, including renal production of erythropoietin (Epo). Therefore, we conditionally deleted expression of TFAM in mouse epidermal keratinocytes. TFAM is required for maintenance of the mitochondrial genome, and TFAM-null cells are respiratory deficient. TFAM loss in epidermal keratinocytes reduced epidermal levels of HIF-1α protein and diminished the hypoxic induction of HIF-dependent transcription in epidermis. Furthermore, epidermal TFAM deficiency impaired hypoxic induction of renal Epo expression. Our results demonstrate that the mitochondrial respiratory chain is essential for in vivo HIF activation and organismal adaptation to hypoxia.
Copyright © 2016 The Authors. Published by Elsevier Inc. All rights reserved.
Figures
Similar articles
-
Epidermal sensing of oxygen is essential for systemic hypoxic response.Cell. 2008 Apr 18;133(2):223-34. doi: 10.1016/j.cell.2008.02.038. Cell. 2008. PMID: 18423195 Free PMC article.
-
Up-regulation of hypoxia-inducible factors HIF-1alpha and HIF-2alpha under normoxic conditions in renal carcinoma cells by von Hippel-Lindau tumor suppressor gene loss of function.Oncogene. 2000 Nov 16;19(48):5435-43. doi: 10.1038/sj.onc.1203938. Oncogene. 2000. PMID: 11114720
-
Mitochondrial complex III regulates hypoxic activation of HIF.Cell Death Differ. 2008 Apr;15(4):660-6. doi: 10.1038/sj.cdd.4402307. Epub 2008 Jan 25. Cell Death Differ. 2008. PMID: 18219320 Review.
-
In vivo evidence suggesting reciprocal renal hypoxia-inducible factor-1 upregulation and signal transducer and activator of transcription 3 activation in response to hypoxic and non-hypoxic stimuli.Clin Exp Pharmacol Physiol. 2013 Apr;40(4):262-72. doi: 10.1111/1440-1681.12064. Clin Exp Pharmacol Physiol. 2013. PMID: 23384058
-
Melatonin and the von Hippel-Lindau/HIF-1 oxygen sensing mechanism: A review.Biochim Biophys Acta. 2016 Apr;1865(2):176-83. doi: 10.1016/j.bbcan.2016.02.004. Epub 2016 Feb 17. Biochim Biophys Acta. 2016. PMID: 26899267 Review.
Cited by
-
Metabolic Rewiring in Response to Biguanides Is Mediated by mROS/HIF-1a in Malignant Lymphocytes.Cell Rep. 2019 Dec 3;29(10):3009-3018.e4. doi: 10.1016/j.celrep.2019.11.007. Cell Rep. 2019. PMID: 31801069 Free PMC article.
-
Germinal centers FAMished without TFAM.Nat Immunol. 2023 Jun;24(6):893-894. doi: 10.1038/s41590-023-01507-z. Nat Immunol. 2023. PMID: 37106041 No abstract available.
-
STING regulates metabolic reprogramming in macrophages via HIF-1α during Brucella infection.PLoS Pathog. 2021 May 14;17(5):e1009597. doi: 10.1371/journal.ppat.1009597. eCollection 2021 May. PLoS Pathog. 2021. PMID: 33989349 Free PMC article.
-
Molecular mechanisms of retinal ischemia.Curr Opin Physiol. 2019 Feb;7:41-48. doi: 10.1016/j.cophys.2018.12.008. Epub 2018 Dec 28. Curr Opin Physiol. 2019. PMID: 34322649 Free PMC article.
-
Alteration of the HIF-1α/VEGF Signaling Pathway and Disruption of the Cell Cycle by Second Generation Carbosilan Dendrimers.Biomacromolecules. 2022 Dec 12;23(12):5043-5055. doi: 10.1021/acs.biomac.2c00899. Epub 2022 Nov 29. Biomacromolecules. 2022. PMID: 36445323 Free PMC article.
References
-
- Bedogni B, Welford SM, Cassarino DS, Nickoloff BJ, Giaccia AJ, Powell MB. The hypoxic microenvironment of the skin contributes to Akt-mediated melanocyte transformation. Cancer Cell. 2005;8:443–454. - PubMed
-
- Brunelle JK, Bell EL, Quesada NM, Vercauteren K, Tiranti V, Zeviani M, Scarpulla RC, Chandel NS. Oxygen sensing requires mitochondrial ROS but not oxidative phosphorylation. Cell Metab. 2005;1:409–414. - PubMed
Publication types
MeSH terms
Substances
Grants and funding
- R21 AR061174/AR/NIAMS NIH HHS/United States
- P30 AR057216/AR/NIAMS NIH HHS/United States
- 521HL112329-02/HL/NHLBI NIH HHS/United States
- K01 AR066579/AR/NIAMS NIH HHS/United States
- T32 HL076139-11/HL/NHLBI NIH HHS/United States
- F32 HL099007/HL/NHLBI NIH HHS/United States
- P30 CA060553/CA/NCI NIH HHS/United States
- 5R21AR061174-02/AR/NIAMS NIH HHS/United States
- 1F32HL099007-01/HL/NHLBI NIH HHS/United States
- T32 CA070085/CA/NCI NIH HHS/United States
- T32 GM008152/GM/NIGMS NIH HHS/United States
- 5P30AR057216/AR/NIAMS NIH HHS/United States
- R21 HL112329/HL/NHLBI NIH HHS/United States
- T32 T32HL076139/HL/NHLBI NIH HHS/United States
- T32 HL076139/HL/NHLBI NIH HHS/United States
LinkOut - more resources
Full Text Sources
Other Literature Sources
Molecular Biology Databases
Research Materials
