. 2016 Apr 12:4:15.
doi: 10.1186/s40168-016-0160-7.

Interpreting Prevotella and Bacteroides as biomarkers of diet and lifestyle

Affiliations

Interpreting Prevotella and Bacteroides as biomarkers of diet and lifestyle

Anastassia Gorvitovskaia et al. Microbiome. .

Abstract

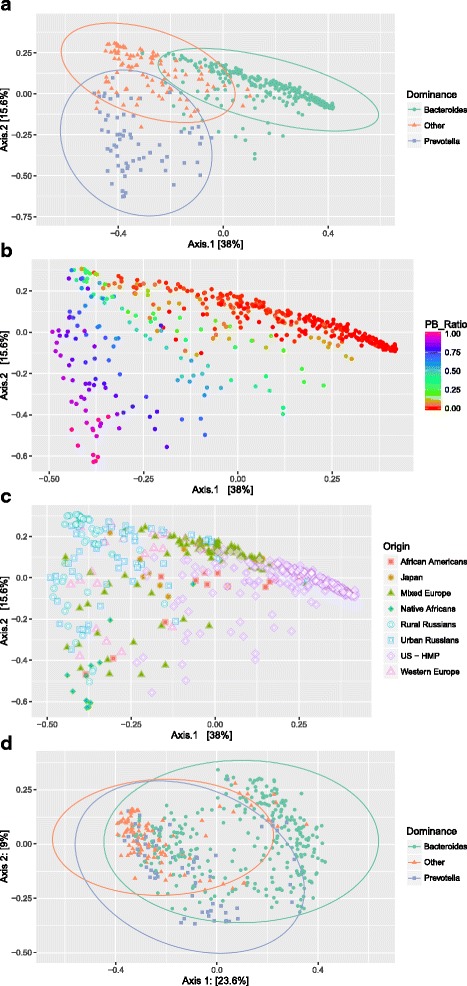
Background: In a series of studies of the gut microbiome, "enterotypes" have been used to classify gut microbiome samples that cluster together in ordination analyses. Initially, three distinct enterotypes were described, although later studies reduced this to two clusters, one dominated by Bacteroides or Clostridiales species found more commonly in Western (American and Western European) subjects and the other dominated by Prevotella more often associated with non-Western subjects. The two taxa, Bacteroides and Prevotella, have been presumed to represent consistent underlying microbial communities, but no one has demonstrated the presence of additional microbial taxa across studies that can define these communities.

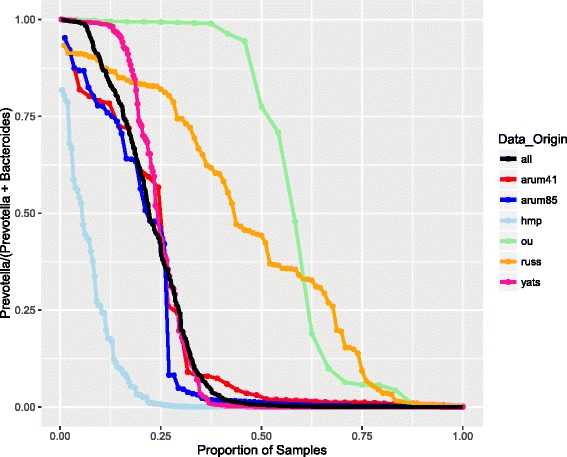
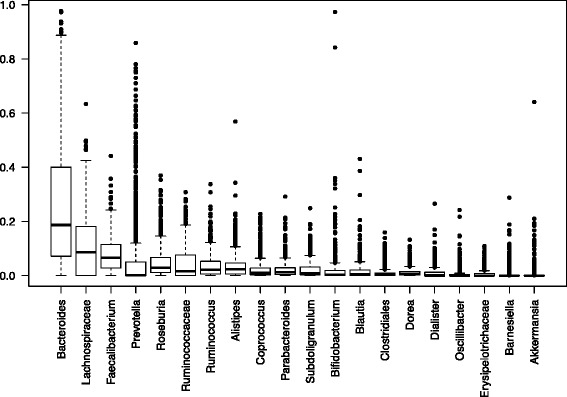
Results: We analyzed the combined microbiome data from five previous studies with samples across five continents. We clearly demonstrate that there are no consistent bacterial taxa associated with either Bacteroides- or Prevotella-dominated communities across the studies. By increasing the number and diversity of samples, we found gradients of both Bacteroides and Prevotella and a lack of the distinct clusters in the principal coordinate plots originally proposed in the "enterotypes" hypothesis. The apparent segregation of the samples seen in many ordination plots is due to the differences in the samples' Prevotella and Bacteroides abundances and does not represent consistent microbial communities within the "enterotypes" and is not associated with other taxa across studies. The projections we see are consistent with a continuum of values created from a simple mixture of Bacteroides and Prevotella; these two biomarkers are significantly correlated to the projection axes. We suggest that previous findings citing Bacteroides- and Prevotella-dominated clusters are the result of an artifact caused by the greater relative abundance of these two taxa over other taxa in the human gut and the sparsity of Prevotella abundant samples.

Conclusions: We believe that the term "enterotypes" is misleading because it implies both an underlying consistency of community taxa and a clear separation of sets of human gut samples, neither of which is supported by the broader data. We propose the use of "biomarker" as a more accurate description of these and other taxa that correlate with diet, lifestyle, and disease state.

Keywords: Biomarkers; Enterotypes; Human gut; Microbiome.


Figures

Fig. 1
Fig. 1
PCoA plots using the Bray distance metric with all the samples except for the Yatsunenko study. a Samples colored by their most prominent taxon. If the sample is dominated neither by Prevotella nor Bacteroides, it is classified as other. Ellipses were projected for each group in the plot. The ellipse axes represent the directions of the within-group covariance matrices, and their bounds represent two standard deviations in each direction from the cluster mean. b Samples are colored by their value for the Prevotella ratio (relative abundance of Prevotella/[Bacteroides + Prevotella]) on a spectrum with red indicating no Prevotella and purple no Bacteroides. c Samples are colored by population of origin. d The Bray distance has been recalculated without the relative abundances of Bacteroides and Prevotella. Samples are colored by most prominent taxon in the original samples distributions, and ellipses were projected for each group in the plot (same as in plot a)
Fig. 2
Fig. 2
Prevotella ratio distributions (relative abundance of Prevotella/[Bacteroides + Prevotella]) within each population. The x-axis represents quantiles (from 0 to 1) to facilitate simultaneous plotting. The black line represents all the samples. The green points are from the Native African vs. African American Ou et al. study, the yellow points are from the Russian Urban vs Rural Tyakht et al. study, the pink points are from the Malawi, Venezuela, US Yatsunenko et al. study, the red points are from the Mixed Europe and Asia Arumugam et al. study, the blue points are from the European Arumugam et al. study, and the light blue points are from the NIH Human Microbiome Project study
Fig. 3
Fig. 3
Boxplot of the top 20 taxa across all the studies. The dark horizontal line represents the mean relative abundance, and the box represents the bounds of the 25th and 75th percentiles

References

    1. Arumugam M, Raes J, Pelletier E, Le Paslier D, Yamada T, Mende DR, et al. Enterotypes of the human gut microbiome. Nature. 2011;473(7346):174–80. doi: 10.1038/nature09944. - DOI - PMC - PubMed
    1. Wu GD, Chen J, Hoffmann C, Bittinger K, Chen Y-Y, Keilbaugh SA, et al. Linking long-term dietary patterns with gut microbial E=enterotypes. Science. 2011;334(6052):105–8. doi: 10.1126/science.1208344. - DOI - PMC - PubMed
    1. Huse SM, Ye Y, Zhou Y, Fodor AA. A core human microbiome as viewed through 16S rRNA sequence clusters. PLoS One. 2012;7(6):e34242. doi: 10.1371/journal.pone.0034242. - DOI - PMC - PubMed
    1. Jeffery IB, Claesson MJ, O’Toole PW, Shanahan F. Categorization of the gut microbiota: enterotypes or gradients? Nat Rev Micro. 2012;10(9):591–2. doi: 10.1038/nrmicro2859. - DOI - PubMed
    1. Koren O, Knights D, Gonzalez A, Waldron L, Segata N, Knight R, et al. A guide to enterotypes across the human body: meta-analysis of microbial community structures in human microbiome datasets. PLoS Comput Biol. 2013;9(1):e1002863. doi: 10.1371/journal.pcbi.1002863. - DOI - PMC - PubMed

Publication types