

doi: 10.1038/srep24084.
ClusterViSu, a method for clustering of protein complexes by Voronoi tessellation in super-resolution microscopy
Affiliations
- PMID: 27068792
- PMCID: PMC4828638
- DOI: 10.1038/srep24084
Item in Clipboard
ClusterViSu, a method for clustering of protein complexes by Voronoi tessellation in super-resolution microscopy
Sci Rep.
.
Abstract
Super-resolution microscopy (PALM, STORM etc.) provides a plethora of fluorescent signals in dense cellular environments which can be difficult to interpret. Here we describe ClusterViSu, a method for image reconstruction, visualization and quantification of labelled protein clusters, based on Voronoi tessellation of the individual fluorescence events. The general applicability of this clustering approach for the segmentation of super-resolution microscopy data, including for co-localization, is illustrated on a series of important biological objects such as chromatin complexes, RNA polymerase, nuclear pore complexes and microtubules.
Figures
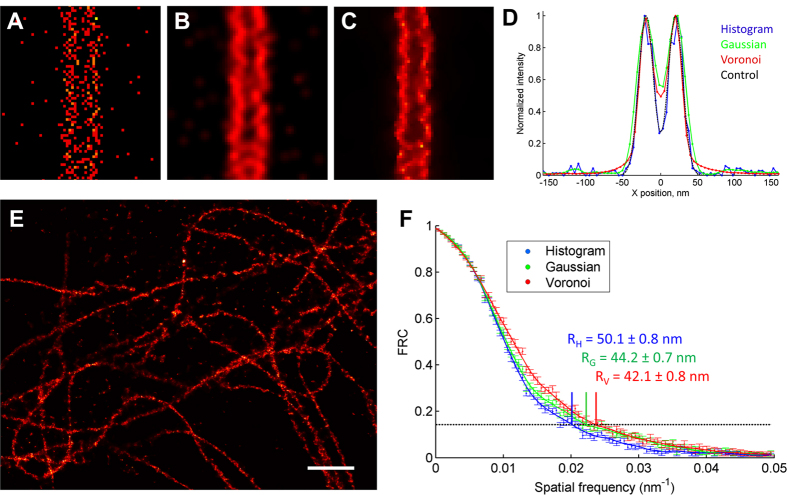
(A–C) Simulated images of two lines separated by 40 nm and composed of localization events with a standard deviation of 10 nm in histogram (A), Gaussian (B) and Voronoi-based interpolated (C) local density representations. (D) Corresponding image projections generate back the underlying line structure – sum of two Gaussians (black dashed line); for line profiles see Fig. S1D. Each graph is normalized on its peak value; pixel size is 5 nm. (E) Voronoi density map of β-tubulin detected with Alexa-647 conjugated secondary antibodies. Pixel size is 10 nm, scale bar is 1 μm. (F) FRC curves calculated from a larger image containing (E) in histogram (blue), Gaussian (green) and Voronoi (red) representations with corresponding resolutions RH, RG and RV obtained by the 1/7th FRC criterion, showing that the best resolution is obtained by Voronoi representation. The dataset used for calculation of FRC contained 2.3 · 105 localizations, the images in the three representations were reconstructed using a pixel size of 10 nm.
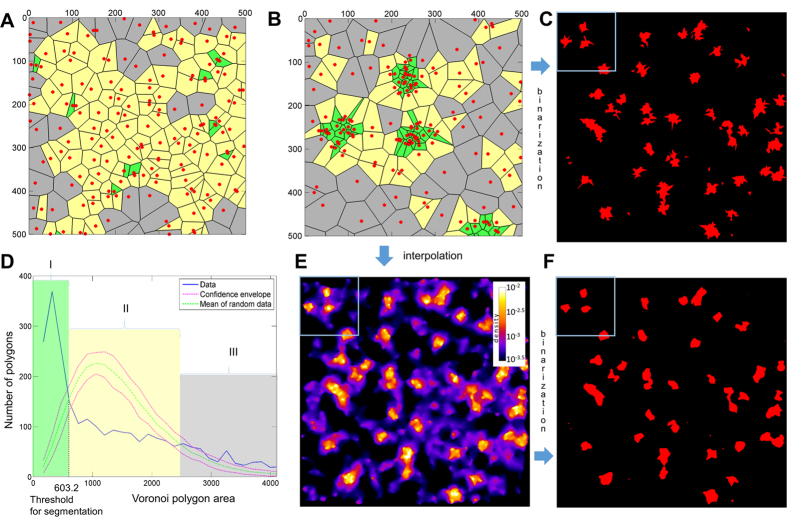
(A) A region of simulated pointillist data with random distribution. (B) Simulated clustered distribution of the same number of points as in the random dataset. (C) Clustering obtained after direct segmentation of the Voronoi diagram allowing visualization of the clusters. (D) Distribution of Voronoi polygon areas of the clustered dataset (blue) and mean Voronoi polygon distribution of a random dataset (green) with confidence envelope (red) obtained from Monte-Carlo simulations which allows defining a threshold value for automated segmentation. The three characteristic regions: small clustered polygons (I, green); intermediate polygons corresponding to the random distribution (II, yellow); huge polygons corresponding to background in the clustered distribution (III, gray). (E) Interpolation of the local densities to pixel grid produces local density map. (F) Clusters, obtained by thresholding of the density map. The simulated dataset contained 48 clusters with a radius of 50 nm consisting of ~27 events each. After segmentation, the Voronoi tessellation allows quantification of the clusters (35 were detected, excluding small clusters that contained only one localization event, with 29 ± 16 events each and with equivalent radius of 49 ± 11 nm). The blue frames in (C,E,F) correspond to the region shown in panel (B).
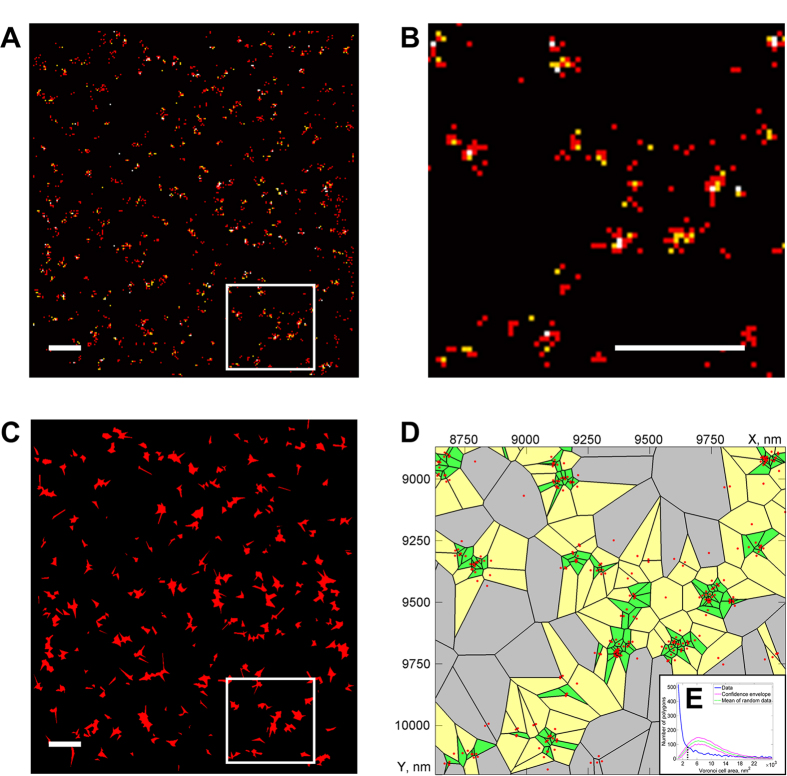
(A) Histogram-based image reconstruction of TPR distribution at the nuclear envelope with a magnified region (white box) in (B). (C) Segmented Voronoi diagram calculated from the image in (A) with magnified region of the diagram shown in (D) which allows visualization and quantification of the TPR clusters present in the magnified region of the original image (panel B) in which quantification was not straightforward. (E) Voronoi polygon distribution of TPR (blue) demonstrating clustering as compared to random distributions (green and red). The clusters contain 9.7 ± 7.3 events with an equivalent radius of 57 ± 11 nm. Small clusters containing 2 or less events were excluded for this quantification. Scale bars correspond to 500 nm (A–C), pixel size is 20 nm (A,B).
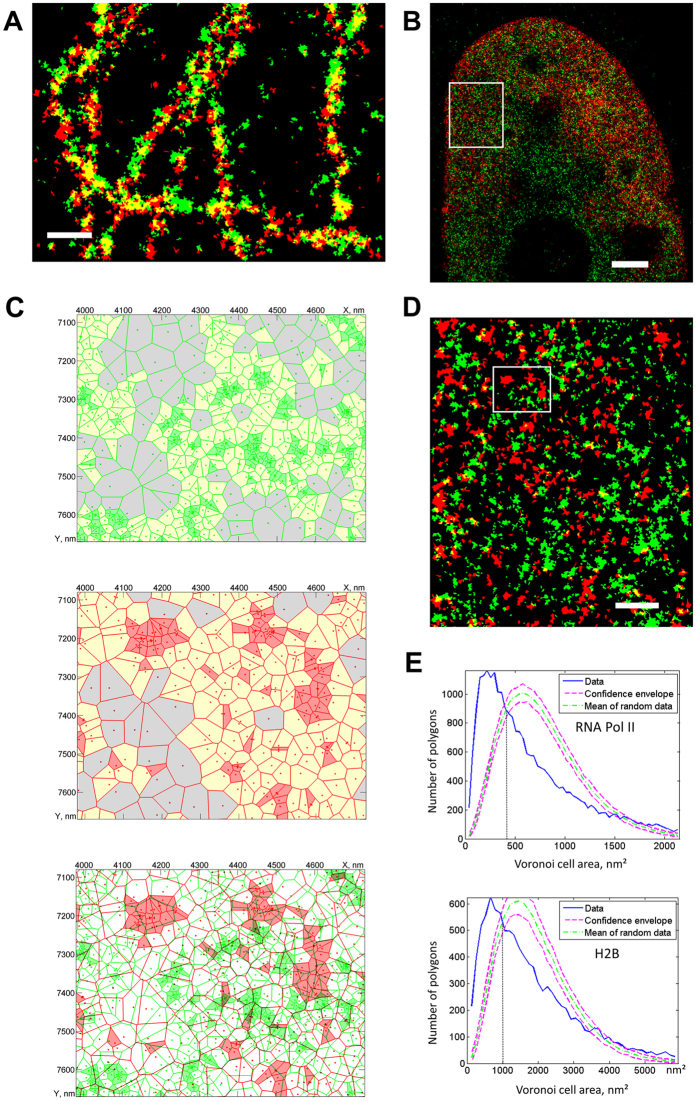
(A) Segmented Voronoi diagram of β-tubulin, labelled with two different fluorophores (Alexa Fluor-555, green, and Alexa Fluor-647, red) demonstrating strong co-localization (S/Sred = 0.416, S/Sgreen = 0.405) compared to randomly distributed clusters (Srand/Sred = 0.123 ± 0.021, Srand/Sgreen = 0.120 ± 0.020). (B) A cell nucleus with labelled RNA Pol II (green) and histone H2B (red), represented as Voronoi local density map. (C) Example of Voronoi diagrams for RNA Pol II, H2B and their overlay, revealing no co-localization. (D) Segmented Voronoi diagram, used for determination of cluster properties (average cluster size: RNA Pol II 1818 nm2, H2B 3058 nm2) and for calculation of co-localization (S/SPol = 0.090, S/SH2B = 0.106; random: Srand/SPol = 0.096 ± 0.013, Srand/SH2B = 0.113 ± 0.015) revealing no correlation between the two distributions of clusters. (E) Voronoi polygon distributions of the clustered dataset (blue) and mean density distribution of the random datasets (green) with confidence envelopes (red) obtained from Monte-Carlo simulations for the RNA Pol II and H2B data. Scale bars 300 nm (A), 2 μm (B), 500 nm (D); panel (D) corresponds to the frame in panel (B) and (C) to that in panel (D).
References
-
- Szymborska A. et al. Nuclear Pore Scaffold Structure Analyzed by Super-Resolution Microscopy and Particle Averaging. Science 341, 655–658 (2013). - PubMed
-
- Banterle N., Khanh H. B., Lemke E. A. & Beck M. Fourier ring correlation as a resolution criterion for super-resolution microscopy. J. Struct. Biol. 183, 363–367 (2013). - PubMed
-
- Baddeley D., Cannell M. B. & Soeller C. Visualization of Localization Microscopy Data. Microsc. Microanal. 16, 64–72 (2010). - PubMed
Publication types
MeSH terms
Substances
Grants and funding
LinkOut - more resources
Full Text Sources
Other Literature Sources
