. 2016 Jun 23;127(25):3215-24.
doi: 10.1182/blood-2016-01-688796. Epub 2016 Apr 11.

The BCL2 selective inhibitor venetoclax induces rapid onset apoptosis of CLL cells in patients via a TP53-independent mechanism

Affiliations

The BCL2 selective inhibitor venetoclax induces rapid onset apoptosis of CLL cells in patients via a TP53-independent mechanism

Mary Ann Anderson et al. Blood. .

Abstract

BCL2 blunts activation of the mitochondrial pathway to apoptosis, and high-level expression is required for chronic lymphocytic leukemia (CLL) survival. Venetoclax (ABT-199) is a small-molecule selective inhibitor of BCL2 currently in clinical trials for CLL and other malignancies. In conjunction with the phase 1 first-in-human clinical trial of venetoclax in patients with relapsed or refractory CLL (M12-175), we investigated the mechanism of action of venetoclax in vivo, explored whether in vitro sensitivity assays or BH3 profiling correlated with in vivo responses in patients, and determined whether loss of TP53 function affected responses in vitro and in vivo. In all samples tested, venetoclax induced death of CLL cells in vitro at concentrations achievable in vivo, with cell death evident within 4 hours. Apoptotic CLL cells were detected in vivo 6 or 24 hours after a single 20-mg or 50-mg dose in some patients. The extent of mitochondrial depolarization by a BIM BH3 peptide in vitro was correlated with percentage reduction of CLL in the blood and bone marrow in vivo, whereas the half lethal concentration derived from standard cytotoxicity assays was not. CLL cell death in vitro and the depth of clinical responses were independent of deletion of chromosome 17p, TP53 mutation, and TP53 function. These data provide direct evidence that venetoclax kills CLL cells in a TP53-independent fashion by inhibition of BCL2 in patients and support further assessment of BH3 profiling as a predictive biomarker for this drug.


Figures

Figure 1
Figure 1
CLL cells from PB and BM are highly sensitive to venetoclax in vitro. (A) Fitted mean concentration-response curve (solid line) ± 95% prediction bands (thin lines) derived from data of 33 individual PB CLL samples from patients screened for the M12-175 trial. Circles and error bars represent the observed means ± standard deviations. CLL cells were incubated for 24 hours with varying concentrations of venetoclax (0.0128-1000 nM) or DMSO, and CD5+CD19+PI cells were enumerated. Percent CLL viability was determined by normalizing against the number of viable CLL cells in the corresponding DMSO-treated wells (mean viability 93% [range 68% to 99%]). The horizontal lines indicate 50% (gray, solid) and 90% (black, dotted) cell death. The estimated LC50 was 1.9 nM, and the 90% lethal concentration was 105 nM. The blue shaded area indicates the range of steady-state plasma concentrations of venetoclax at a dose of 400 mg daily, ranging between the mean trough (dashed blue line) and peak postdose (solid blue line) concentrations. (B) CLL cells die rapidly in vitro. Mean fitted concentration-response curve (solid line) for 7 PB or BM CLL samples from 5 patients incubated for only 4 hours. The dashed green line (300 nM) represents the concentration approximating the observed peak plasma concentration after a single dose of 50 mg venetoclax in the M12-175 trial; the dashed red line (1.3 μM) represents the peak concentration observed after a single dose of 200 mg. (C) Correlation of individual LC50 values for paired PB and BM CLL cells from the same patient at screening incubated in parallel for 24 hours (n = 32; P < .0001, R2 = 0.83). (D) Correlation of mitochondrial depolarization as assessed by percentage cytochrome C loss induced by exposure to venetoclax or to BAD BH3 peptide in the BH3 profiling assay in screening PB samples from 13 CLL patients treated on the M12-175 trial (n = 13; P = .0001, R2 = 0.75).
Figure 2
Figure 2
CLL cells undergo apoptosis in vivo after the first dose of venetoclax. Increase in the percentage of CLL cells with detectable exposure of PS after a single dose of 20 mg (dashed) or 50 mg (solid) of venetoclax among 15 patients dosed with the drug for the first time. PS exposure was detected by FITC-conjugated annexin V. Paired Student t test P = .0006 for comparison between pre-venetoclax 0 hour collection and peak post-venetoclax collection (at either 6 or 24 hours post first dose).
Figure 3
Figure 3
In vitro sensitivity of CLL at screening does not predict for clinical outcomes. (A) Lymphocyte response. For patients with lymphocytosis >5 × 10⁹/L at screening, the percentage reduction in lymphocyte count at week 6 on venetoclax did not correlate with the screening in vitro sensitivity (n = 13; R2 < 0.001). Data points are color coded by cohort dose (≥400 mg in black or <400 mg in gray); lack of correlation is not explained by differences in dose of venetoclax (R2 = 0.001 for patients receiving ≥400 mg/d only). (B) Nodal response. The percentage reduction in the lymph node mass (represented by the SPD of 6 target lesions on CT) at week 6 on venetoclax did not correlate with the screening in vitro sensitivity (n = 22; R2 = 0.07). Data points color coded by cohort dose (≥400 mg in black or <400 mg in gray); lack of correlation is not explained by differences in dose of venetoclax (R2 < 0.01 for patients receiving ≥400 mg/d only). (C) Marrow response. The percentage reduction in BM CLL infiltration at week 24 on venetoclax did not correlate with screening in vitro sensitivity (n = 17; R2 = 0.006). Data points color coded by cohort dose (≥400 mg in black or <400 mg in gray); lack of correlation is not explained by differences in dose of venetoclax (R2 = 0.006 for patients receiving ≥400 mg/d only). (D) Best iwCLL response. Correlation between screening PB CLL LC50 and overall best objective response to venetoclax observed for 22 CLL patients on the M12-175 study as judged by iwCLL criteria (ANOVA P = .42). Data points color coded by cohort dose (≥400 mg in black or <400 mg in gray); lack of correlation is not explained by differences in dose of venetoclax (ANOVA P = .47 for patients receiving ≥400 mg/d only). CR, complete remission or complete remission with incomplete count recovery; PR, partial response; SD, stable disease.
Figure 4
Figure 4
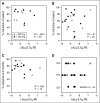
Correlation between mitochondrial priming and in vivo response in the PB, lymph node, and BM compartments. (A) Lymphocyte response. Correlation between percentage reduction in the absolute lymphocyte count at 6 weeks in CLL patients on the M12-175 trial and mitochondrial priming, as assessed by percentage cytochrome C loss after exposure of CLL cells (mean viability after thawing 92% [range 80% to 98%]) to BIM BH3 peptide at 0.8 μM (P = .05, R2 = 0.23), in 13 evaluable patients with lymphocytosis at study entry. (B) Nodal response. Correlations between percentage reductions in the SPD of target lymph nodes at 6 weeks and mitochondrial priming (P = .19, R2 = 0.14) in 14 evaluable patients. (C) Marrow response. Correlation between percentage reduction in CLL cell BM infiltrate at first restaging at approximately week 24 and mitochondrial priming (P = .01, R2 = 0.63) in 9 evaluable patients.
Figure 5
Figure 5
Venetoclax kills CLL cells, murine lymph node B cells, and RS4;11 human lymphoblast cell lines irrespective of TP53 deletion, mutation, or function. (A) For patient CLL samples, the 24-hour in vitro sensitivity to venetoclax did not differ based on del(17p) status (Student t test P = .44). Deletion 17p was detected by fluorescence in situ hybridization in 18 of 55 samples; the median percentage of del(17p) cells was 44.5% (range 7.5% to 95%) in those samples. (B) For murine lymph node B cells, the concentration-response curves for venetoclax are plotted for isogenic Trp53 wild-type (blue; WT) and Trp53−/− (red; p53KO) mice in the left panel, and for nutlin-3a in the right panel. All cells were incubated for 24 hours. n = 3 independent experiments. p53KO, p53 knockout. (C) For RS4;11 human B-cell lymphoblast cell lines, the concentration-response curves for venetoclax (left panel; 24 hour incubation) are plotted for TP53 wild-type cell lines (blue; Control) bearing a nontargeting sGuide and TP53-deficient cells (red; sgTP53) bearing a TP53targeting sGuide (see “Methods”). Loss of TP53 expression was confirmed by western blot (supplemental Figure 4). The concentration-response curves for nutlin-3a after a 3-day incubation are shown in the right panel. n = 5 independent experiments of pools of cells. (D) For patient CLL samples, the 24-hour in vitro sensitivity to venetoclax of CLL for 31 patients did not differ between samples with both del(17p) and TP53 mutation (n = 11) compared with those with neither del(17p) nor TP53 mutation (n = 20; unpaired Student t test P = .40). Del(17p) was present in a median 52.5% (range 24% to 82%) of CLL cells in the double detected group. Det, detected; mut, mutated. (E) The 72-hour in vitro sensitivity of CLL to nutlin-3a for 17 patients differed between those with both del(17p) and TP53 mutation (n = 5) and those with neither del(17p) nor TP53 mutation (n = 12; unpaired Student t test P < .0001). Del(17p) was present in a median 52.5% (range 26.5% to 58%) of CLL cells in the double detected group.
Figure 6
Figure 6
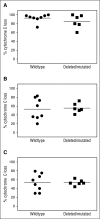
BH3 profiling demonstrates equivalent levels of mitochondrial priming and BCL2 dependence in CLL cells with del(17p) or TP53 mutation compared with wild-type CLL. (A) BIM BH3 peptide. Lack of correlation between the del(17p) or TP53 mutation status of CLL patients on the M12-175 trial and mitochondrial priming, as assessed by percent cytochrome C loss after exposure of CLL cells to BIM BH3 peptide at 0.8 μM (P = .55). Horizontal line represents the mean. n = 8 for CLL without del(17p) or a TP53 mutation, and n = 6 for CLL with either del(17p) or TP53 mutation. (B) BAD BH3 peptide. Lack of correlation of del(17p)/TP53 mutation status and functional dependence of CLL cells on BCL2 as assessed by percent cytochrome C loss after exposure of CLL cells to BAD BH3 peptide at 80 μM (P = .83). Horizontal line represents the mean. (C) Venetoclax. Lack of correlation of del(17p)/TP53 mutation status and functional dependence of CLL cells on BCL2 as assessed by percent cytochrome C loss after exposure of CLL cell mitochondria directly to the BH3 mimetic venetoclax 1 μM used analogously to a BH3 peptide in the BH3 profiling assay (P = .99). Horizontal line represents the mean.
Figure 7
Figure 7
TP53 status does not affect clinical parameters of response to venetoclax. (A) PB lymphocyte count. The greatest percentage reduction of PB lymphocyte count for 29 patients in M12-175 with a screening lymphocyte count ≥5 × 10⁹/L was examined, according to the TP53 status of their CLL: neither TP53 mutated nor del(17p) (n = 12); either TP53 mutated or del(17p) (n = 7); or both TP53 mutated and del(17p) (n = 10). There was no difference in depth of reductions: ANOVA P = .71 for comparison among 3 groups. (B) Lymph nodes. The greatest percentage reduction in SPD of 6 target lymph nodes on CT on venetoclax was examined for 48 patients according to the TP53 status of their CLL: neither del(17p) nor TP53 mutated (n = 21); either TP53 mutated or del(17p) (n = 13); or both del(17p) and TP53 mutated (n = 14). There was no difference in outcome between the 3 groups (ANOVA P = .70). (C) BM CLL infiltration. The greatest percentage reduction in BM infiltration by CLL was examined for 41 patients according to the TP53 status of their CLL: neither del(17p) nor TP53 mutated (n = 19); either TP53 mutated or del(17p) (n = 10); or both TP53 mutated and del(17p) (n = 12). The 3 groups demonstrated equal reduction in BM infiltration (ANOVA P = .58).

Comment in

  • To BH3 profile or not to BH3 profile.
    Blunt MD, Steele AJ. Blunt MD, et al. Blood. 2016 Jun 23;127(25):3111-2. doi: 10.1182/blood-2016-04-711762. Blood. 2016. PMID: 27340250 No abstract available.

References

    1. Hanahan D, Weinberg RA. The hallmarks of cancer. Cell. 2000;100(1):57–70. - PubMed
    1. Hanahan D, Weinberg RA. Hallmarks of cancer: the next generation. Cell. 2011;144(5):646–674. - PubMed
    1. Davids MS, Letai A. Targeting the B-cell lymphoma/leukemia 2 family in cancer. J Clin Oncol. 2012;30(25):3127–3135. - PMC - PubMed
    1. Llambi F, Moldoveanu T, Tait SW, et al. A unified model of mammalian BCL-2 protein family interactions at the mitochondria. Mol Cell. 2011;44(4):517–531. - PMC - PubMed
    1. Anderson MA, Huang D, Roberts A. Targeting BCL2 for the treatment of lymphoid malignancies. Semin Hematol. 2014;51(3):219–227. - PubMed

Publication types

MeSH terms