. 2016:2016:4743176.
doi: 10.1155/2016/4743176. Epub 2016 Mar 16.

Correlation of IL-18 with Tryptase in Atopic Asthma and Induction of Mast Cell Accumulation by IL-18

Affiliations

Correlation of IL-18 with Tryptase in Atopic Asthma and Induction of Mast Cell Accumulation by IL-18

Junling Wang et al. Mediators Inflamm. 2016.

Abstract

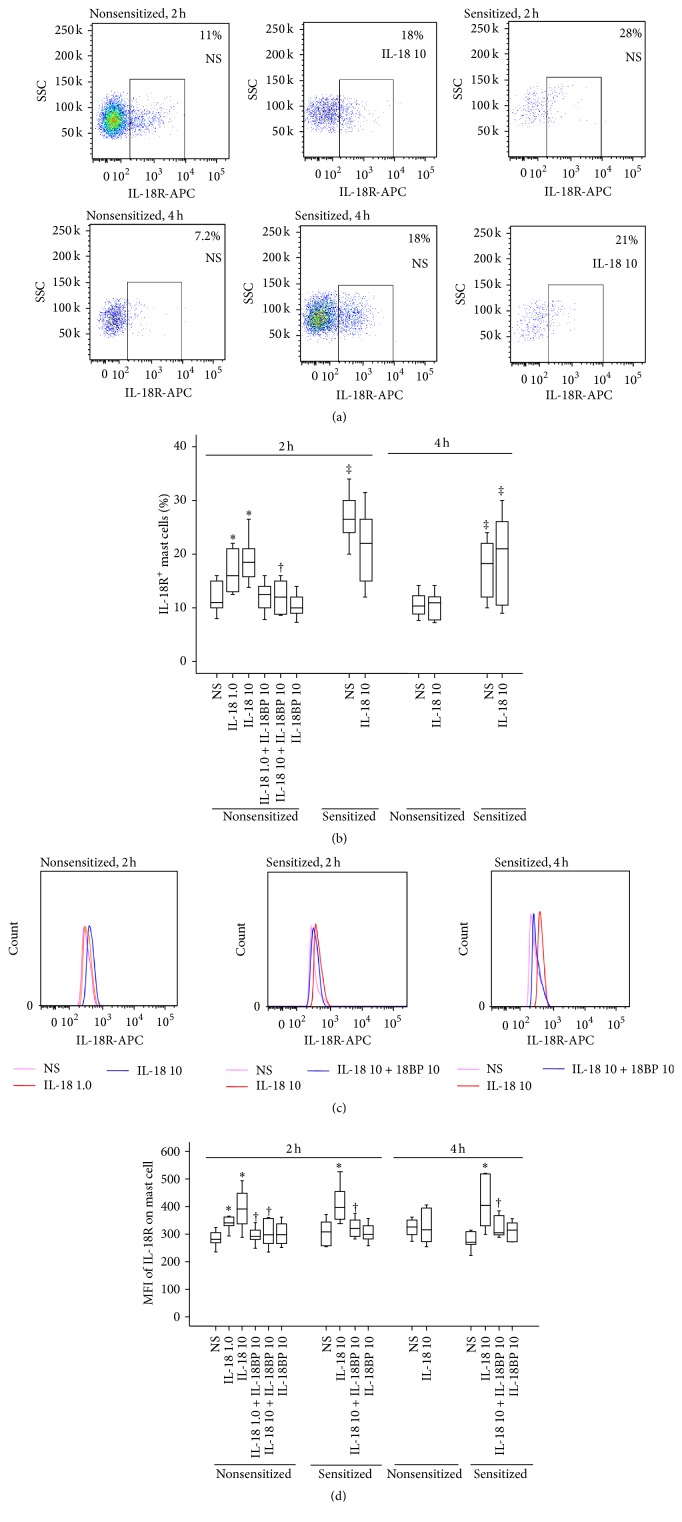
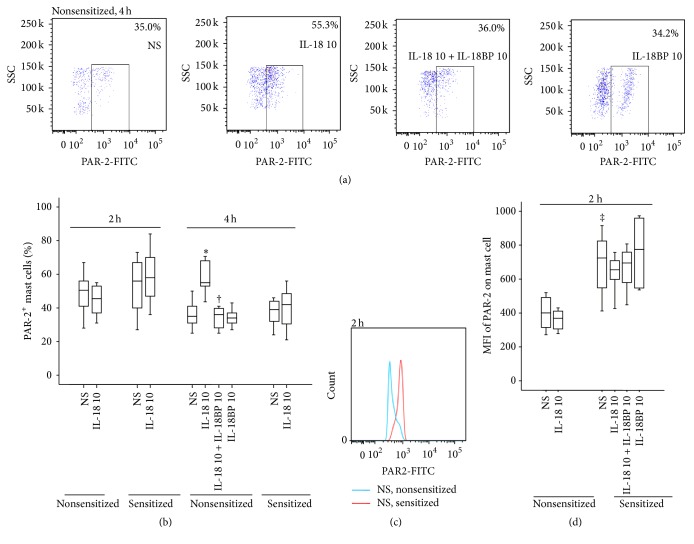
Interleukin- (IL-) 18 and tryptase were previously reported to relate to asthma, but the correlation between these two potent proinflammatory molecules in asthma and their roles in mast cell accumulation remain uninvestigated. Using flow cytometric analysis technique and ovalbumin- (OVA-) sensitized mouse model, it was found that IL-18 and tryptase levels in the plasma of moderate and severe asthma were elevated, and they correlated well with each other. Tryptase and agonist peptides of protease activated receptor- (PAR-) 2 induced substantial quantity of IL-18 release. IL-18 and tryptase provoked mast cell accumulation in peritoneum of OVA-sensitized mice. OVA-sensitization increased number of IL-18 receptor (R)(+) mast cells. IL-18 and tryptase induced dramatic increase in IL-18R(+) mast cells and mean fluorescence intensity (MFI) of IL-18R on mast cells. Moreover, while IL-18 induced an increase in PAR-2(+) mast cells in nonsensitized mice, IL-18 and tryptase provoked increases in IL-4 and thymic stromal lymphopoietin (TSLP) in the peritoneum of OVA-sensitized mice. In summary, the correlation between IL-18 and tryptase in plasma of patients with asthma indicates close interactions between them, which should be considered for development of anti-IL-18 and antitryptase therapies. Interactions between IL-18 and tryptase may contribute to mast cell recruitment in asthma.


Figures

Figure 1
Figure 1
Scatter plots of levels of (a) IL-18 and (b) tryptase in the plasma of asthma. Each symbol represents the value from 1 subject. The median value is indicated with a horizontal line.
Figure 2
Figure 2
Induction of IL-18 release in the peritoneum of mice by tryptase (Tryp, μg/mL) and agonists of PAR-2. (a) Nonsensitized mice were treated with Tryp with or without its inhibitors Aprotinin (μg/mL) and Leupeptin (μg/mL), tc-LIGRLO-NH2 (μM), tc-OLRGIL-NH2 (μM), SLIGRL-NH2 (μM), LRGILS-NH2 (μM), or FSLLRY-NH2 (FSL, μM) for 4 h; (b) OVA-sensitized and nonsensitized mice were treated with Tryp with or without FSL for 2 or 4 h. P < 0.05 compared with the corresponding normal saline (NS) group. P < 0.05 compared with the corresponding stimulus alone group.
Figure 3
Figure 3
Flow cytometric analysis of IL-18 (ng/mL) and tryptase (Tryp, μg/mL) induced mast cell (CCR3+HLA-DR cells) accumulation in the peritoneum of OVA-sensitized or nonsensitized mice. ((a) and (c)) Representative graphs of IL-18 and Tryp induced mast cell accumulation; (b) changes in the percentage of mast cells out of total peritoneal cells provoked by IL-18 in the presence or absence of IL-18BP (ng/mL); (d) changes in the percentage of mast cells provoked by Tryp in the presence or absence of FSLLRY-NH2 (FSL, μM). P < 0.05 compared with the corresponding nonsensitized mice. P < 0.05 compared with the corresponding normal saline (NS) group. P < 0.05 compared with the corresponding stimulus alone group.
Figure 4
Figure 4
Flow cytometric analysis of IL-18 (ng/mL) induced expression of IL-18 receptor (IL-18R) on mast cells (CCR3+HLA-DR cells) in the peritoneum of OVA-sensitized or nonsensitized mice. ((a) and (c)) Representative graphs of the proportion of IL-18R+ mast cells and mean fluorescence intensity (MFI) of IL-18R on mast cell, respectively; (b) changes in the percentage of IL-18R+ mast cells out of total peritoneal mast cells provoked by IL-18 in the presence or absence of IL-18BP (ng/mL); (d) changes in the MFI of IL-18R on mast cell provoked by IL-18. P < 0.05 compared with the corresponding nonsensitized mice. P < 0.05 compared with the corresponding normal saline (NS) group. P < 0.05 compared with the corresponding stimulus alone group.
Figure 5
Figure 5
Flow cytometric analysis of tryptase (Tryp, μg/mL) induced expression of IL-18 receptor (IL-18R) on mast cells (CCR3+HLA-DR cells) in the peritoneum of OVA-sensitized or nonsensitized mice. ((a) and (c)) Representative graphs of the proportion of IL-18R+ mast cells and mean fluorescence intensity (MFI) of IL-18R on mast cell, respectively; (b) changes in the percentage of IL-18R+ mast cells out of total peritoneal mast cells provoked by Tryp in the presence or absence of FSLLRY-NH2 (FSL, μM); (d) changes in the MFI of IL-18R on mast cell provoked by Tryp. P < 0.05 compared with the corresponding nonsensitized mice. P < 0.05 compared with the corresponding normal saline (NS) group. P < 0.05 compared with the corresponding stimulus alone group.
Figure 6
Figure 6
Flow cytometric analysis of IL-18 (ng/mL) induced expression of protease activated receptor- (PAR-) 2 on mast cells (CCR3+HLA-DR cells) in the peritoneum of OVA-sensitized or nonsensitized mice. ((a) and (c)) Representative graphs of the proportion of PAR-2+ mast cells and mean fluorescence intensity (MFI) of PAR-2 on mast cell, respectively; (b) changes in the percentage of PAR-2+ mast cells out of total peritoneal mast cells provoked by IL-18 in the presence or absence of IL-18BP (ng/mL); (d) changes in the MFI of PAR-2 on mast cell provoked by IL-18. P < 0.05 compared with the corresponding nonsensitized mice. P < 0.05 compared with the corresponding normal saline (NS) group. P < 0.05 compared with the corresponding stimulus alone group.
Figure 7
Figure 7
Flow cytometric analysis of tryptase (Tryp, μg/mL) induced expression of protease activated receptor- (PAR-) 2 on mast cells (CCR3+HLA-DR cells) in the peritoneum of OVA-sensitized or nonsensitized mice. (a) A representative graph of mean fluorescence intensity (MFI) of PAR-2 on mast cell; (b) changes in the MFI of PAR-2 on mast cell provoked by Tryp. P < 0.05 compared with the corresponding nonsensitized mice. P < 0.05 compared with the corresponding normal saline (NS) group.
Figure 8
Figure 8
IL-18 and tryptase (Tryp) induced IL-4 (a) and thymic stromal lymphopoietin (TSLP) (b) release in the peritoneum of OVA-sensitized or nonsensitized mice. Mice were treated with IL-18 (ng/mL) in the presence or absence of IL-18BP (ng/mL), Tryp (μg/mL) with or without FSLLRY-NH2 (FSL, μM) for 2 and 4 h before their peritoneal lavage being collected for ELISA analysis. Data were displayed as a boxplot, which indicates the median, interquartile range, the largest and smallest values other than outliers (whiskers). Each piece of data represented a group of 6-7 animals. P < 0.05 compared with the corresponding nonsensitized mice. P < 0.05 compared with the corresponding normal saline (NS) group. P < 0.05 compared with the corresponding stimulus alone group.

References

    1. Kawayama T., Okamoto M., Imaoka H., Kato S., Young H. A., Hoshino T. Interleukin-18 in pulmonary inflammatory diseases. Journal of Interferon and Cytokine Research. 2012;32(10):443–449. doi: 10.1089/jir.2012.0029. - DOI - PubMed
    1. Oda H., Kawayama T., Imaoka H., et al. Interleukin-18 expression, CD8+ T cells, and eosinophils in lungs of nonsmokers with fatal asthma. Annals of Allergy, Asthma and Immunology. 2014;112(1):23–28. doi: 10.1016/j.anai.2013.09.004. - DOI - PubMed
    1. Ando M., Shima M. Serum interleukins 12 and 18 and immunoglobulin E concentrations and allergic symptoms in Japanese schoolchildren. Journal of Investigational Allergology and Clinical Immunology. 2007;17(1):14–19. - PubMed
    1. Harada M., Obara K., Hirota T., et al. A functional polymorphism in IL-18 is associated with severity of bronchial asthma. American Journal of Respiratory and Critical Care Medicine. 2009;180(11):1048–1055. doi: 10.1164/rccm.200905-0652oc. - DOI - PubMed
    1. Murai H., Qi H., Choudhury B., et al. Alternaria-induced release of IL-18 from damaged airway epithelial cells: an NF-κB dependent mechanism of Th2 differentiation? PLoS ONE. 2012;7(2) doi: 10.1371/journal.pone.0030280.e30280 - DOI - PMC - PubMed

Publication types