. 2016 Mar 23;3(3):150690.
doi: 10.1098/rsos.150690. eCollection 2016 Mar.

Chatty maps: constructing sound maps of urban areas from social media data

Affiliations

Chatty maps: constructing sound maps of urban areas from social media data

Luca Maria Aiello et al. R Soc Open Sci. .

Abstract

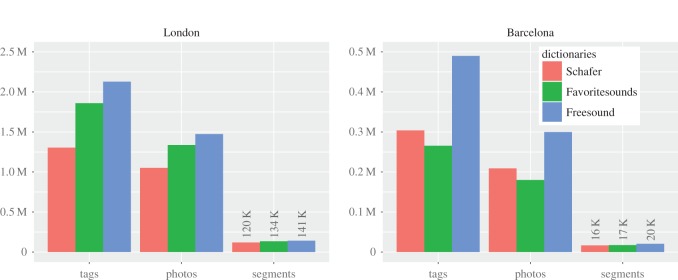
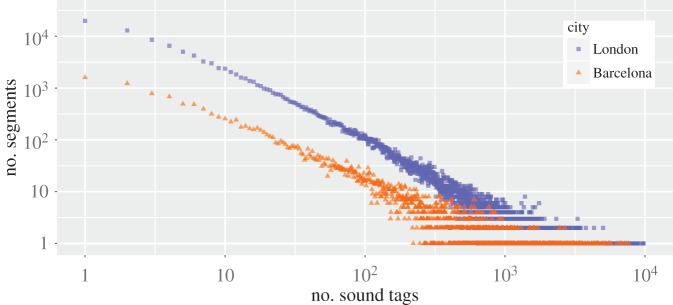
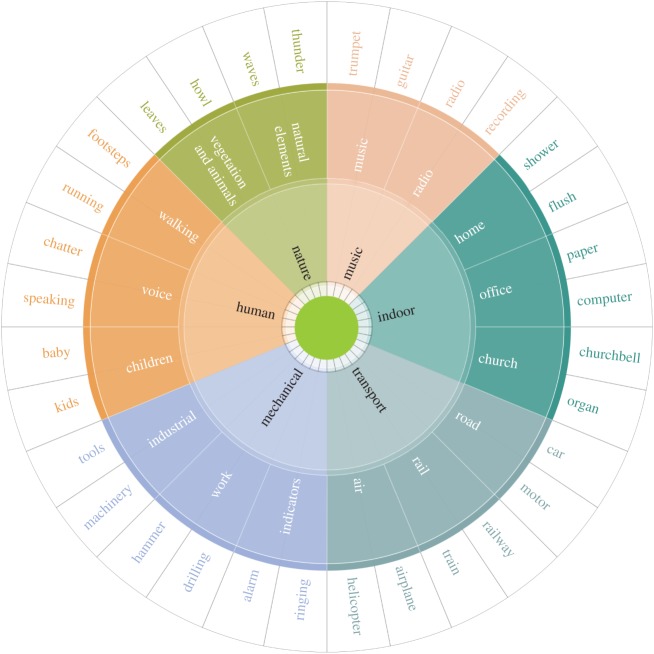
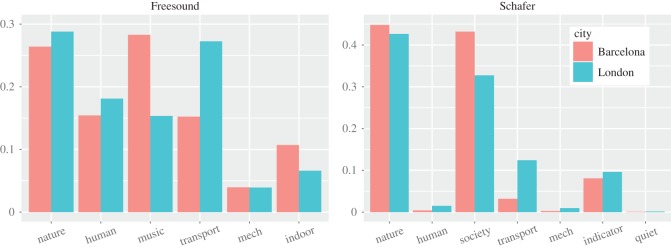
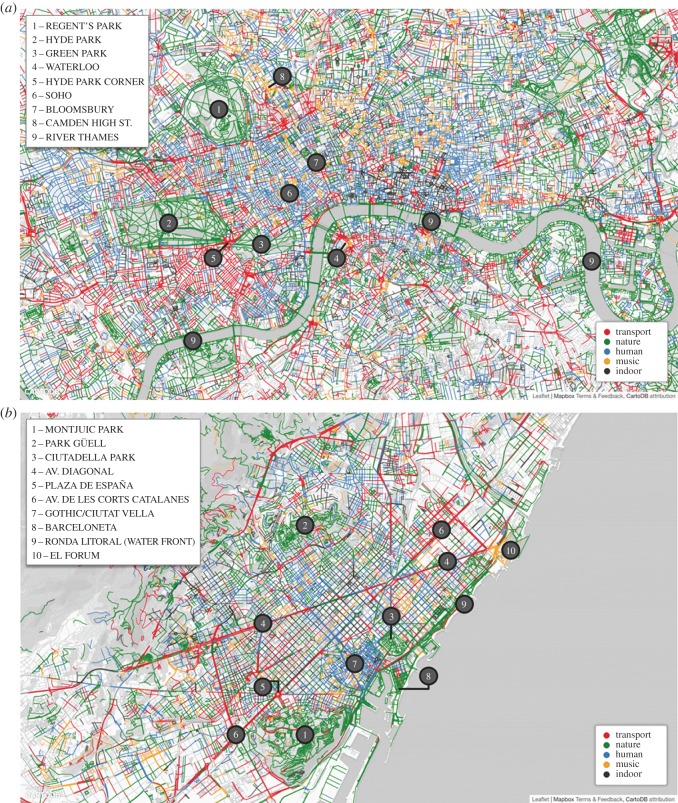
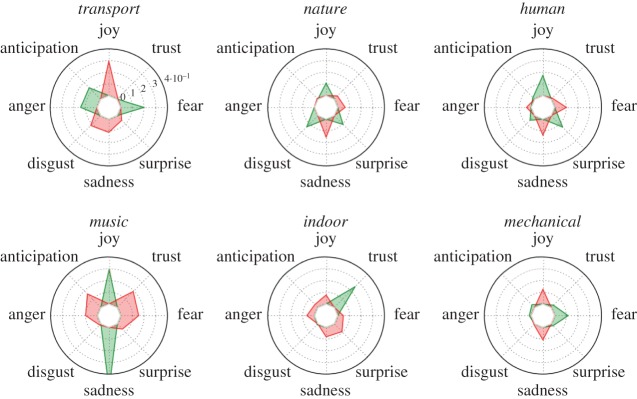
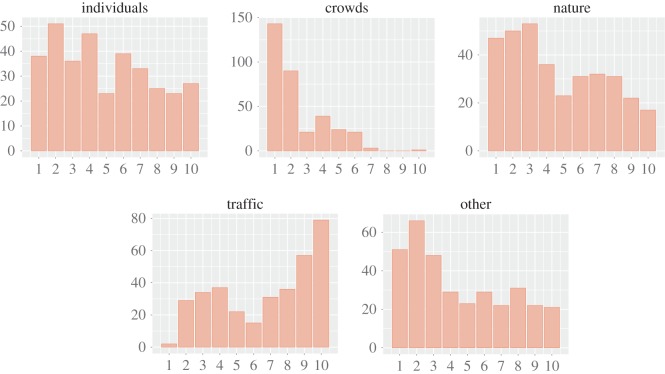
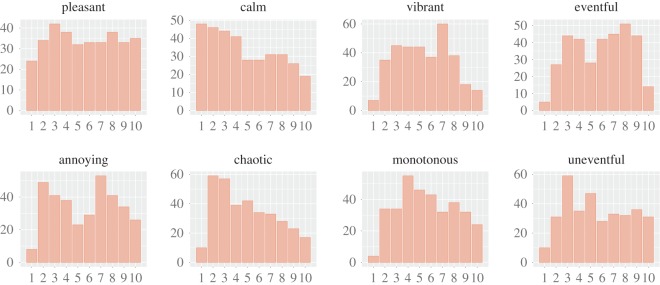
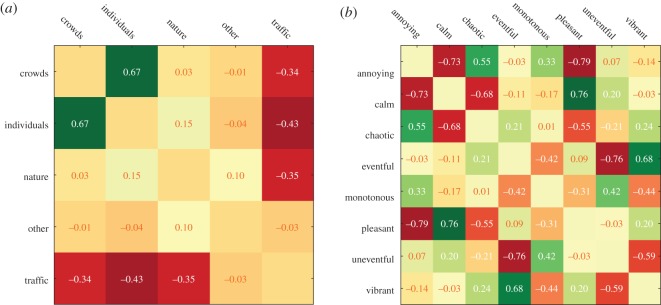
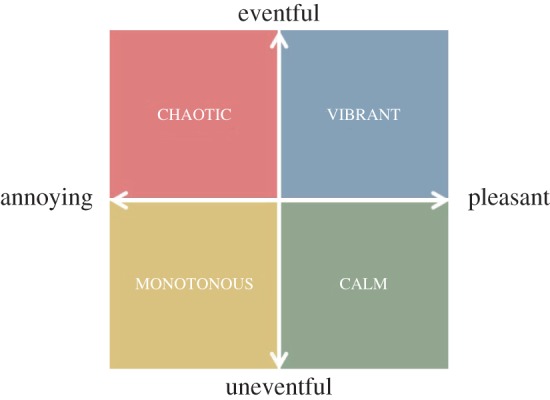
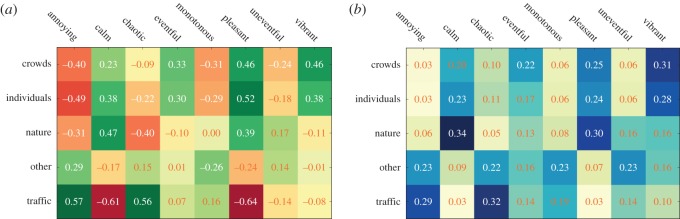
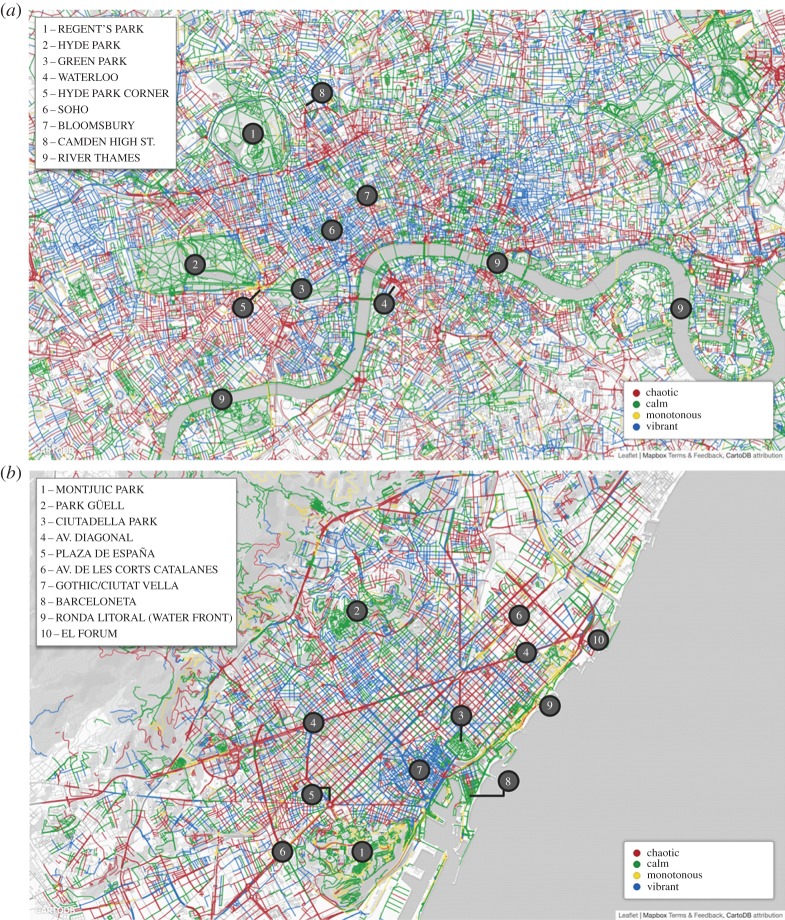
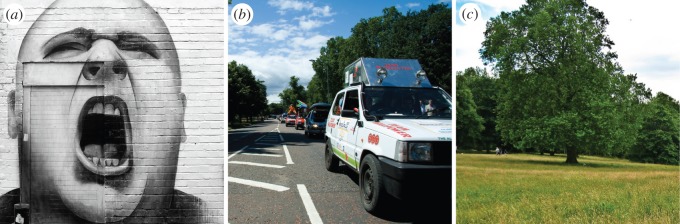
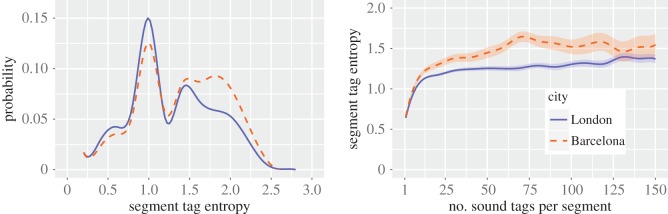
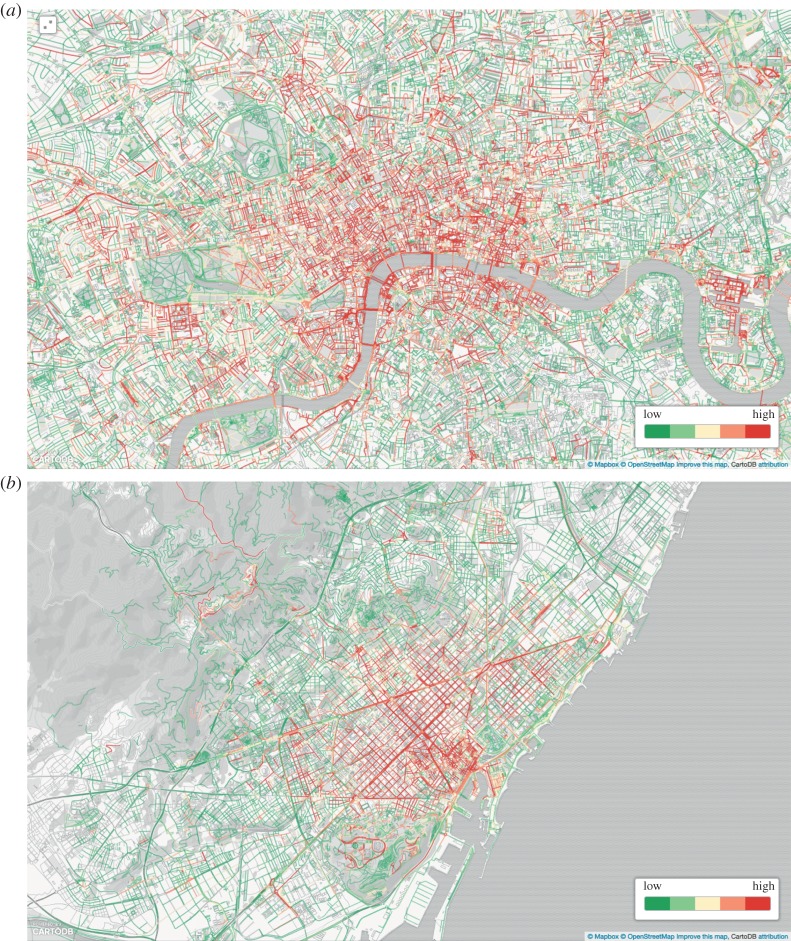
Urban sound has a huge influence over how we perceive places. Yet, city planning is concerned mainly with noise, simply because annoying sounds come to the attention of city officials in the form of complaints, whereas general urban sounds do not come to the attention as they cannot be easily captured at city scale. To capture both unpleasant and pleasant sounds, we applied a new methodology that relies on tagging information of georeferenced pictures to the cities of London and Barcelona. To begin with, we compiled the first urban sound dictionary and compared it with the one produced by collating insights from the literature: ours was experimentally more valid (if correlated with official noise pollution levels) and offered a wider geographical coverage. From picture tags, we then studied the relationship between soundscapes and emotions. We learned that streets with music sounds were associated with strong emotions of joy or sadness, whereas those with human sounds were associated with joy or surprise. Finally, we studied the relationship between soundscapes and people's perceptions and, in so doing, we were able to map which areas are chaotic, monotonous, calm and exciting. Those insights promise to inform the creation of restorative experiences in our increasingly urbanized world.

Keywords: mapping; soundscape; urban informatics.


Figures

Figure 1.
Figure 1.
Coverage of the three urban sound dictionaries. Number of tags, photos, street segments that had at least one smell word from each vocabulary in Barcelona and London. Each bar is a smell vocabulary. Schafer was extracted from Schafer's book The soundscape, whereas the other two were online repositories. The best coverage was offered by Freesound.
Figure 2.
Figure 2.
Number of street segments (y-axis) containing a given number of picture tags that match Freesound terms (x-axis) in London and Barcelona. Many streets had a few tags, and only a few streets have a massive number of them. London has 141 K segments with at least one tag (and 15 tags in each segment, on average), Barcelona 20 K (25 tags per segment on average).
Figure 3.
Figure 3.
Urban sound taxonomy. Top-level categories are in the inner circle; second-level categories are in the outer ring and examples of words are in the outermost ring. For space limitation, in the wheel, only the first categories (those in the inner circle) are complete, whereas subcategories and words represent just a sample.
Figure 4.
Figure 4.
Fraction tagc/tag of picture tags that matched sound category c over all the tags in the city.
Figure 5.
Figure 5.
Pairwise rank correlations between the fraction of sound tags in category c1 (soundj,c1) and the faction in category c2 (soundj,c2) across all segments j in London.
Figure 6.
Figure 6.
Urban sound maps of London (a) and Barcelona (b). Each street segment is marked with the sound category c that has the highest z-score for that segment (zsoundj,c). In London, natural sounds are found in Regent's Park (1), Hyde Park (2), Green Park (3) and all around the River Thames (9). By contrast, transport sounds are around Waterloo station (4) and on the perimeter of Hyde Park (5). Human sounds are found in Soho (6) and Bloomsbury (7), and music is associated with the small clubs on Camden High Street (8). In Barcelona, natural sounds are found in Montjuic Park (1), Park Guell (2) and Ciutadella Park (3), and on the beaches of Barceloneta (8) and Ronda Litoral (9). By contrast, annoying and chaotic sounds are found on the main road of Avinguda Diagonal (4), on Plaza de Espana (5) and on Avinguda De Les Corts Catalanes (6). Human sounds are found in the historical centre called Gothic/Ciutat Vella (7), and music in the open-air arena of El Forum (10). Only segments with at least five sound tags were considered.
Figure 7.
Figure 7.
Average z-scores of the presence of six sound categories for segments of each street type (z¯soundc,typet). Positive values are in green, and negative ones are in red. The first clock-like representation refers to primary roads and shows that transport sounds have z-score of 0.3 (they are present more than average), whereas nature sounds have z-score of −0.3 (they are present less than average). The number of segments per type ranges between 1 and 25 K, with the only exception of the ‘construction’ type that has only 83 segments. Confidence intervals around the average values range between 10−2 and 10−3.
Figure 8.
Figure 8.
Spearman correlation between the fraction of tags at segment j that matched category c (soundj,c) and j's noise levels (expressed as equivalent-weighted level values in dB) as the number of tags per street segment (x-axis) increases. All correlations are statistically significant at the level of p<0.01.
Figure 9.
Figure 9.
Correlation between zsoundj,c and zemotionj,e. Each clock-like representation refers to a sound category. The different emotions unfold around the clock, and the emotions that are associated with the sound category are marked in green (positive correlations) or in red (negative emotions). All correlations are statistically significant at the level of p<0.01.
Figure 10.
Figure 10.
Frequency distributions of the survey's scores for sound presence (from 1 to 10) across categories: individuals, crowds, nature, traffic and other. Sounds of individuals are scored in the full 1-to-10 range, whereas sounds of crowds are typically scored with a value of 1 or 2 as they might have been absent most of the time.
Figure 11.
Figure 11.
Frequency distributions of the survey's perception scores (from 1 to 10) for each perception category. Most of the perceptions are scored in the full 1-to-10 range.
Figure 12.
Figure 12.
Pairwise rank cross-correlations between the survey's sound scores soundk,c (a) and its perception scores perceptionk,e (b).
Figure 13.
Figure 13.
Two principal components describing how study participants perceived urban sound. The combination of the first component ‘uneventful versus eventful’ with the second component ‘annoying versus pleasant’ results in four main ways of perceiving urban sounds: vibrant, calm, monotonous and chaotic [51].
Figure 14.
Figure 14.
Relationship between sounds and perceptions in the soundwalk survey data. (a) Correlations between the survey's sound scores soundk,c and its perception scores perceptionk,e. Sounds of crowds, for example, are perceived to be pleasant and vibrant but not annoying. (b) Probability p(f|c) that perception f was reported at a location with sound category c.
Figure 15.
Figure 15.
Perceptual maps of London (a) and Barcelona (b). At each segment, the perception f with the highest probability was reported (i.e. with the highest pj(f)). In London, calm sounds were found in Regent's Park (1), Hyde Park (2), Green Park (3) and all around the River Thames (9). By contrast, chaotic sounds were around Waterloo station (4) and Hyde Park Corner (5). Vibrant sounds were found in Soho (6), Bloomsbury (7) and Camden High Street (8). In Barcelona, calm sounds were found in Montjuic Park (1), Park Guell (2) and Ciutadella Park (3), and on the beach of Barceloneta (8). By contrast, on the beach in front of Ronda Litoral (9), we found monotonous sounds. Chaotic sounds were found on the main road of Avinguda Diagonal (4), on Plaza de Espana (5) and on Avinguda De Les Corts Catalanes (6). Vibrant sounds were found in the historical centre called Gothic/Ciutat Vella (7), and some in the open-air arena of El Forum (10), which was also characterized by chaotic sounds.
Figure 16.
Figure 16.
Examples of ambiguously tagged pictures. (a) Street art in Brick Lane tagged with the term ‘screaming’, and the same location Carriage Drive with Hyde Park tagged with opposing terms related to (b) traffic sounds and (c) nature sounds.
Figure 17.
Figure 17.
Diversity (entropy) of sound tags. Frequency distribution (a), and how the diversity varies with the number of tags per street segment (b). Segments with zero diversity (28% in Barcelona, 35% in London) were excluded.
Figure 18.
Figure 18.
Maps of the diversity of sound tags for each street segment in London (a) and Barcelona (b). Only segments with five or more tags are displayed.

References

    1. Halonen J. et al. 2015. Road traffic noise is associated with increased cardiovascular morbidity and mortality and all-cause mortality in London. Eur. Heart J. 36, 2653–2661. (doi:10.1093/eurheartj/ehv216) - DOI - PMC - PubMed
    1. Stansfeld SA. et al. 2005. Aircraft and road traffic noise and children's cognition and health: a cross-national study. Lancet 365, 1942–1949. (doi:10.1016/S0140-6736(05)66660-3) - DOI - PubMed
    1. Van Kempen E, Babisch W. 2012. The quantitative relationship between road traffic noise and hypertension: a meta-analysis. J. Hypertens. 30, 1075–1086. (doi:10.1097/HJH.0b013e328352ac54) - DOI - PubMed
    1. Hoffmann B. et al. 2006. Residence close to high traffic and prevalence of coronary heart disease. Eur. Heart J. 27, 2696–2702. (doi:10.1093/eurheartj/ehl278) - DOI - PubMed
    1. Selander J, Nilsson ME, Bluhm G, Rosenlund M, Lindqvist M, Nise G, Pershagena G. 2009. Long-term exposure to road traffic noise and myocardial infarction. Epidemiology 20, 272–279. (doi:10.1097/EDE.0b013e31819463bd) - DOI - PubMed