

Quantitative comparisons on hand motor functional areas determined by resting state and task BOLD fMRI and anatomical MRI for pre-surgical planning of patients with brain tumors
- PMID: 27069871
- PMCID: PMC4810013
- DOI: 10.1016/j.nicl.2016.03.003
Quantitative comparisons on hand motor functional areas determined by resting state and task BOLD fMRI and anatomical MRI for pre-surgical planning of patients with brain tumors
Abstract
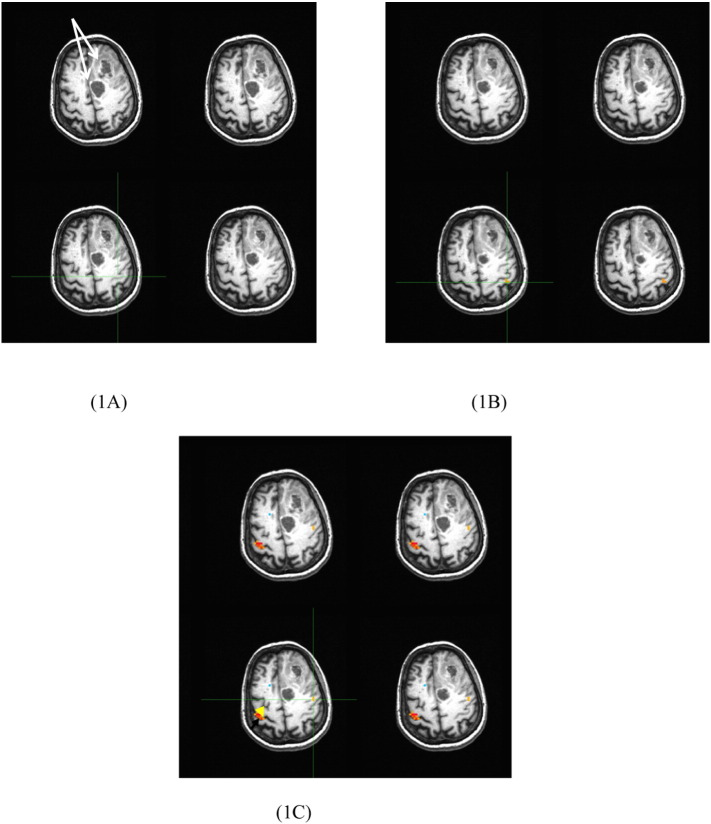
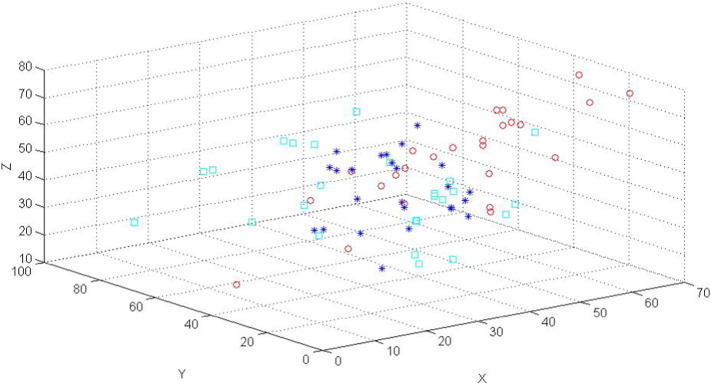
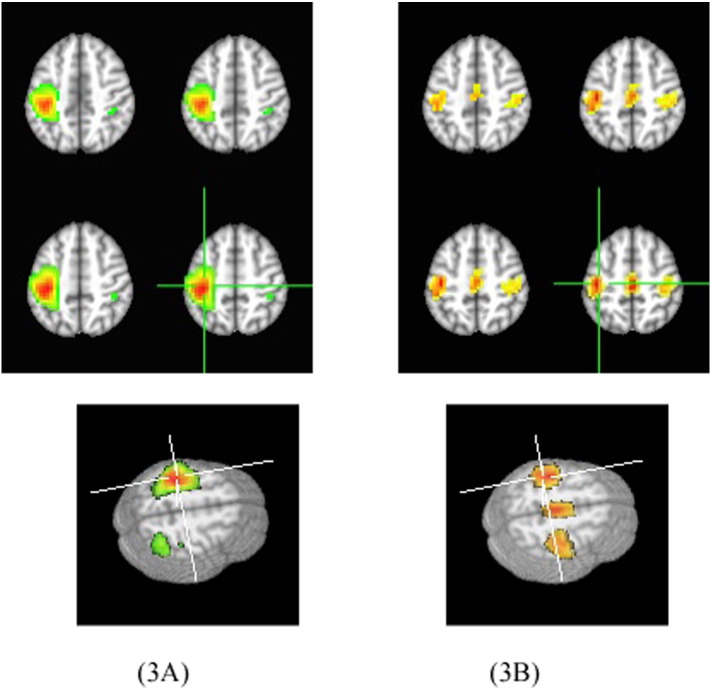
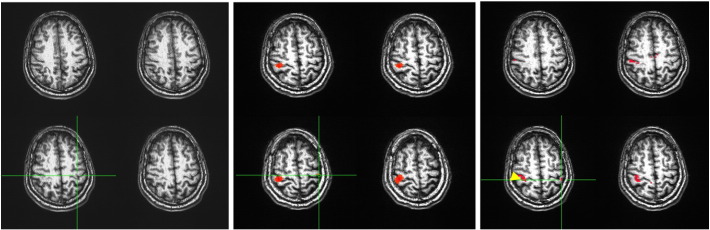
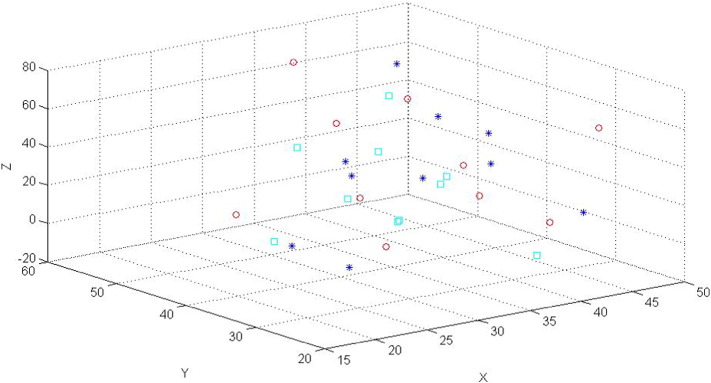
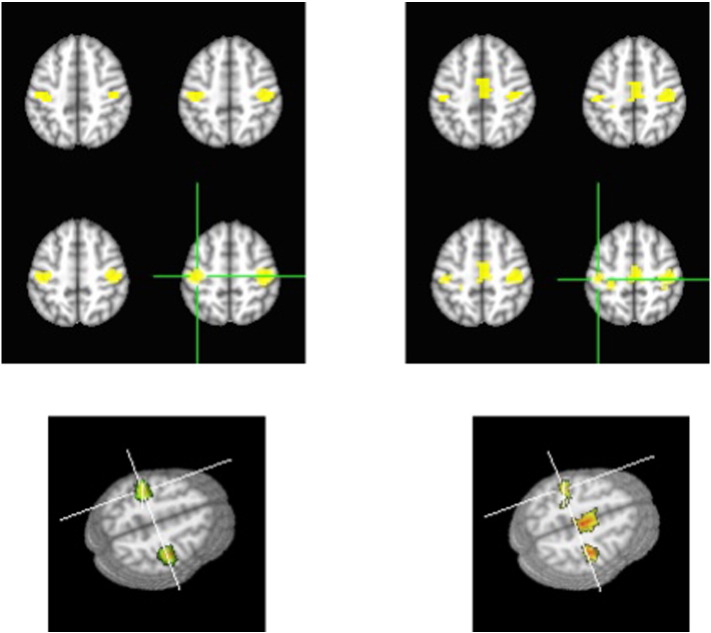
For pre-surgical planning we present quantitative comparison of the location of the hand motor functional area determined by right hand finger tapping BOLD fMRI, resting state BOLD fMRI, and anatomically using high resolution T1 weighted images. Data were obtained on 10 healthy subjects and 25 patients with left sided brain tumors. Our results show that there are important differences in the locations (i.e., > 20 mm) of the determined hand motor voxels by these three MR imaging methods. This can have significant effect on the pre-surgical planning of these patients depending on the modality used. In 13 of the 25 cases (i.e., 52%) the distances between the task-determined and the rs-fMRI determined hand areas were more than 20 mm; in 13 of 25 cases (i.e., 52%) the distances between the task-determined and anatomically determined hand areas were > 20 mm; and in 16 of 25 cases (i.e., 64%) the distances between the rs-fMRI determined and anatomically determined hand areas were more than 20 mm. In just three cases, the distances determined by all three modalities were within 20 mm of each other. The differences in the location or fingerprint of the hand motor areas, as determined by these three MR methods result from the different underlying mechanisms of these three modalities and possibly the effects of tumors on these modalities.
Keywords: Anatomical T1wighted images; Brain tumor; Localizing hand motor area; Task- and resting state-functional MR images.
Figures
Similar articles
-
Preoperative Mapping of the Supplementary Motor Area in Patients with Brain Tumor Using Resting-State fMRI with Seed-Based Analysis.AJNR Am J Neuroradiol. 2018 Aug;39(8):1493-1498. doi: 10.3174/ajnr.A5709. Epub 2018 Jul 12. AJNR Am J Neuroradiol. 2018. PMID: 30002054 Free PMC article.
-
Functional MRI vs. navigated TMS to optimize M1 seed volume delineation for DTI tractography. A prospective study in patients with brain tumours adjacent to the corticospinal tract.Neuroimage Clin. 2016 Nov 23;13:297-309. doi: 10.1016/j.nicl.2016.11.022. eCollection 2017. Neuroimage Clin. 2016. PMID: 28050345 Free PMC article.
-
Functional Magnetic Resonance Imaging Activation Optimization in the Setting of Brain Tumor-Induced Neurovascular Uncoupling Using Resting-State Blood Oxygen Level-Dependent Amplitude of Low Frequency Fluctuations.Brain Connect. 2019 Apr;9(3):241-250. doi: 10.1089/brain.2017.0562. Epub 2019 Feb 28. Brain Connect. 2019. PMID: 30547681 Free PMC article.
-
[Integrating functional magnetic resonance imaging in neuronavigation surgery of brain tumors involving motor cortex].Zhonghua Yi Xue Za Zhi. 2004 Apr 17;84(8):632-6. Zhonghua Yi Xue Za Zhi. 2004. PMID: 15130301 Clinical Trial. Chinese.
-
Task-based and Resting State Functional MRI in Children.Magn Reson Imaging Clin N Am. 2021 Nov;29(4):527-541. doi: 10.1016/j.mric.2021.06.005. Magn Reson Imaging Clin N Am. 2021. PMID: 34717843 Review.
Cited by
-
Pre-surgical Brain Mapping: To Rest or Not to Rest?Front Neurol. 2018 Jul 3;9:520. doi: 10.3389/fneur.2018.00520. eCollection 2018. Front Neurol. 2018. PMID: 30018589 Free PMC article. No abstract available.
-
The utilisation of fMRI for pre-operative mapping in the paediatric population with central nervous system tumours: a systematic review.Neuroradiology. 2025 Mar;67(3):643-656. doi: 10.1007/s00234-024-03489-7. Epub 2024 Oct 21. Neuroradiology. 2025. PMID: 39432073
-
Presurgical Localization of the Primary Sensorimotor Cortex in Gliomas : When is Resting State FMRI Beneficial and Sufficient?Clin Neuroradiol. 2021 Mar;31(1):245-256. doi: 10.1007/s00062-020-00879-1. Epub 2020 Apr 9. Clin Neuroradiol. 2021. PMID: 32274518 Free PMC article.
-
Preoperative Mapping of the Supplementary Motor Area in Patients with Brain Tumor Using Resting-State fMRI with Seed-Based Analysis.AJNR Am J Neuroradiol. 2018 Aug;39(8):1493-1498. doi: 10.3174/ajnr.A5709. Epub 2018 Jul 12. AJNR Am J Neuroradiol. 2018. PMID: 30002054 Free PMC article.
-
Interaction of Developmental Venous Anomalies with Resting-State Functional MRI Measures.AJNR Am J Neuroradiol. 2018 Dec;39(12):2326-2331. doi: 10.3174/ajnr.A5847. Epub 2018 Nov 1. AJNR Am J Neuroradiol. 2018. PMID: 30385467 Free PMC article.
References
-
- Biswal B.B., Yetkin F.Z., Haughton V.M. Functional connectivity in the motor cortex of resting human brain using echo-planar MRI. Magn. Reson. Med. 1995;34:537–541. - PubMed
-
- Bizzi A., Blasi V., Falini A. Presurgical functional MR imaging of language and motor functions: validation with intraoperative electrode mapping. Radiology. 2008;248:579–589. - PubMed
-
- Buxton R.B., Uludag K., Dubowitz D.J. Modeling the hemodynamic response to brain activation. NeuroImage. 2004;23:S220–S233. - PubMed
Publication types
MeSH terms
Grants and funding
LinkOut - more resources
Full Text Sources
Other Literature Sources
Medical
