. 2016 Jul;22(7):1221-8.
doi: 10.3201/eid2207.160116. Epub 2016 Jul 15.

High Incidence of Chikungunya Virus and Frequency of Viremic Blood Donations during Epidemic, Puerto Rico, USA, 2014

High Incidence of Chikungunya Virus and Frequency of Viremic Blood Donations during Epidemic, Puerto Rico, USA, 2014

Graham Simmons et al. Emerg Infect Dis. 2016 Jul.

Abstract

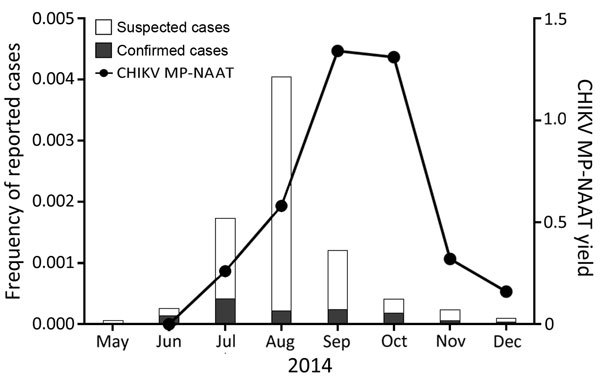
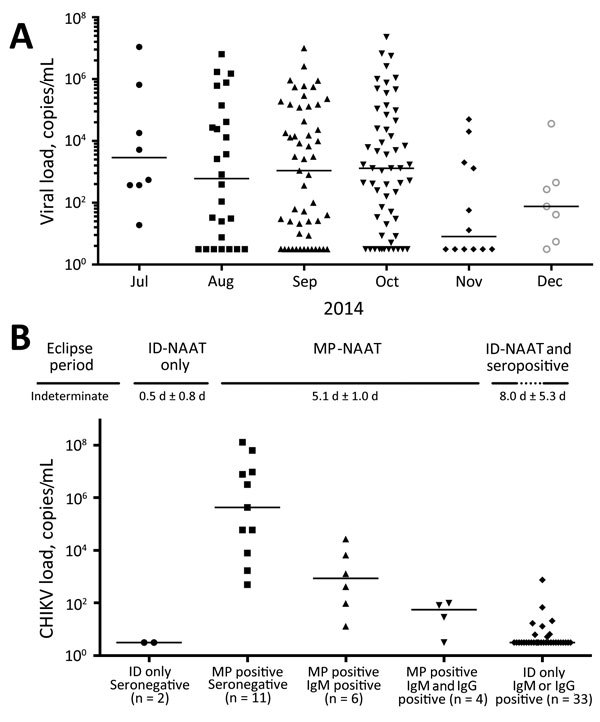
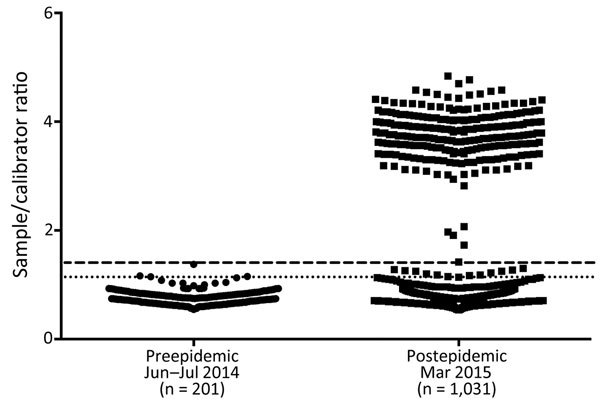
Chikungunya virus (CHIKV) caused large epidemics throughout the Caribbean in 2014. We conducted nucleic acid amplification testing (NAAT) for CHIKV RNA (n = 29,695) and serologic testing for IgG against CHIKV (n = 1,232) in archived blood donor samples collected during and after an epidemic in Puerto Rico in 2014. NAAT yields peaked in October with 2.1% of donations positive for CHIKV RNA. A total of 14% of NAAT-reactive donations posed a high risk for virus transmission by transfusion because of high virus RNA copy numbers (10 (4) -10 (9) RNA copies/mL) and a lack of specific IgM and IgG responses. Testing of minipools of 16 donations would not have detected 62.5% of RNA-positive donations detectable by individual donor testing, including individual donations without IgM and IgG. Serosurveys before and after the epidemic demonstrated that nearly 25% of blood donors in Puerto Rico acquired CHIKV infections and seroconverted during the epidemic.

Keywords: Puerto Rico; blood donors; chikungunya virus; epidemic; minipools; nucleic acid amplification test; seroprevalence; viremia; viruses.


Figures

Figure 1
Figure 1
Estimated percentage of blood donations positive for chikungunya virus (CHIKV) RNA during a chikungunya epidemic, Puerto Rico, USA, 2014. CHIKV RNA-positive minipools of 16 donors were used to estimate the percentage of positive donations for the last 7 months of 2014. Estimates were made by using an algorithm for calculating infection rates from pooled data. Data from the Puerto Rico Department of Health for reported (suspected) and confirmed chikungunya case reports was used to transform data into estimated frequency of reported cases in a population in Puerto Rico of ≈3,548,400. MP-NAAT, minipool nucleic acid amplification testing.
Figure 2
Figure 2
Viral loads for chikungunya virus (CHIKV) in blood donations during a chikungunya epidemic, Puerto Rico, USA, 2014. A) Positive minipool (MP) viral loads. Estimated viral loads (RNA copies/mL) were calculated for each reactive MP identified by using target capture transcription-mediated amplification (TC-TMA) during the epidemic. June 2014 (n = 106) is not plotted because of a lack of positive samples. Positive samples with unquantifiable viral loads are plotted as being at the limit of quantification (3.16 copies/mL) and were included in calculation of medians (horizontal bars). B) Individual donor (ID) viral loads for CHIKV. Estimated viral loads were calculated for each positive specimen identified by using TC-TMA during the 3 peak months of the epidemic. Positive samples with unquantifiable viral loads are plotted as being at the limit of quantification (3.16 copies/mL) and were included in calculation of medians (horizontal bars). Samples are arranged in order of projected time postinfection on the basis of predicted time course of acute infection (shown as estimated mean ±SD time intervals in days). ID only, samples positive by nucleic acid amplification testing (NAAT) but not positive for a 1:16 dilution mimicking minipooling. MP positive, samples positive by ID-NAAT and at a 1:16 dilution. Dynamics of acute infection with CHIKV (26) from the eclipse period (negative for virus RNA and IgM and IgG against CHIKV) to the end of infection (positive or negative for virus RNA and positive for IgM and IgG against CHIKV) is based on similar staging of dynamics of acute infection for other arboviruses (27) and approximate detection periods as described in the text.
Figure 3
Figure 3
Serosurvey for chikungunya virus IgG in blood donations during a chikungunya epidemic, Puerto Rico, USA, 2014. Preepidemic samples collected in June and July 2014 were tested by using an IgG ELISA. A stringent cutoff value of mean + 5 SD (dashed line) was calculated from preepidemic samples. A less stringent cutoff value of mean + 3 SD (dotted line) was also calculated. These cutoff values were then applied to postepidemic samples collected in March 2015.

References

    1. Charrel RN, de Lamballerie X, Raoult D. Chikungunya outbreaks: the globalization of vectorborne diseases. N Engl J Med. 2007;356:769–71. 10.1056/NEJMp078013 - DOI - PubMed
    1. Pialoux G, Gauzere BA, Jaureguiberry S, Strobel M. Chikungunya, an epidemic arbovirosis. Lancet Infect Dis. 2007;7:319–27. 10.1016/S1473-3099(07)70107-X - DOI - PubMed
    1. Powers AM, Logue CH. Changing patterns of chikungunya virus: re-emergence of a zoonotic arbovirus. J Gen Virol. 2007;88:2363–77. 10.1099/vir.0.82858-0 - DOI - PubMed
    1. Rampal SM, Meena H. Neurological complications in chikungunya fever. J Assoc Physicians India. 2007;55:765–9 . - PubMed
    1. Cassadou S, Boucau S, Petit-Sinturel M, Huc P, Leparc-Goffart I, Ledrans M. Emergence of chikungunya fever on the French side of Saint Martin Island, October to December 2013. Euro Surveill. 2014;19:20752. 10.2807/1560-7917.ES2014.19.13.20752 - DOI - PubMed

LinkOut - more resources