. 2016 May;8(5):899-916.
doi: 10.18632/aging.100942.

Resveratrol supplementation confers neuroprotection in cortical brain tissue of nonhuman primates fed a high-fat/sucrose diet

Affiliations

Resveratrol supplementation confers neuroprotection in cortical brain tissue of nonhuman primates fed a high-fat/sucrose diet

Michel Bernier et al. Aging (Albany NY). 2016 May.

Abstract

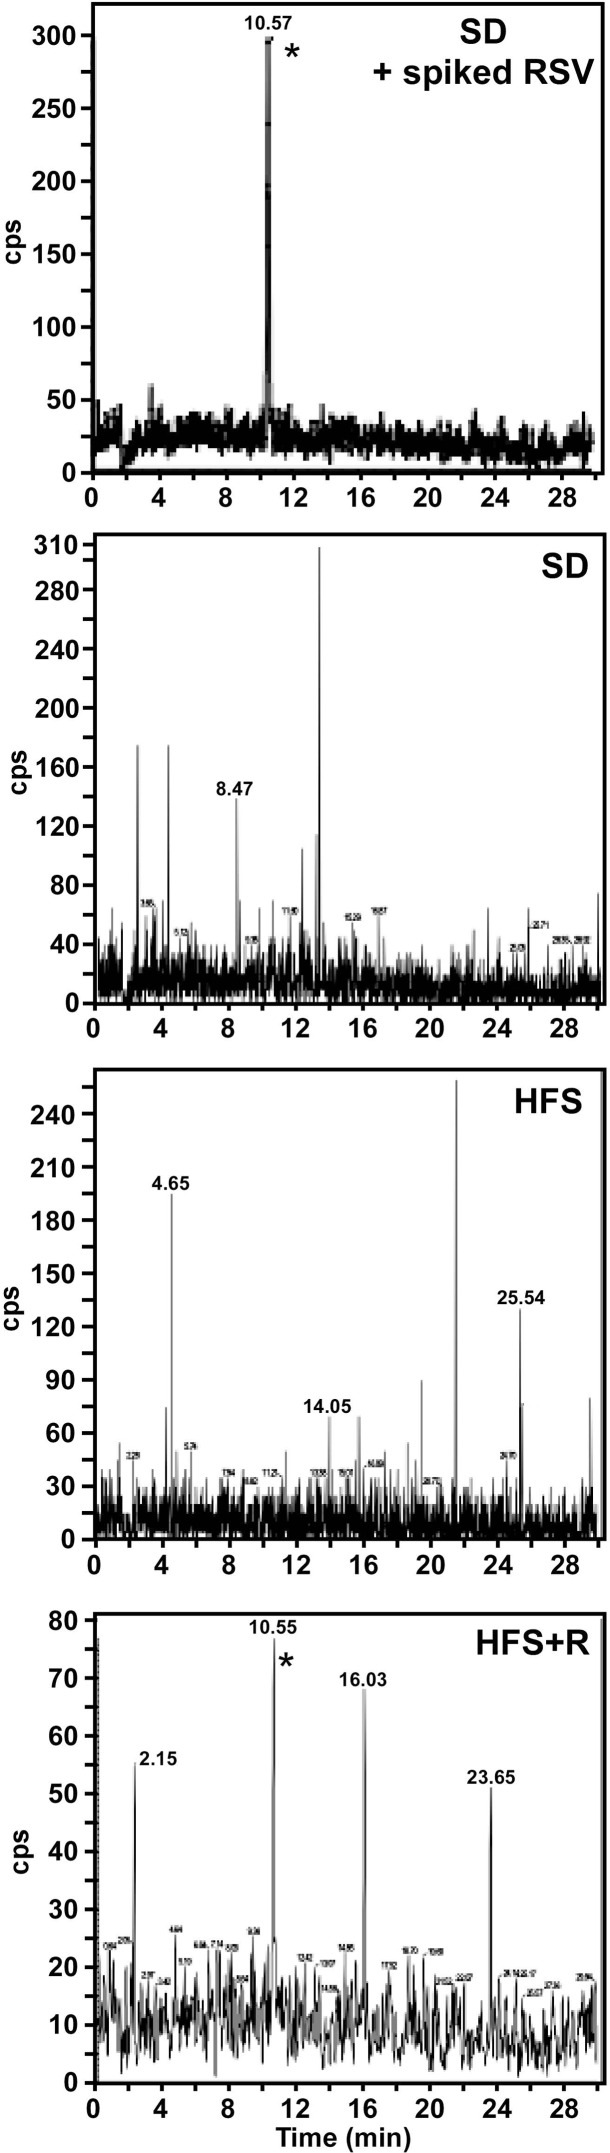
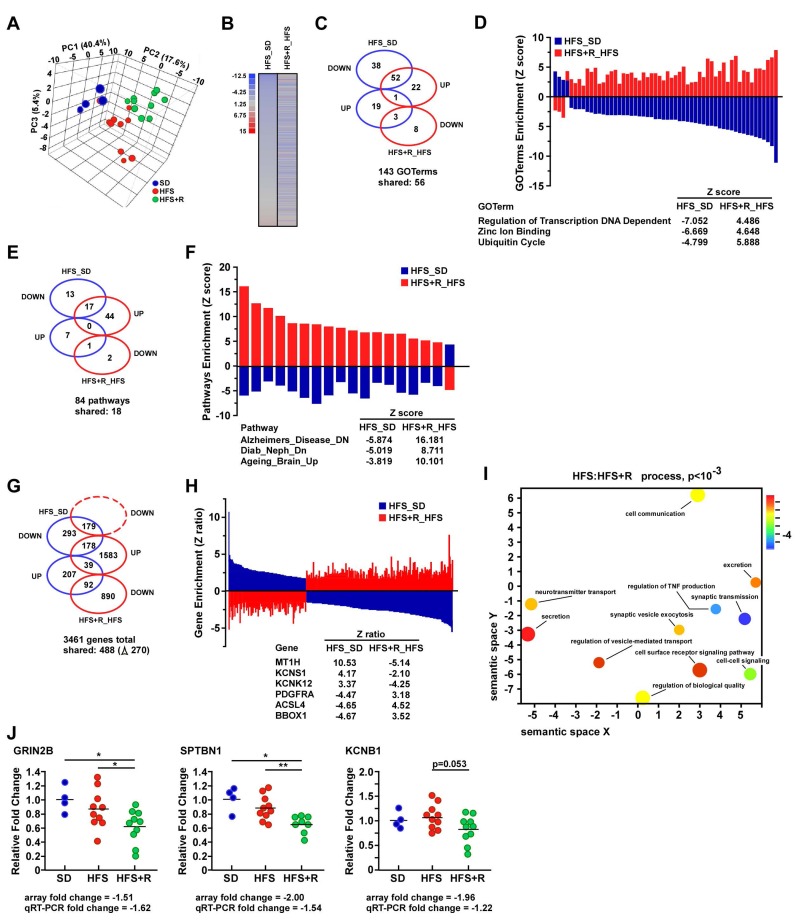
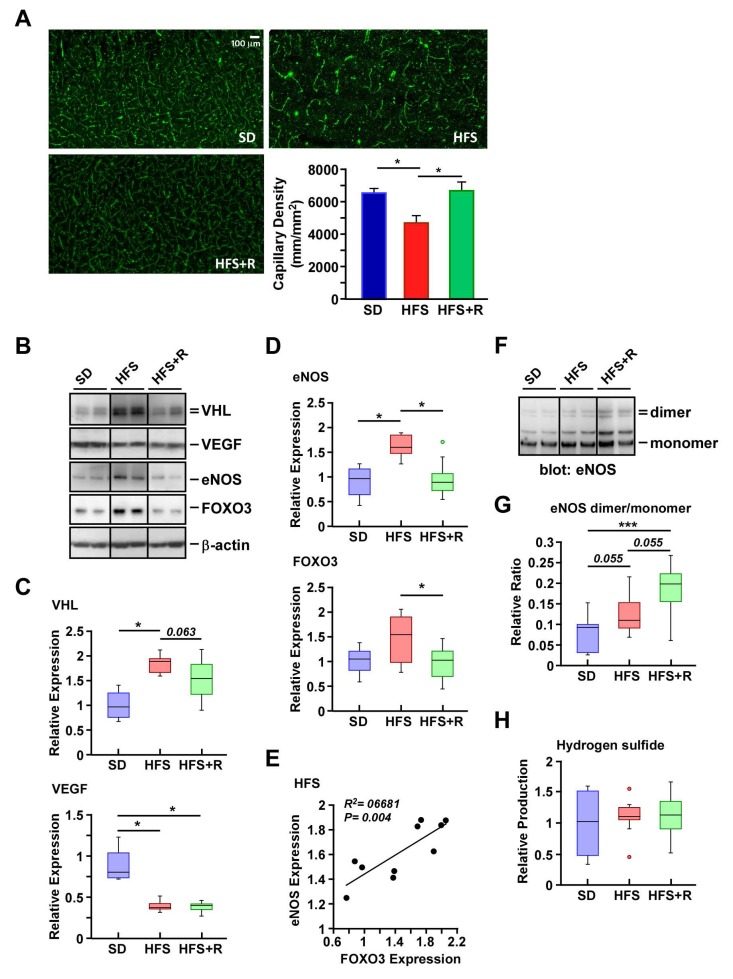
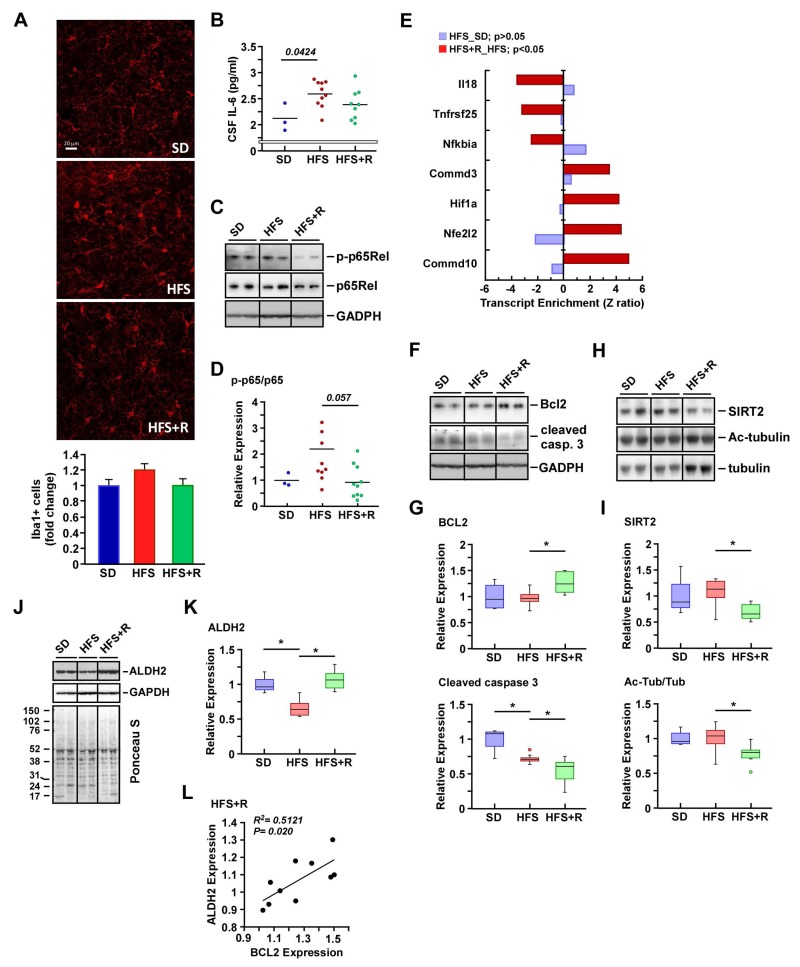
Previous studies have shown positive effects of long-term resveratrol (RSV) supplementation in preventing pancreatic beta cell dysfunction, arterial stiffening and metabolic decline induced by high-fat/high-sugar (HFS) diet in nonhuman primates. Here, the analysis was extended to examine whether RSV may reduce dietary stress toxicity in the cerebral cortex of the same cohort of treated animals. Middle-aged male rhesus monkeys were fed for 2 years with HFS alone or combined with RSV, after which whole-genome microarray analysis of cerebral cortex tissue was carried out along with ELISA, immunofluorescence, and biochemical analyses to examine markers of vascular health and inflammation in the cerebral cortices. A number of genes and pathways that were differentially modulated in these dietary interventions indicated an exacerbation of neuroinflammation (e.g., oxidative stress markers, apoptosis, NF-κB activation) in HFS-fed animals and protection by RSV treatment. The decreased expression of mitochondrial aldehyde dehydrogenase 2, dysregulation in endothelial nitric oxide synthase, and reduced capillary density induced by HFS stress were rescued by RSV supplementation. Our results suggest that long-term RSV treatment confers neuroprotection against cerebral vascular dysfunction during nutrient stress.

Keywords: Rhesus monkeys; brain vasculature; cDNA microarray; endothelial nitric oxide synthase; inflammation.


Conflict of interest statement

Conflict of interest statement

The authors declare that they have no competing financial interest.

Figures

Figure 1
Figure 1. Accumulation of RSV in monkey CSF
At the time of sacrifice, CSF from SD, HFS and HFS+R animals was collected and the amount of unconjugated RSV measured by MS/MS analysis. Upper panel, a CSF sample from SD control was spiked with 2.5 ng/ml RSV. The detection of RSV is indicated by *.
Figure 2
Figure 2. Resveratrol supplementation elicits differential gene expression profiles in the frontal cerebral cortex of HFS-fed rhesus monkeys
(A) Visualization of the principal component analysis (PCA) performed on gene expression data sets from the brain of rhesus monkeys maintained on standard diet (SD), high-fat, high-sugar diet (HFS) and HFS supplemented with resveratrol for 2 years (HFS+R). (B) Heat maps representing gene expression profile comparing genes significantly up (red) and downregulated (blue) in HFS vs. SD-fed controls and HFS+R vs. HFS. (C) Venn diagram illustrating the number of significantly up and down regulated GO terms observed in neocortex from HFS vs. SD (blue symbols) and HFS+R vs. HFS-fed monkeys (red symbols). (D) Enrichment of the 56 shared GO terms visualized using a two-dimensional graphical representation of HFS vs. SD (blue bars) and HFS+R vs. HFS (red bars). A list of three shared GOTerms differentially expressed between the two pairwise comparisons is provided. (E) Venn diagram illustrating the number of significantly up and down regulated pathways between the two pairwise comparisons. (F) Enrichment of the 18 shared pathways visualized using a two-dimensional graphical representation of HFS vs. SD (blue bars) and HFS+R vs. HFS (red bars). A list of three shared pathways differentially expressed between the two pairwise comparisons is provided. (G) Venn diagram illustrating the number of significantly up and down regulated genes between the two pairwise comparisons. (H) Enrichment of the 270 shared genes visualized using a two-dimensional graphical representation of HFS vs. SD (blue bars) and HFS+R vs. HFS (red bars). A list of six shared genes differentially expressed between the two pairwise comparisons is provided. (I) 5170 genes from the filtered brain dataset (HFS:HFS+R comparison) were ranked according to their differential expression and given as input to GOrilla. The resulting enriched GO terms were visualized using a two-dimensional graphical representation with color coding reflecting their degree of enrichment/depletion (blue being the strongest). Additional comparisons (HFS vs. SD) on the same filtered dataset highlight the enrichment of relevant GO terms, such as “Synapse part”, “Axon part”, “Oxidation-reduction process” and “Response to axon injury”. (J) mRNA expression analysis in brain cortex by quantitative RT-PCR. Relative expression values were normalized to those of SD-fed control monkeys and represented as scatter plots. Although the fold changes in GRIN2B, SPTBN1 and KCNB1 expression were small [less than a 2-fold change], these were in good agreement with the quantitative RT-PCR data. SD (n=4); HFS (n=10); HFS+R (n=10). *, **, p <0.05 and 0.01, respectively.
Figure 3
Figure 3. Resveratrol treatment improves capillary density in the cerebral cortex of HFS-fed rhesus monkeys
(A) Representative images of cerebral cortical brain capillary staining, and their respective quantification. (B) Solubilized cerebral cortex extracts from SD-, HFS- and HFS+R-fed animals were resolved by SDS-PAGE under reducing conditions, electrotransferred onto nitrocellulose membranes and subjected to immunoblotting using the indicated primary antibodies. Representative signals associated with bands of interest are shown, including that of b-actin, which was used as loading control. All 24 brain samples were ran on a single gel (Fig. S1). Nitrocellulose membrane staining was also carried out with Ponceau S dye for protein detection. (C) Signals associated with VEGF and VHL proteins were normalized and represented as box plots. (D) Signals associated with eNOS and FOXO3 proteins were normalized and represented as box plots. (E) Scatterplot exploring the significant association between eNOS and FOXO3 protein expression with HFS feeding. (F) SDS-PAGE was performed at 4°C to enable the separation of eNOS dimers and monomers. Immunoblot analysis was performed using anti-eNOS antibody. (G) Ratios of dimeric and monomeric eNOS species were calculated and represented as box plots. (H) Measurement of H2S levels in monkey brain homogenates. SD (n=4); HFS (n=10); HFS+R (n=10). *, p < 0.05.
Figure 4
Figure 4. Effects of resveratrol on neuroinflammation in the cerebral cortex of HFS-fed rhesus monkeys
(A) Representative images of Iba1-positive cells in cerebral cortical brain sections (original magnification: 40x), and their respective quantification. (B) IL-6 levels in CSF. (C-K) Solubilized cerebral cortex extracts from SD-, HFS- and HFS+R-fed animals were resolved by SDS-PAGE under reducing conditions, electrotransferred onto nitrocellulose membranes and subjected to immunoblotting. All 24 brain samples were ran on a single gel (Fig. S1). (C) Representative signals associated with phosphorylated and total forms of p65Rel and that of GAPDH, which was used as loading control. (D) The ratios of phosphorylated/total p65Rel proteins are represented as scatter plots. (E) Enrichment of a select group of transcripts implicated in NF-κB signaling both in HFS vs. SD and HFS+R vs. HFS pairwise comparisons. (F) Representative signals associated with BCL2 and cleaved caspase 3, and that of GAPDH, which was used as loading control. (G) Signals associated with BCL2 and cleaved caspase 3 proteins were normalized and represented as box plots. (H) Representative immunoblot analysis for SIRT2, acetylated tubulin, and total tubulin levels. (I) Signals associated with bands of interest were normalized to Ponceau S staining and represented as box plots. (J) Representative signals associated with ALDH2 and GAPDH, the latter being used as loading control. Membrane staining was also carried out with Ponceau S dye for protein detection. The migration of molecular-mass markers (values in kilodaltons) is shown on the left of the stained membrane. (K) Signal associated with ALDH2 was normalized to GAPDH and represented as box plots. (L) Scatterplot exploring the significant association between ALDH2 and BCL2 protein expression with HFS+R feeding. SD (n=4); HFS (n=10); HFS+R (n=10). *, p < 0.05.

References

    1. Cawley J, Meyerhoefer C. The medical care costs of obesity: An instrumental variables approach. Journal of Health Economics. 2012;31:219–230. - PubMed
    1. Whitmer R, Gunderson E, Quesenberry C, Zhou J, Yaffe K. Body Mass Index in Midlife and Risk of Alzheimer Disease and Vascular Dementia. Current Alzheimer Research. 2007;4:103–109. - PubMed
    1. de la Monte SM. Brain Insulin Resistance and Deficiency as Therapeutic Targets in Alzheimers Disease. Current Alzheimer Research. 2012;9:35–66. - PMC - PubMed
    1. Jeon BT, Jeong EA, Shin HJ, Lee Y, Lee DH, Kim HJ, Kang SS, Cho GJ, Choi WS, Roh GS. Resveratrol Attenuates Obesity-Associated Peripheral and Central Inflammation and Improves Memory Deficit in Mice Fed a High-Fat Diet. Diabetes. 2012;61:1444–1454. - PMC - PubMed
    1. Novelle MG, Wahl D, Diéguez C, Bernier M, de Cabo R. Resveratrol supplementation: Where are we now and where should we go? Ageing Research Reviews. 2015;21:1–15. - PMC - PubMed