. 2016 Apr 12;12(4):e1005538.
doi: 10.1371/journal.ppat.1005538. eCollection 2016 Apr.

Mosquito Passage Dramatically Changes var Gene Expression in Controlled Human Plasmodium falciparum Infections

Affiliations

Mosquito Passage Dramatically Changes var Gene Expression in Controlled Human Plasmodium falciparum Infections

Anna Bachmann et al. PLoS Pathog. .

Abstract

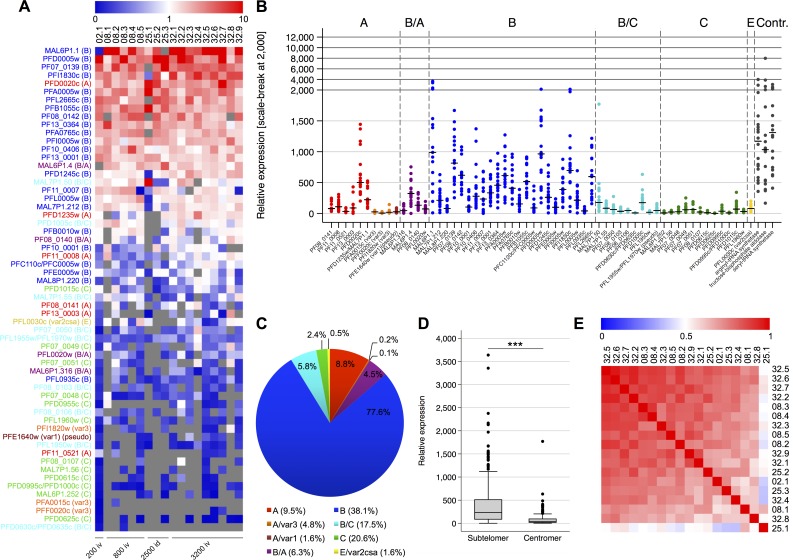
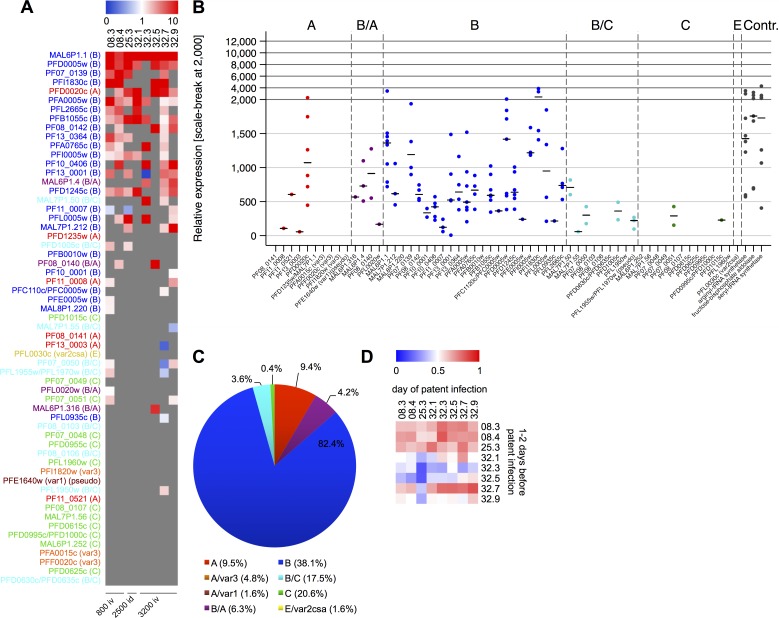
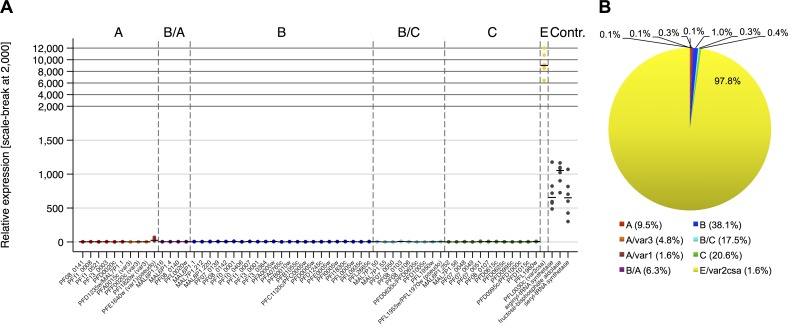
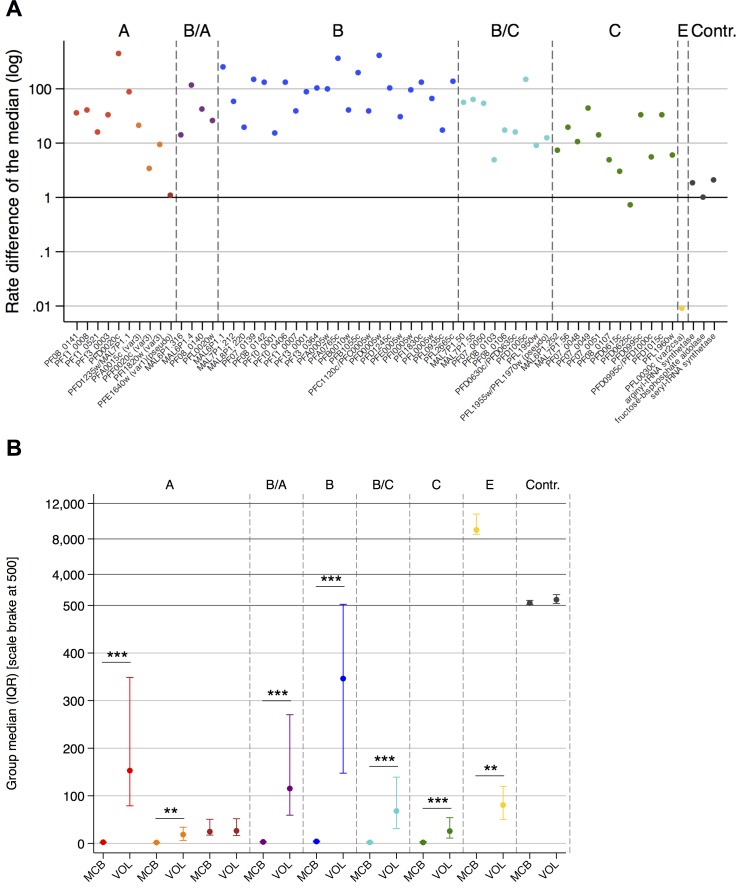
Virulence of the most deadly malaria parasite Plasmodium falciparum is linked to the variant surface antigen PfEMP1, which is encoded by about 60 var genes per parasite genome. Although the expression of particular variants has been associated with different clinical outcomes, little is known about var gene expression at the onset of infection. By analyzing controlled human malaria infections via quantitative real-time PCR, we show that parasite populations from 18 volunteers expressed virtually identical transcript patterns that were dominated by the subtelomeric var gene group B and, to a lesser extent, group A. Furthermore, major changes in composition and frequency of var gene transcripts were detected between the parental parasite culture that was used to infect mosquitoes and Plasmodia recovered from infected volunteers, suggesting that P. falciparum resets its var gene expression during mosquito passage and starts with the broad expression of a specific subset of var genes when entering the human blood phase.


Conflict of interest statement

TL (Senior Director), BKLS (Executive Vice President Process Development and Manufacturing) and SLH (Chief Executive and Scientific Officer) are employees of Sanaria Inc. This affiliation does not alter our adherence to all PLOS policies on sharing data and materials. All other authors declare that no competing interests exists.

Figures

Fig 1
Fig 1. Var transcription profiles of parasites recovered from infected volunteers at the day of first microscopically detectable parasitemia.
(A) Heat map showing the individual var gene expression for all volunteer samples taken when parasites were present in the thick blood smear ranked by mean expression. To correct for individual differences in the overall var expression levels, the expression for each var gene was normalized against the total var expression in each sample. The color scale indicates the relative expression levels with red representing values above the median, blue representing values below the median, and white representing median. Grey means not detected. The number of sporozoites (200, 800, 2500 and 3200) and mode of injection (iv = intravenous, id = intradermal) used for each volunteer are indicated below. (B) The distribution of the relative gene expression per var gene and control genes is shown in a dot plot for all volunteer samples at the day of patent infection defined as parasites present in the thick blood smear (n = 18). Each point represents a var gene expression value relative to the normalizing gene sbp1 observed per volunteer sample and the median expression per var gene is marked. Housekeeping genes used as controls, var gene names and groups are indicated. (C) Proportion of var gene expression by group across all volunteers at the day of patent infection. For comparison, genomic proportion of each var gene group is indicated after the color code. (D) Comparison of the expression levels between subtelomeric and centromeric var gene variants. The box plot shows the distribution of transcript levels for each individual var gene relative to sbp1 according to the chromosomal localization of the genes for all 18 volunteer samples at the day of patent infection. Gene expression varied significantly between both gene sets (Wilcoxon rank-sum test, p<0.0001) with median expression of 232 (IQR: 87–510) for telomeric var genes and 40 (IQR: 18–94) for centromeric var genes. (E) The heat map of pairwise Spearman’s rank correlation coefficients (R) between expression profiles illustrates the positive correlation between all 18 volunteer samples at the day of patent infection. Volunteer samples were ranked by the sum of their correlation coefficients. The color scale indicates the correlation coefficient in the range from 0 to 1. With exception of isolate 25.1 versus the isolates 02.1 (p = 0.0015), 25.3 (p = 0.0029) and 32.4 (p = 0.0030) all expressions correlated at a significance level below 0.001.
Fig 2
Fig 2. Var transcription profiles of parasites from infected volunteers 1–2 days before parasites were microscopically detectable.
(A) Heat map showing the individual var gene expression profiles for samples obtained from volunteers one or two days before parasites were present in the thick blood smear. To correct for individual differences in the overall var expression levels, the expression for each var gene was normalized against the total var expression in each sample. Expression is ranked by mean expression obtained from “day of patent infection” samples (see Fig 1A). The color scale indicates the relative expression levels with red representing values above the median, blue representing values below the median, and white representing median. Grey means not detected. (B) Relative gene expression is shown in a dot plot for the volunteer samples one time point before thick blood smear positivity (n = 8). Gene IDs of var genes and controls are indicated on the x-axis, var gene groups are indicated above the graph. (C) The distribution of var transcripts according to var group affiliation in the volunteer samples 1–2 days before parasites were detected in the thick blood smear is displayed by summarization of the total var gene expression and calculation of the proportion for each var group. The genomic proportion of each var gene group is indicated after the color code. (D) The pairwise Spearman’s rank correlation heat map demonstrates a positive correlation between the expression profiles on the day of first microscopically detectable parasitemia and 1–2 days before in the same volunteer and between volunteer samples.
Fig 3
Fig 3. Var transcription profiles of parental parasite lines used for volunteer infection.
(A) The gene expression of each var gene and control genes relative to sbp1 expression is shown in dot plots for the pre-mosquito Master Cell Bank (MCB) parasite line. Each point represents values observed per test generation for the MCB samples taken from two independently thawed parasite stocks after 6, 8 and 21 parasite generations, respectively (n = 6). The median expression per var gene is shown, housekeeping genes used as controls, var gene names and groups are indicated. (B) The MCB cell line exclusively expresses the group E var2csa gene as shown by the proportion of var transcripts according to var group affiliation. The genomic proportion of each var gene group is indicated after the color code.
Fig 4
Fig 4. Modification of var transcription by mosquito transmission.
(A) The rate difference of the median expression for each individual var variant and the housekeeping controls shows the overexpression of the entire var gene family in vivo with exception of the var2csa gene PFL0030c in comparison to the parental Master Cell Bank (MCB) parasite line. Each point reflects the median for the volunteer samples at the day of patent infection (n = 18) divided by the median observed for the parasite generations 6, 8 and 21 from two vials of the MCB cell line (n = 6). Housekeeping genes used as controls, var gene names and groups are indicated. (B) Differences in gene expression on group level between the pre-mosquito MCB parasite lines and parasites recovered from the infected volunteers (VOL) at the day of patent infection determined by thick blood smear are displayed as group median with interquartile range (IQR). Significant differences in distributions between MCB and VOL series were tested via a Wilcoxon rank-sum test using a Bonferroni corrected significance level. The graph contains a scale brake at the y-axis to account for the huge variability in the gene expressions. Group affiliations are indicated above the graph. Red (A), orange (A, subfamily var3), dark red (A, subfamily var1), purple (B/A), blue (B), turquoise (B/C), green (C) and yellow (E).

References

    1. World Health Organisation (2014) World Malaria Report 2014.
    1. Baruch DI, Pasloske BL, Singh HB, Bi X, Ma XC, et al. (1995) Cloning the P. falciparum gene encoding PfEMP1, a malarial variant antigen and adherence receptor on the surface of parasitized human erythrocytes. Cell 82: 77–87. - PubMed
    1. Su XZ, Heatwole VM, Wertheimer SP, Guinet F, Herrfeldt JA, et al. (1995) The large diverse gene family var encodes proteins involved in cytoadherence and antigenic variation of Plasmodium falciparum-infected erythrocytes. Cell 82: 89–100. - PubMed
    1. Rowe JA, Claessens A, Corrigan RA, Arman M (2009) Adhesion of Plasmodium falciparum-infected erythrocytes to human cells: molecular mechanisms and therapeutic implications. Expert Rev Mol Med 11: e16 10.1017/S1462399409001082 - DOI - PMC - PubMed
    1. Smith JD, Chitnis CE, Craig AG, Roberts DJ, Hudson-Taylor DE, et al. (1995) Switches in expression of Plasmodium falciparum var genes correlate with changes in antigenic and cytoadherent phenotypes of infected erythrocytes. Cell 82: 101–110. - PMC - PubMed

Publication types

LinkOut - more resources