

Placental Expression Patterns of Galectin-1, Galectin-2, Galectin-3 and Galectin-13 in Cases of Intrauterine Growth Restriction (IUGR)
- PMID: 27070577
- PMCID: PMC4848979
- DOI: 10.3390/ijms17040523
Placental Expression Patterns of Galectin-1, Galectin-2, Galectin-3 and Galectin-13 in Cases of Intrauterine Growth Restriction (IUGR)
Abstract
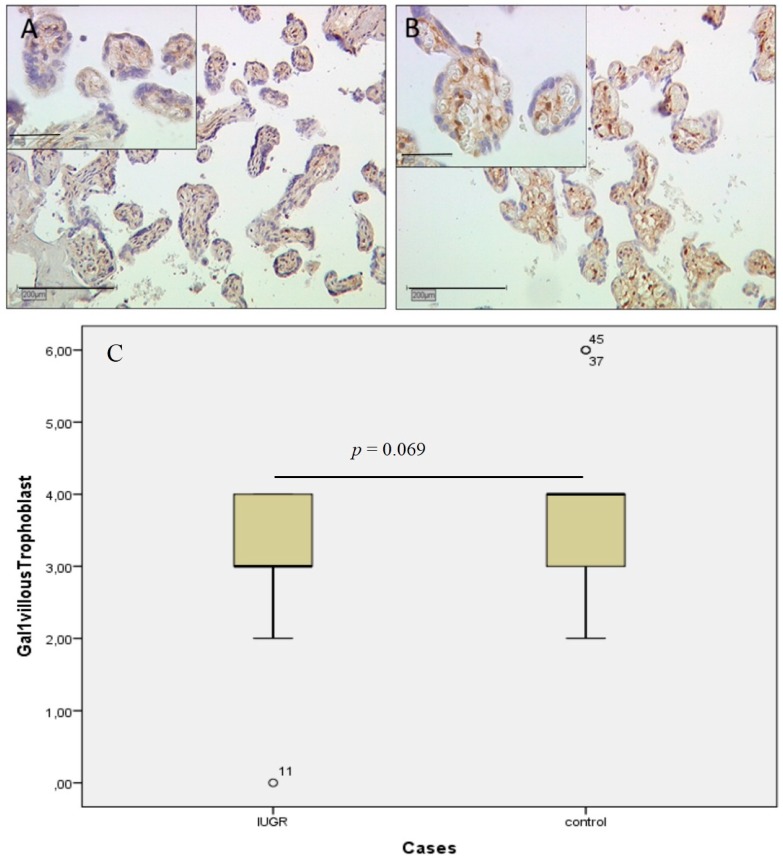
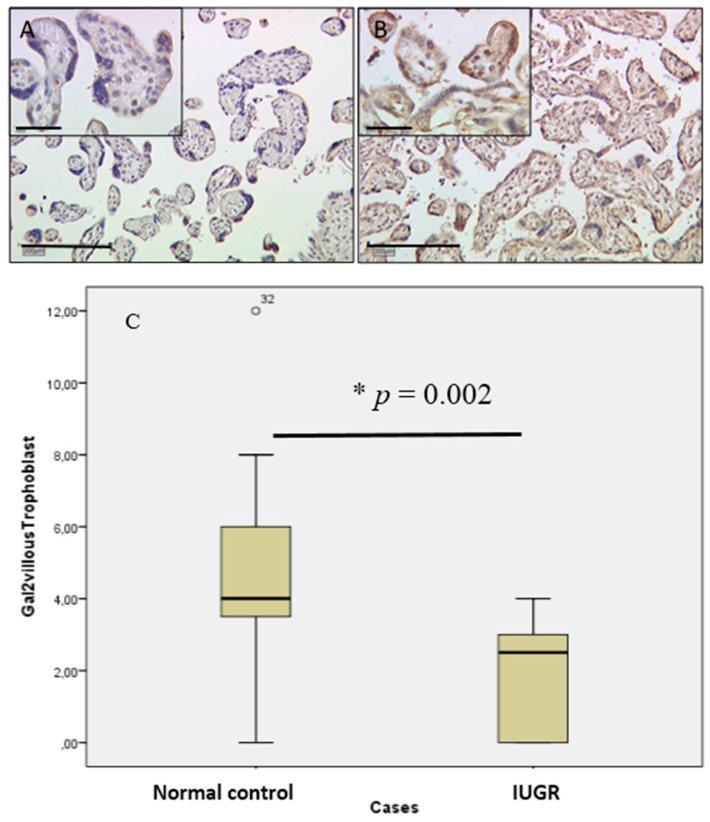
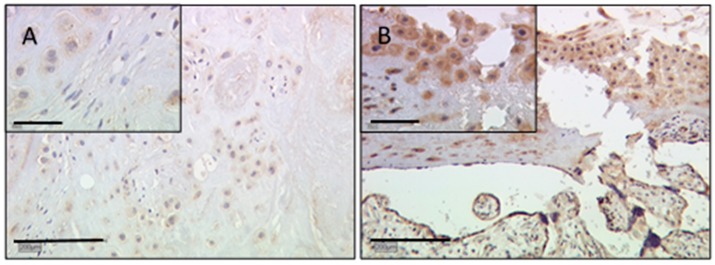
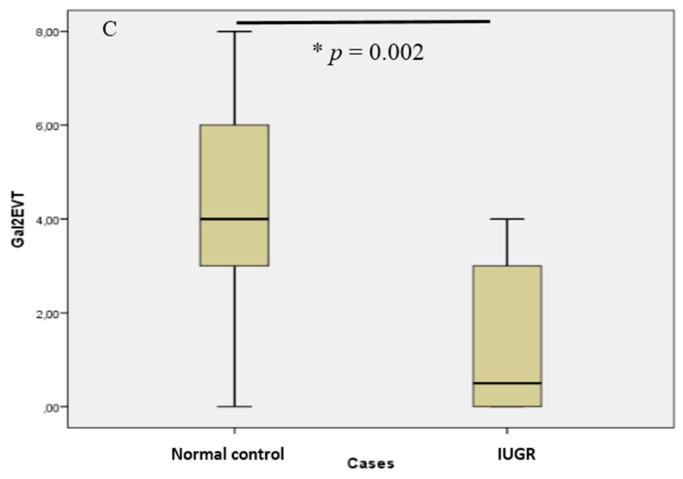
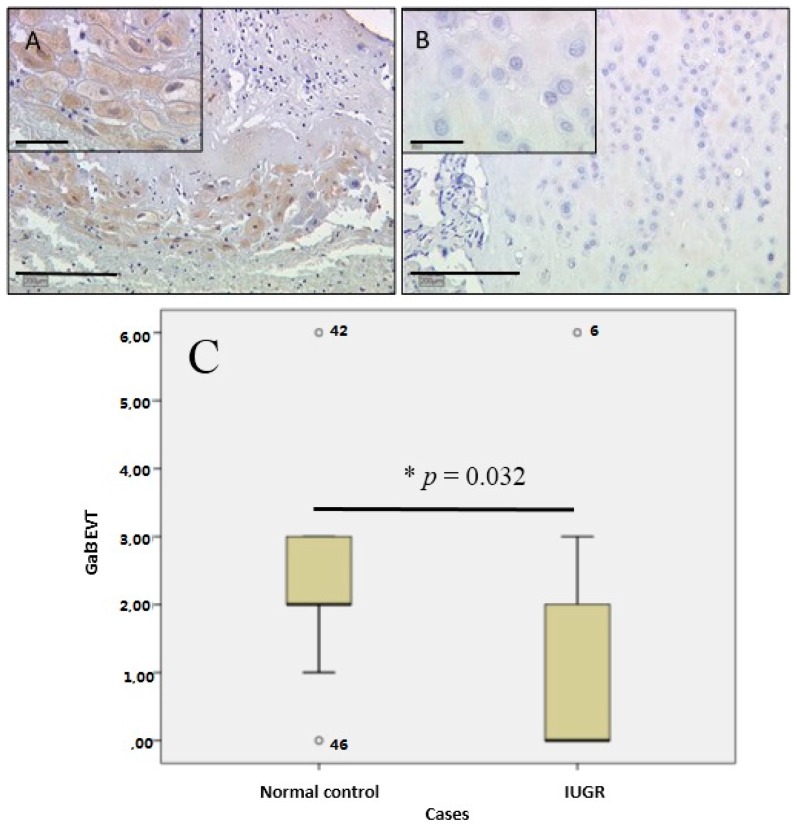
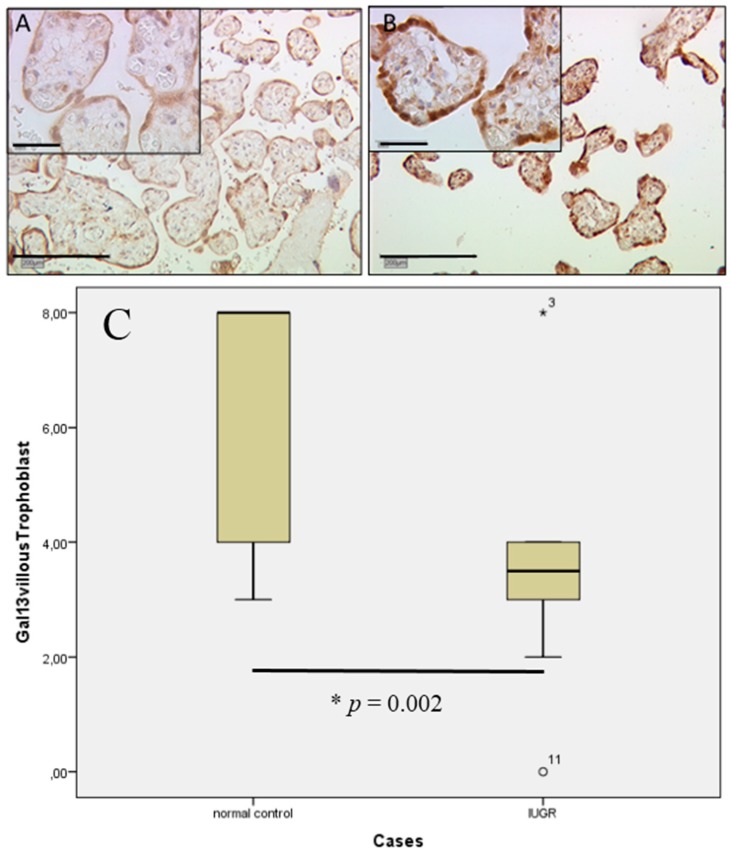
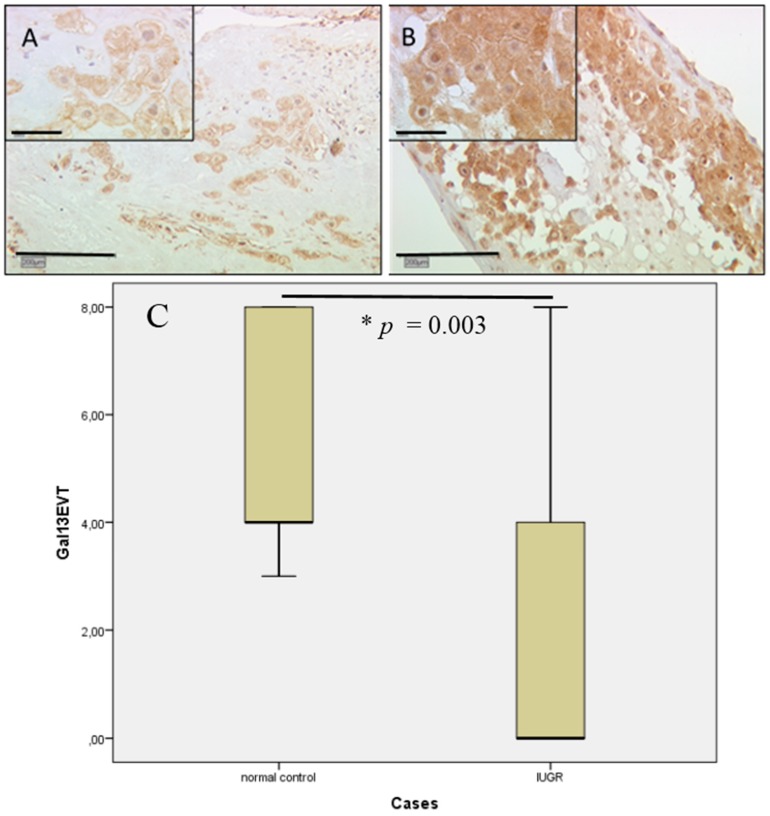
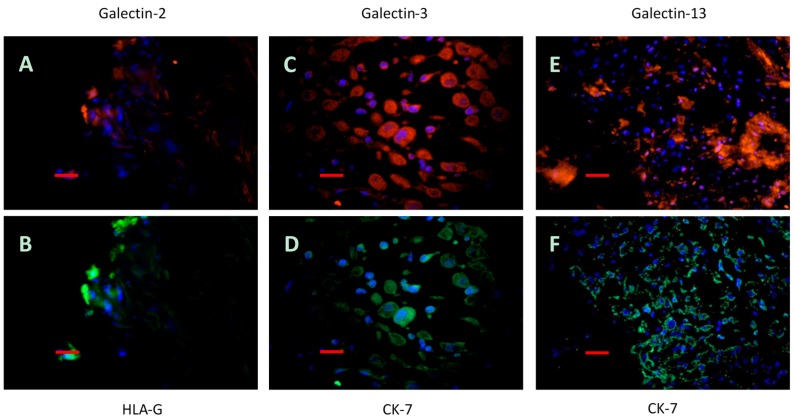
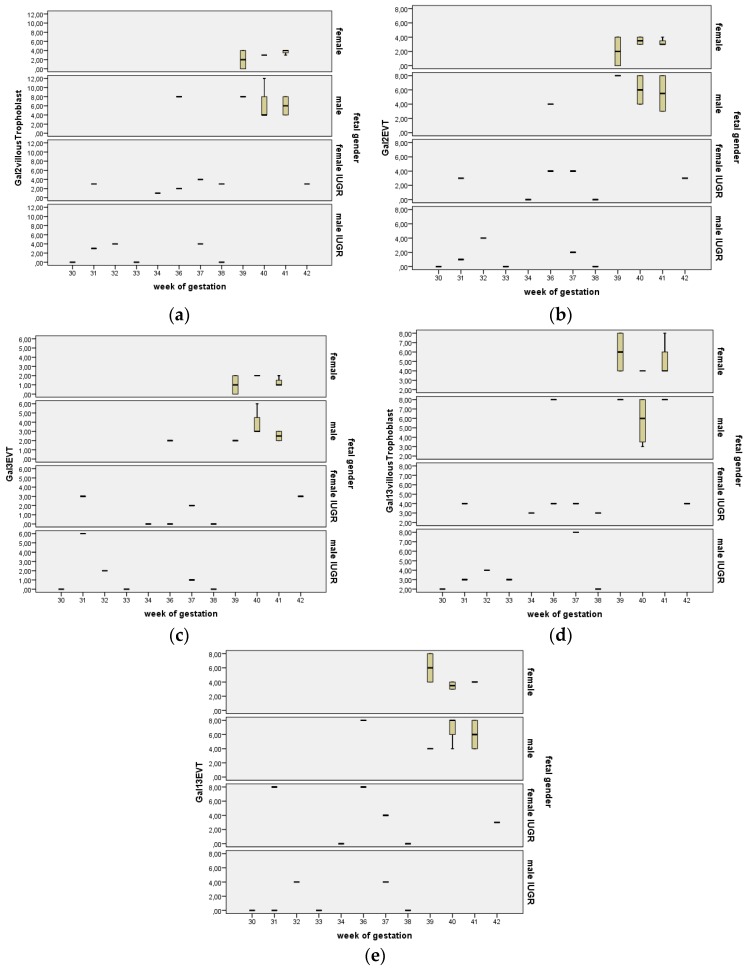
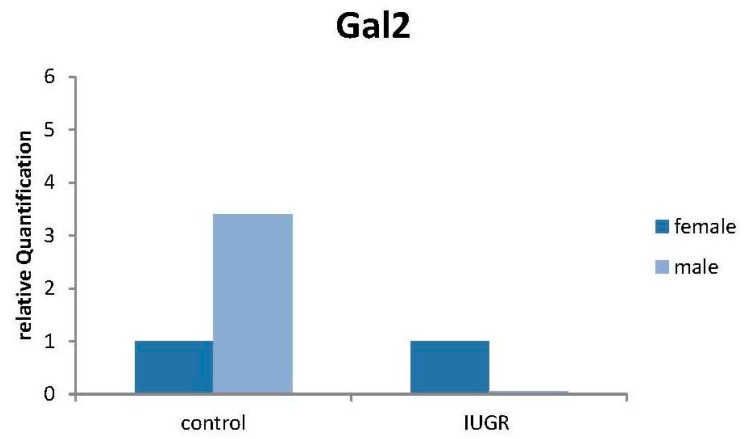
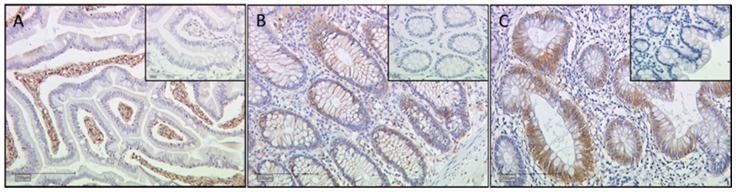
Galectins (gal) are members of the mammalian β-galactoside-binding proteins and recognize Galβ1-4GlcNAc and Galβ1-4GalNac (Thomsen-Friedenreich antigen (TF)) sequences of several cell surface oligosaccharides. In this study, gal-1, -2, -3 and -13 were investigated systematically in the trophoblast and decidua compartment of intrauterine growth restriction (IUGR) placentas and normal third trimester control placentas and stratified by fetal gender and gestational age. Within this study, 29 third trimester placentas after delivery were analyzed. Fetal gender was equally divided within both groups, and immunohistochemical staining was analyzed according to fetal gender and gestational age. Double immune-fluorescence with trophoblast-specific markers was used to identify galectin-expressing cells at the feto-maternal interface in the decidua. Gal-3 was significantly downregulated only in the extravillous trophoblast of IUGR placentas. In contrast, expressions of gal-2 and gal-13 were downregulated in both villous and extravillous trophoblast cells of IUGR placentas. In addition, gal-2 and gal-13 showed a highly correlated expression scheme in the placenta. There are significant gender-specific expression patterns for single prototype galectins with downregulation of gal-2 and gal-13 of male gender placentas in cases of IUGR. Gal-3 as the chimera type galectin shows only little gender-specific differences in expression, which disappear in IUGR cases.
Keywords: IUGR; decidua; galectins; placenta; trophoblast.
Figures
Similar articles
-
Expression of galectin-1, -3 (gal-1, gal-3) and the Thomsen-Friedenreich (TF) antigen in normal, IUGR, preeclamptic and HELLP placentas.Placenta. 2007 Nov-Dec;28(11-12):1165-73. doi: 10.1016/j.placenta.2007.06.006. Epub 2007 Jul 30. Placenta. 2007. PMID: 17664004
-
Fetal gender specific expression of tandem-repeat galectins in placental tissue from normally progressed human pregnancies and intrauterine growth restriction (IUGR).Placenta. 2015 Dec;36(12):1352-61. doi: 10.1016/j.placenta.2015.09.015. Epub 2015 Oct 3. Placenta. 2015. PMID: 26462906
-
Comparative analyses on expression of galectins1-4, 7-10 and 12 in first trimester placenta, decidua and isolated trophoblast cells in vitro.Histol Histopathol. 2016 Oct;31(10):1095-111. doi: 10.14670/HH-11-739. Epub 2016 Feb 22. Histol Histopathol. 2016. PMID: 26901464
-
Glycoprotein and carbohydrate binding protein expression in the placenta in early pregnancy loss.J Reprod Immunol. 2010 May;85(1):99-105. doi: 10.1016/j.jri.2009.10.012. Epub 2010 Mar 17. J Reprod Immunol. 2010. PMID: 20299109 Review.
-
Telomere homeostasis in IUGR placentas - A review.Placenta. 2016 Mar;39:21-3. doi: 10.1016/j.placenta.2015.11.006. Epub 2016 Jan 2. Placenta. 2016. PMID: 26992670 Review.
Cited by
-
The Emerging Role of Galectins and O-GlcNAc Homeostasis in Processes of Cellular Differentiation.Cells. 2020 Jul 28;9(8):1792. doi: 10.3390/cells9081792. Cells. 2020. PMID: 32731422 Free PMC article. Review.
-
Gal-2 Increases H3K4me3 and H3K9ac in Trophoblasts and Preeclampsia.Biomolecules. 2022 May 15;12(5):707. doi: 10.3390/biom12050707. Biomolecules. 2022. PMID: 35625634 Free PMC article.
-
Developmental programming in human umbilical cord vein endothelial cells following fetal growth restriction.Clin Epigenetics. 2020 Nov 30;12(1):185. doi: 10.1186/s13148-020-00980-9. Clin Epigenetics. 2020. PMID: 33256815 Free PMC article.
-
Galectin-1 expression in the serum and placenta of pregnant women with fetal growth restriction and its significance.BMC Pregnancy Childbirth. 2021 Jan 6;21(1):14. doi: 10.1186/s12884-020-03477-8. BMC Pregnancy Childbirth. 2021. PMID: 33407212 Free PMC article.
-
A closer look at Galectin-3: its association with gestational diabetes mellitus revealed by systematic review and meta-analysis.J Diabetes Metab Disord. 2024 Jul 6;23(2):1621-1633. doi: 10.1007/s40200-024-01461-z. eCollection 2024 Dec. J Diabetes Metab Disord. 2024. PMID: 39610475 Free PMC article. Review.
References
Publication types
MeSH terms
Substances
LinkOut - more resources
Full Text Sources
Other Literature Sources
Research Materials
Miscellaneous
