. 2016 Apr 8;17(4):529.
doi: 10.3390/ijms17040529.

Anti-Inflammatory and Cytoprotective Effects of TMC-256C1 from Marine-Derived Fungus Aspergillus sp. SF-6354 via up-Regulation of Heme Oxygenase-1 in Murine Hippocampal and Microglial Cell Lines

Affiliations

Anti-Inflammatory and Cytoprotective Effects of TMC-256C1 from Marine-Derived Fungus Aspergillus sp. SF-6354 via up-Regulation of Heme Oxygenase-1 in Murine Hippocampal and Microglial Cell Lines

Dong-Cheol Kim et al. Int J Mol Sci. .

Abstract

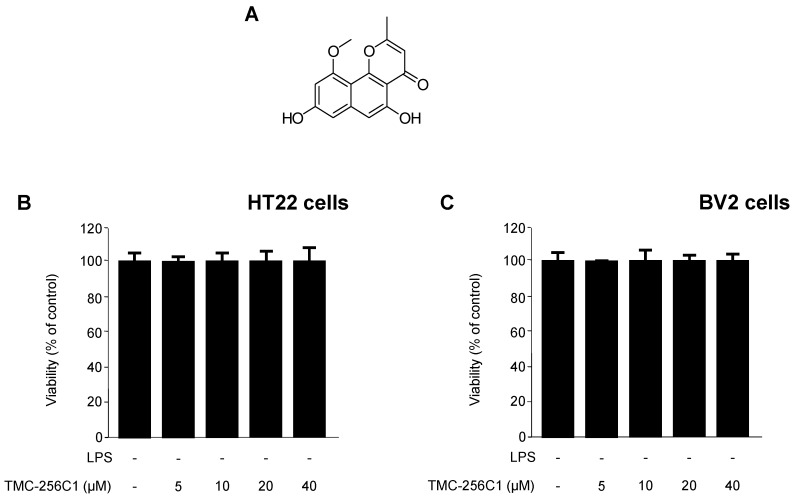
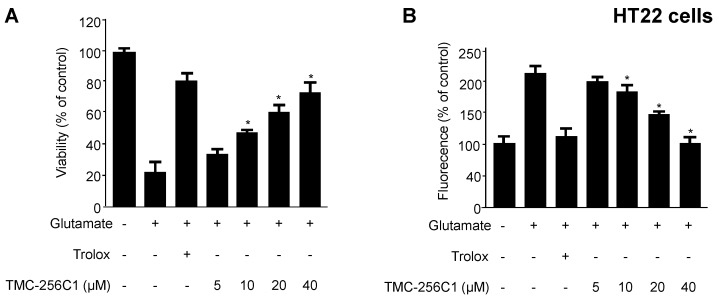
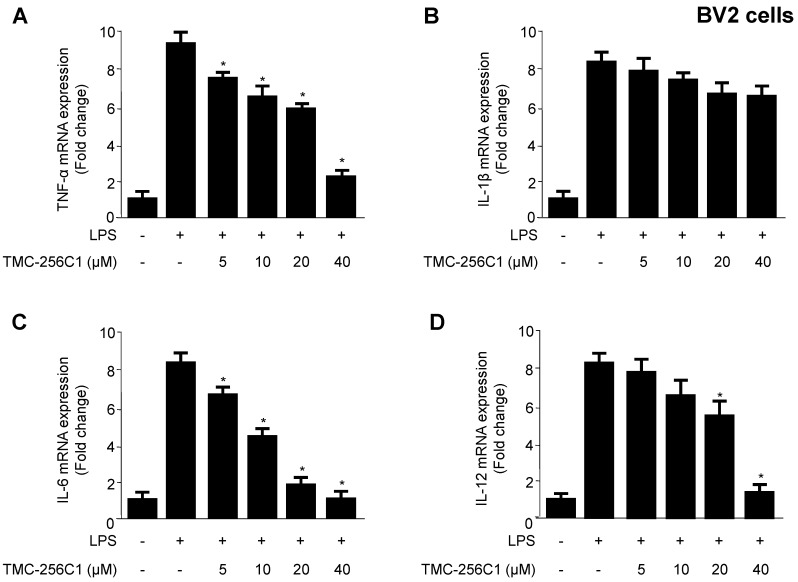
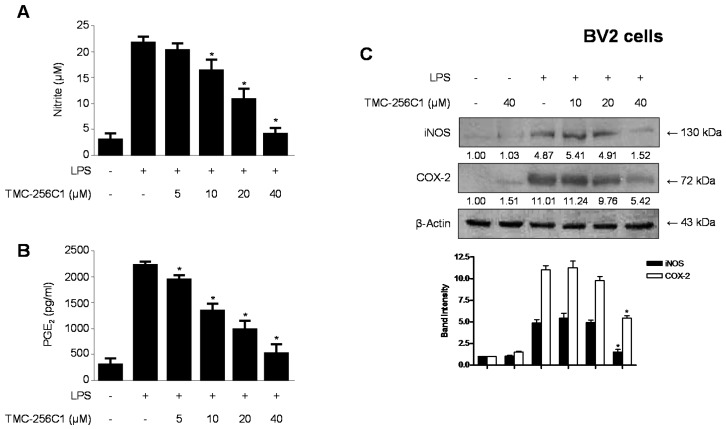
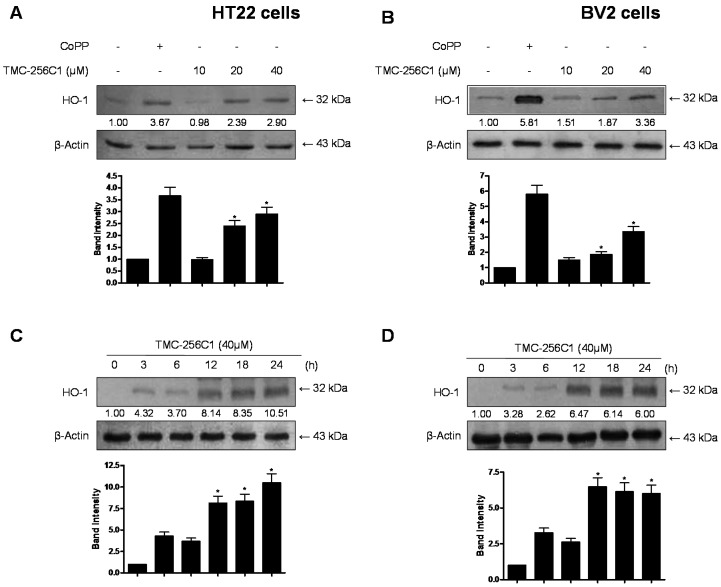
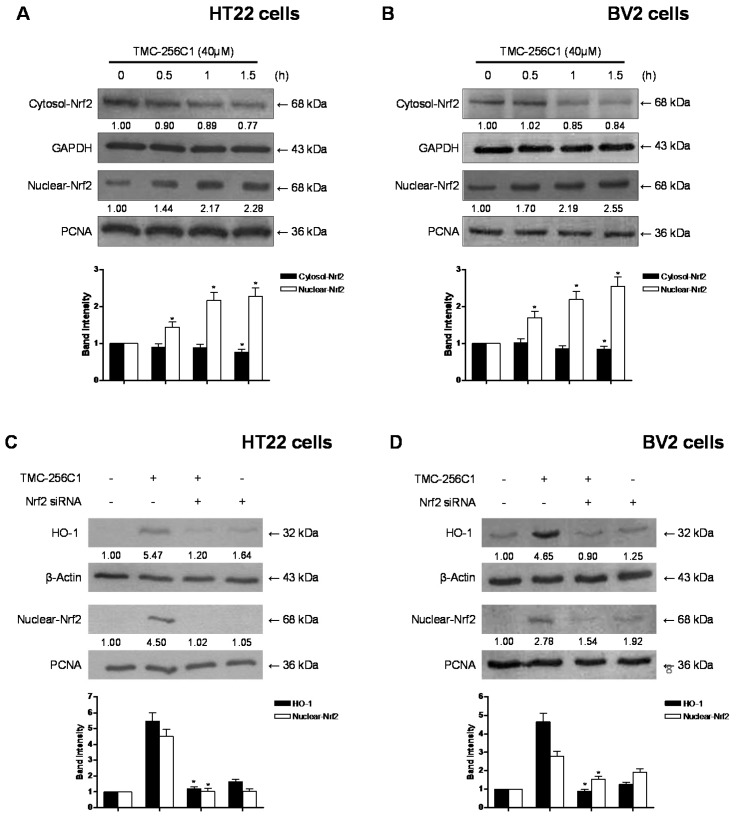
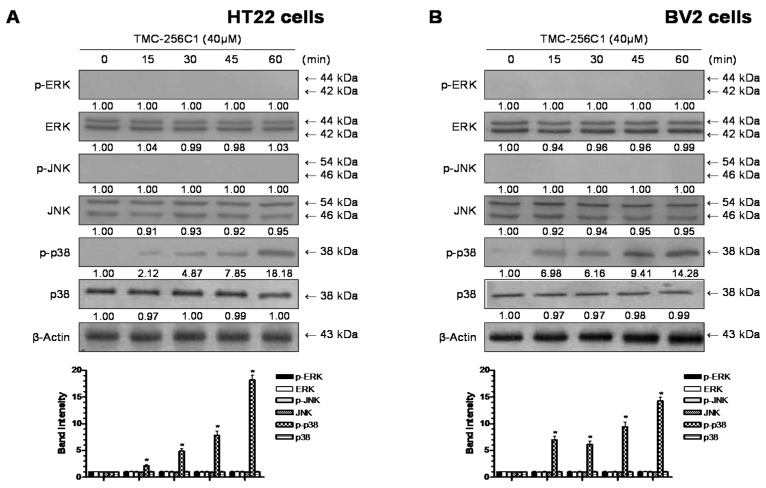
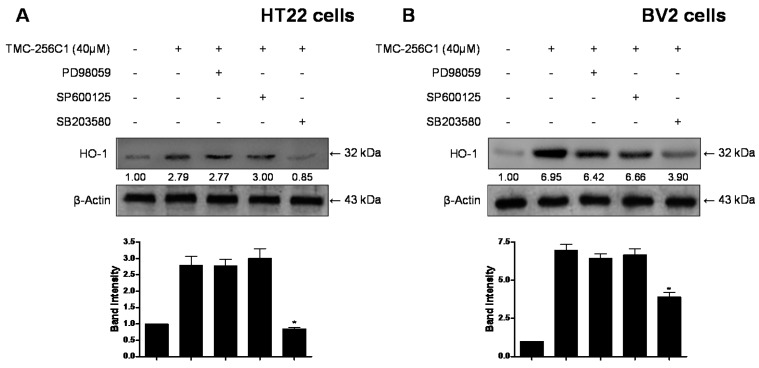
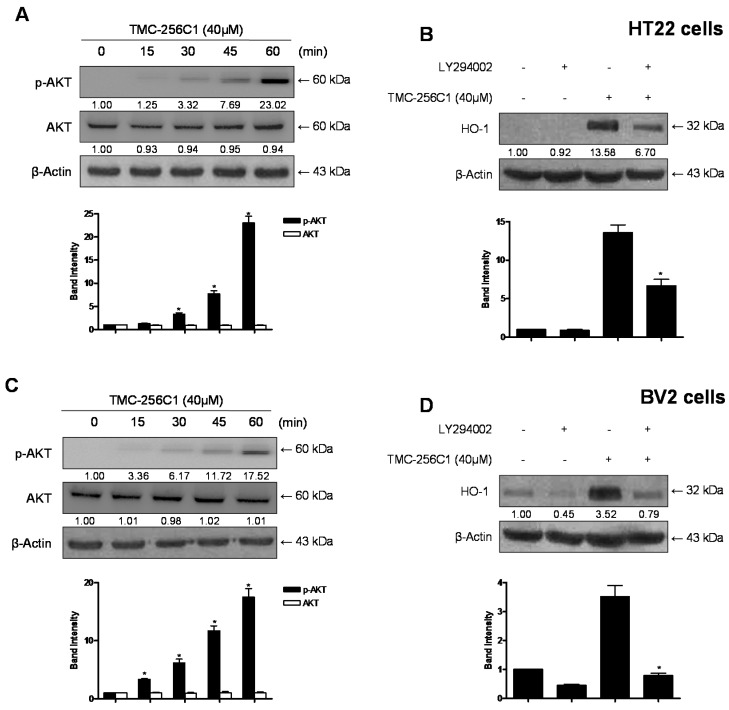
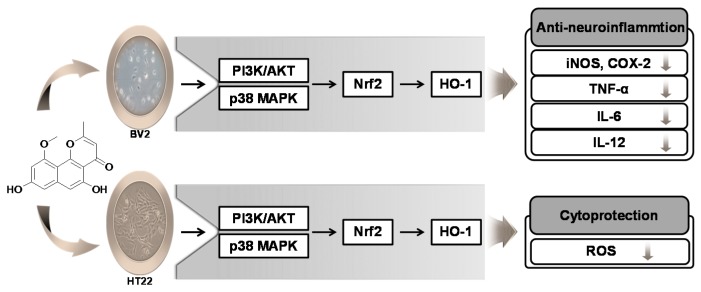
In the course of searching for bioactive secondary metabolites from marine fungi, TMC-256C1 was isolated from an ethyl acetate extract of the marine-derived fungus Aspergillus sp. SF6354. TMC-256C1 displayed anti-neuroinflammatory effect in BV2 microglial cells induced by lipopolysaccharides (LPS) as well as neuroprotective effect against glutamate-stimulated neurotoxicity in mouse hippocampal HT22 cells. TMC-256C1 was shown to develop a cellular resistance to oxidative damage caused by glutamate-induced cytotoxicity and reactive oxygen species (ROS) generation in HT22 cells, and suppress the inflammation process in LPS-stimulated BV2 cells. Furthermore, the neuroprotective and anti-neuroinflammatory activities of TMC-256C1 were associated with upregulated expression of heme oxygenase (HO)-1 and nuclear translocation of nuclear factor-E2-related factor 2 (Nrf2) in HT22 and BV2 cells. We also found that TMC-256C1 activated p38 mitogen-activated protein kinases (MAPK) and phosphatidylinositol 3-kinase (PI3K)/Akt signaling pathways in HT22 and BV2 cells. These results demonstrated that TMC-256C1 activates HO-1 protein expression, probably by increasing nuclear Nrf2 levels via the activation of the p38 MAPK and PI3K/Akt pathways.

Keywords: Aspergillus; TMC-256C1; anti-neuroinflammatory effect; heme oxygenase-1 (HO-1); marine fungus; neuroprotective effect.


Figures

Figure 1
Figure 1
Chemical structure of TMC-256C1 (A); and effect of TMC-256C1 on cell viability (B,C). HT22 and BV2 cells were incubated for 24 h with various concentrations of TMC-256C1 (5–40 μM). Cell viability was determined as described in the Experimental Section. Bar represents the mean ± standard deviation (SD) of three independent experiments.
Figure 2
Figure 2
Effects of TMC-256C1 on glutamate-induced oxidative neurotoxicity (A); and generation of reactive oxygen species (B). HT22 cells were treated with TMC-256C1 and then incubated for 12 h with glutamate (5 mM) (A). Exposure of HT22 cells to glutamate resulted in increased reactive oxygen species production (B). Data are presented as the mean value of three experiments ± SD. * p < 0.05 compared to the group treated with glutamate. Trolox® (50 μM) was used as a positive control.
Figure 3
Figure 3
Effects of TMC-256C1 on mRNA expression levels of TNF-α (A); IL-1β (B); IL-6 (C); and IL-12 (D) in BV2 cells stimulated with lipopolysaccharide (LPS). Cells were pre-treated for 3 h with the indicated concentrations of TMC-256C1, and then stimulated for 12 h with LPS (1 μg/mL). The concentrations of TNF-α (A); IL-1β (B); IL-6 (C); and IL-12 (D) were determined as described in the Experimental Section. Data represent the mean values of three experiments ± SD. * p < 0.05 compared to the group treated with LPS.
Figure 4
Figure 4
Effects of TMC-256C1 on the production of NO (A) and PGE2 (B) and the protein expression levels of inducible nitric oxide synthase (iNOS) and cyclooxygenase-2 (COX-2) (C) in BV2 cells stimulated with LPS. Cells were pre-treated for 3 h with the indicated concentrations of TMC-256C1, and for 24 h with LPS (1 μg/mL). Western blot analysis (C) was performed as described in the Experimental Section. Band intensity was quantified by densitometry and normalized to β-actin, and the normalized values are presented at the bottom of each band. Data represent the mean values of three experiments ± SD. * p < 0.05 compared to the group treated with LPS.
Figure 5
Figure 5
Effects of TMC-256C1 on LPS-induced NF-κB activation (AC). Following pretreatment with TMC-256C1 (10, 20, and 40 μM) for 3 h, cells were treated with LPS for 1 h. Total proteins were prepared and Western blot analysis was performed using antibodies specific for IκB-α and p-IκB-α (A); Cytosolic and nuclear extracts were prepared for use in Western blots for NF-κB p65 and p50, using specific anti-p65 and anti-p50 monoclonal antibodies (B); A commercially available NF-κB ELISA (Active Motif) was used to test the nuclear extracts and determine the degree of NF-κB binding (C). Band intensity was quantified by densitometry and normalized to β-actin, glyceraldehyde-3-phosphate dehydrogenase (GAPDH) and proliferating cell nuclear antigen (PCNA), and the normalized values are presented at the bottom of each band. The data shown, representative of three independent experiments, are the mean values of three experiments ± SD. * p < 0.05 compared to the group treated with LPS.
Figure 6
Figure 6
Effects of TMC-256C1 on hemeoxygenase (HO)-1 expression in HT22 cells (A,C) and BV2 cells (B,D). Cells were incubated for 12 h with the indicated concentrations of TMC-256C1 (A,B) and with 40 μM of TMC-256C1 (C,D). Western blot analysis for HO-1 expression was performed and representative blots of three independent experiments are shown. Band intensity was quantified by densitometry and normalized to β-actin, and the normalized values are presented at the bottom of each band. The data shown, representative of three independent experiments, are the mean values of three experiments ± SD. * p < 0.05 compared to the group treated with LPS.
Figure 7
Figure 7
Effects of tin protoporphyrin (SnPP) on glutamate-induced oxidative neurotoxicity (A) and reactive oxygen species generation (B) in HT22 cells, and inhibition of nitrate (C); PGE2 (D); IL-6 (E); and TNF-α (F) IL-12 (G) production by TMC-256C1 pre-treatment of lipopolysaccharide (LPS)-stimulated BV2 cells. HT22 cells were pre-treated with TMC-256C1 in the presence or absence of SnPP (50 μM) and then incubated for 12 h with glutamate (5 mM) (A). Exposure of HT22 cells to 5 mM glutamate for 12 h in the presence or absence of SnPP (50 μM) increased reactive oxygen species production (B). BV2 cells were pre-treated for 3 h with TMC-256C1 (40 μM) in the presence or absence of SnPP (50 μM) and stimulated for 24 h with LPS (1 μg/mL) (CG). HT22 cells and BV2 microglia were pretreated with SnPP for 3 h in this experiment. Data are presented as the mean value of three experiments ± SD. * p < 0.05 (Newman-Keuls post hoc test).
Figure 8
Figure 8
Effects of TMC-256C1 on the nuclear translocation of nuclear transcription factor-E2-related factor 2 (Nrf2) (A,B) and Nrf2-mediated HO-1 (C,D) in HT22 cells and BV2 cells. Cells were treated with 40 μM of TMC-256C1 for 0.5, 1, and 1.5 h (A,B). The nuclei were fractionated from the cytosol using M-PER™ Mammalian Protein Extraction buffer (Pierce Biotechnology, Rockford, IL, USA). HT22 cells and BV2 cells were transiently transfected with Nrf2 siRNA and then treated with 40 μM TMC-256C1 for 12 h (C,D). Nrf2 protein was detected by Western blot analysis and representative blots of three independent experiments are shown. Band intensity was quantified by densitometry and normalized to β-actin, glyceraldehyde-3-phosphate dehydrogenase (GAPDH) and proliferating cell nuclear antigen (PCNA), and the normalized values are presented at the bottom of each band. The data shown, representative of three independent experiments, are the mean values of three experiments ± SD. * p < 0.05 compared to the group treated with LPS.
Figure 9
Figure 9
Effects of TMC-256C1 on extracellular signal-regulated kinases (ERK), c-Jun N-terminal kinase (JNK) and p38 mitogen-activated protein kinases (MAPK) expression in HT22 cells (A) and BV2 cells (B). Cells were treated with 40 µM TMC-256C1 for the indicated times. Cell extracts were analyzed by Western blot with antibodies specific for phosphorylated ERK1/2 (p-ERK), phosphorylated JNK (p-JNK), or phosphorylated p38 (p-p38). Membranes were stripped and re-probed using antibodies with affinity for both the phosphorylated and non-phosphorylated forms of each MAPK as a control, and the representative blots of three independent experiments are shown. Band intensity was quantified by densitometry and normalized to β-actin, and the normalized values are presented at the bottom of each band. The data shown, representative of three independent experiments, are the mean values of three experiments ± SD. * p < 0.05 compared to the group treated with LPS.
Figure 10
Figure 10
Effects of p38 activation induced by TMC-256C1 on HO-1 expression in HT22 cells (A) and BV2 cells (B). Cells were pre-treated for 1 h with the specific inhibitors, PD98059 (40 μM), SP600125 (25 μM), and SB203580 (20 μM), and then treated with TMC-256C1 (40 μM) for 12 h. Band intensity was quantified by densitometry and normalized to β-actin, and the normalized values are presented at the bottom of each band. The data shown, representative of three independent experiments, are the mean values of three experiments ± SD. * p < 0.05 compared to the group treated with LPS.
Figure 11
Figure 11
Effects of TMC-256C1 on HO-1 expression through the PI3K/AKT cascade in HT22 and (A,B) and BV2 cells(C,D). Cells were treated with TMC-256C1 (40 μM) for the indicated times (A,C). Cells were pre-incubated with or without 10 μM LY294002 for 1 h and then incubated in the absence or presence of 40 μM of TMC-256C1 for 12 h (B,D). Cell extracts were analyzed by Western blots with specific antibodies, and representative blots of three independent experiments are shown. Band intensity was quantified by densitometry and normalized to β-actin, and the normalized values are presented at the bottom of each band. The data shown, representative of three independent experiments, are the mean values of three experiments ± SD. * p < 0.05 compared to the group treated with LPS.
Figure 12
Figure 12
The suggested mechanism for the anti-neuroinflammatory and cytoprotective effects of TMC-256C1 in HT22 and BV2 cells. TMC-256C1 increased cellular resistance to oxidative injury induced by glutamate-induced oxidative cytotoxicity in HT22 cells, via Nrf2-dependent HO-1 expression. In BV2 cells, TMC-256C1 inhibited the LPS-induced production of pro-inflammatory mediators possibly through the Nrf2-dependent HO-1 expression. Especially, PI3K/Akt and p38 MAPK regulate the Nrf2 activation in both HT22 and BV2 cells.

References

    1. Mosley R.L., Benner E.J., Kadiu I., Thomas M., Boska M.D., Hasand K., Lauriea C., Gendelman H.E. Neuroinflammation, oxidative stress, and the pathogenesis of Parkinson’s disease. Clin. Neurosci. Res. 2006;6:261–281. doi: 10.1016/j.cnr.2006.09.006. - DOI - PMC - PubMed
    1. Smith M.A., Rottkamp C.A., Nunomura A., Raina A.K., Perry G. Oxidative stress in Alzheimer’s disease. Biochim. Biophys. Acta. 2000;1502:139–144. doi: 10.1016/S0925-4439(00)00040-5. - DOI - PubMed
    1. Xu X., Chua C.C., Kong J., Kostrzewa R.M., Kumaraguru U., Hamdy R.C., Chua B.H. Necrostatin-1 protects against glutamate-induced glutathionedepletion and caspase-independent cell death in HT22 cells. J. Neurochem. 2007;103:2004–2014. doi: 10.1111/j.1471-4159.2007.04884.x. - DOI - PubMed
    1. Maher P., Davis J.B. The role of monoamine metabolism in oxidative glutamate toxicity. J. Neurosci. 1996;16:6394–6401. - PMC - PubMed
    1. Glezer I., Simard A.R., Rivest S. Neuroprotective role of the innate immune system by microglia. Neuroscience. 2007;147:867–883. doi: 10.1016/j.neuroscience.2007.02.055. - DOI - PubMed

Publication types

MeSH terms

LinkOut - more resources