. 2016 Apr 12;11(4):e0152349.
doi: 10.1371/journal.pone.0152349. eCollection 2016.

A Stochastic Individual-Based Model of the Progression of Atrial Fibrillation in Individuals and Populations

Affiliations

A Stochastic Individual-Based Model of the Progression of Atrial Fibrillation in Individuals and Populations

Eugene T Y Chang et al. PLoS One. .

Abstract

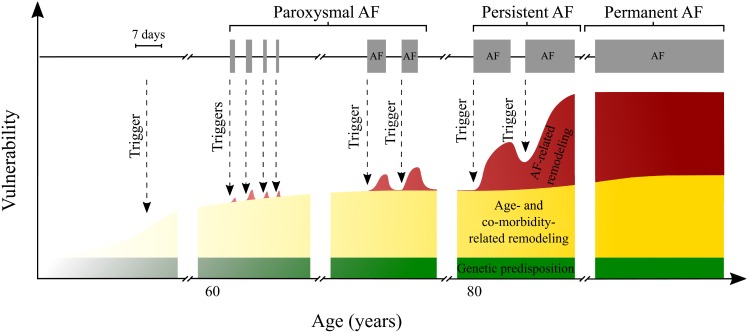
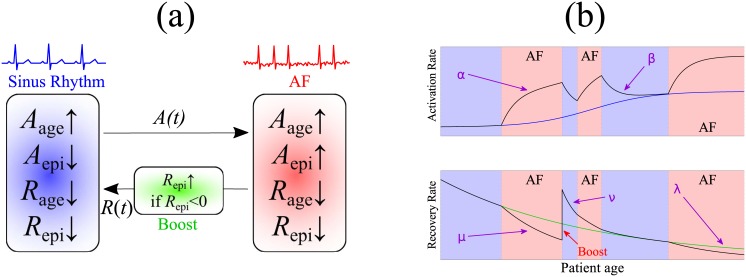
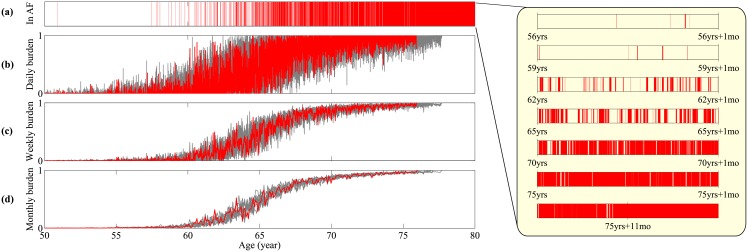
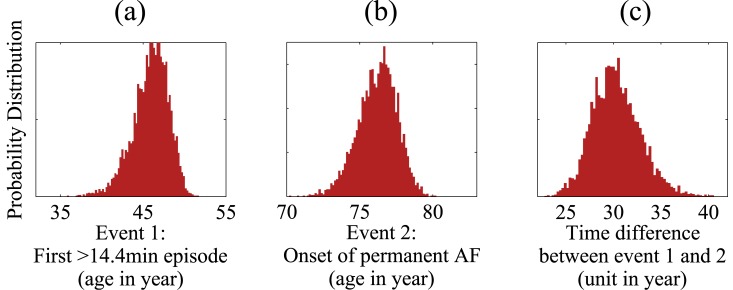
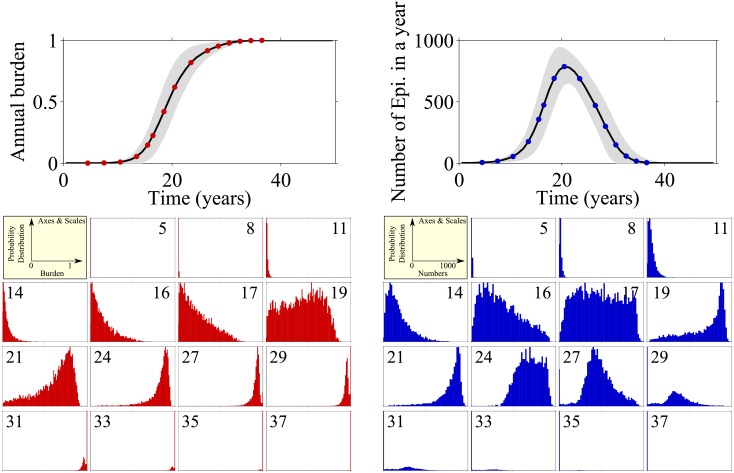
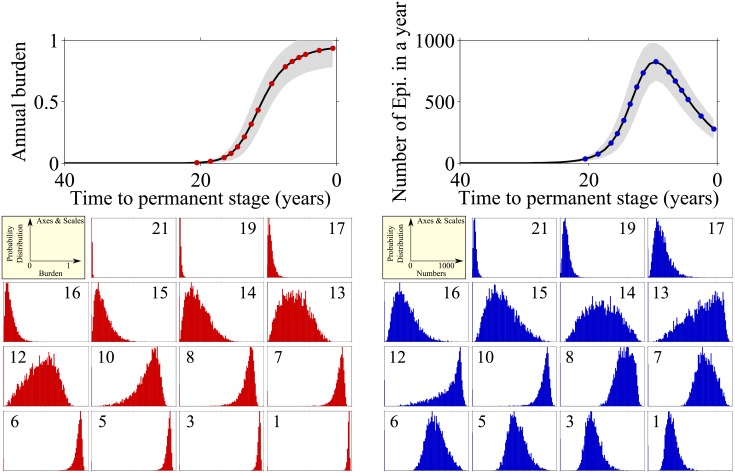
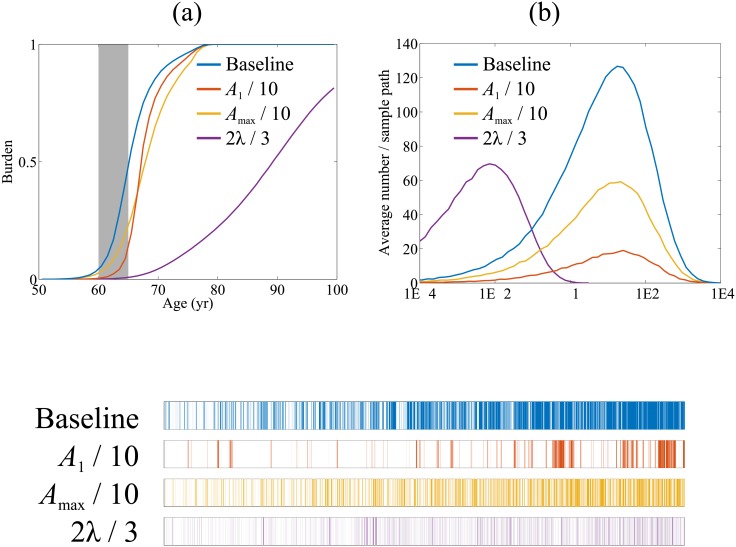
Models that represent the mechanisms that initiate and sustain atrial fibrillation (AF) in the heart are computationally expensive to simulate and therefore only capture short time scales of a few heart beats. It is therefore difficult to embed biophysical mechanisms into both policy-level disease models, which consider populations of patients over multiple decades, and guidelines that recommend treatment strategies for patients. The aim of this study is to link these modelling paradigms using a stylised population-level model that both represents AF progression over a long time-scale and retains a description of biophysical mechanisms. We develop a non-Markovian binary switching model incorporating three different aspects of AF progression: genetic disposition, disease/age related remodelling, and AF-related remodelling. This approach allows us to simulate individual AF episodes as well as the natural progression of AF in patients over a period of decades. Model parameters are derived, where possible, from the literature, and the model development has highlighted a need for quantitative data that describe the progression of AF in population of patients. The model produces time series data of AF episodes over the lifetimes of simulated patients. These are analysed to quantitatively describe progression of AF in terms of several underlying parameters. Overall, the model has potential to link mechanisms of AF to progression, and to be used as a tool to study clinical markers of AF or as training data for AF classification algorithms.


Conflict of interest statement

Competing Interests: The authors have declared that no competing interests exist.

Figures

Fig 1
Fig 1. A framework of AF initiation, maintenance and progression, based on [36].
AF onset is dependent on substrate vulnerability and triggers, as described by Heijman et al [36]. Within the present study vulnerability and triggers are combined in to a single factor—activation rate. Activation rate is then dependent on a constant genetic predisposition, time-varying age/co-morbidity-related remodelling, AF-induced remodelling dependent on AF history and trigger events. Physiological changes may increase both the rate of a trigger event occurring and likelihood of AF episode initiation following a trigger event. Over time, some patients progress on to paroxysmal, persistent and permanent AF as their substrate vulnerability and frequency of trigger events increases. Note the timescale for AF triggers and episodes is distinct from the lower axis and is expanded for clarity.
Fig 2
Fig 2. Illustration of the main mechanics of the model.
(a) Main elements governing the switching process between sinus rhythm and AF. (b) Time courses of activation rate and recovery rate during AF episodes and in sinus rhythm. activation rate of AF due to ageing, Aage, increases according to a sigmoid function, and age-based recovery rate Rage decreases exponentially. A healthy patient triggers an AF episode with rate A(t) and terminates an AF episode with rate R(t). In AF, episode-based remodelling Aepi transiently increases activation rate at a rate α and decreases the total recovery rate R at rate μ. When an episode terminates, the recovery rate ‘boosts’ above baseline by a factor of B. Back in sinus rhythm, Aepi decays to zero with rate β and Repi decays with rate ν back to the age-based baseline Rage.
Fig 3
Fig 3. Time series of AF progression.
A sample path is visualized by the red line, and from top to bottom: (a) Binary signal whether the patient is in an AF episode, (b) the fraction of the time in AF episodes per day, (c) the fraction of the time in AF episode per week, (d) the fraction of the time in AF episode per month. In (b-d) 9 other sample paths are plotted in grey lines in order to illustrate the distribution induced by intrinsic stochasticity. Inset: the progression of AF episode frequency and duration at time points in the simulation.
Fig 4
Fig 4. Distributions of age at which paroxysmal AF sets it (panel (a)), age at which permanent AF sets in (panel (b)), and the time elapsed between these two events (panel (c)).
Data were generated from 5000 independent simulation runs of the model.
Fig 5
Fig 5. Left: Top panel shows annual AF burden (left) and number of episodes (right) after patient has entered paroxysmal AF.
Horizontal axis indicates time elapsed since onset of paroxysmal AF. The mean of 5000 simulation runs is indicated as solid line, grey area shows the standard deviation. Smaller panels show distribution of burdens (left) and numbers of episodes (right) across the patient population at the indicated points in time (years after onset of paroxysmal AF) in a moving window of 12-months duration.
Fig 6
Fig 6. Burden (left) and number of episodes (right) before patient goes into permanent AF.
In both panels we present the mean of the random variables (solid black) and mean ± 1 standard deviation (grey area) at the top, and at the bottom we measure the distributions of the random variables at 15 sampled time t = [21, 19, 17, 16, 15, 14, 13, 12, 10, 8, 7, 6, 5, 3, 1] years before the permanent episode.
Fig 7
Fig 7. Effects of changing parameters on outputs.
The top graphs represent the average over 100 sample paths of (a) the annual AF burden versus absolute age up to a notional age of 100 years, and (b) number of episodes versus episode duration over the absolute age 60–65. (c) is a visualisation of a single sample path from each parameter variant over the same 60–65 period a (b). Additional sample paths are listed in Supporting Information (S3 Fig).

References

    1. Camm AJ, Kirchhof P, Lip GYH, Schotten U, Savelieva I, Ernst S, et al. Guidelines for the management of atrial fibrillation. European Heart Journal. 2010;31(19):2369–2429. 10.1093/eurheartj/ehq278 - DOI - PubMed
    1. National Collaborating Centre for Chronic Conditions. Atrial Fibrillation: National clinical guideline for management in primary and secondary care. Royal College of Physicians,; 2006. CG36 Available from: http://guidance.nice.org.uk/CG36. - PubMed
    1. National Clinical Guideline Centre. Atrial fibrillation: the management of atrial fibrillation. National Institute for Health and Care Excellence; 2014. CG180 ISBN 978-1-4731-0603-1. Available from: https://www.nice.org.uk/guidance/cg180.
    1. Nattel S. New ideas about atrial fibrillation 50 years on. Nature. 2002;415(6868):219–226. 10.1038/415219a - DOI - PubMed
    1. Schotten U, Verheule S, Kirchhof P, Goette A. Pathophysiological mechanisms of atrial fibrillation: A translational appraisal. Physiological Reviews. 2011;(91):265–325. 10.1152/physrev.00031.2009 - DOI - PubMed

Publication types