. 2016 Apr 19;113(16):4524-9.
doi: 10.1073/pnas.1521706113. Epub 2016 Apr 8.

Mapping physiological G protein-coupled receptor signaling pathways reveals a role for receptor phosphorylation in airway contraction

Affiliations

Mapping physiological G protein-coupled receptor signaling pathways reveals a role for receptor phosphorylation in airway contraction

Sophie J Bradley et al. Proc Natl Acad Sci U S A. .

Abstract

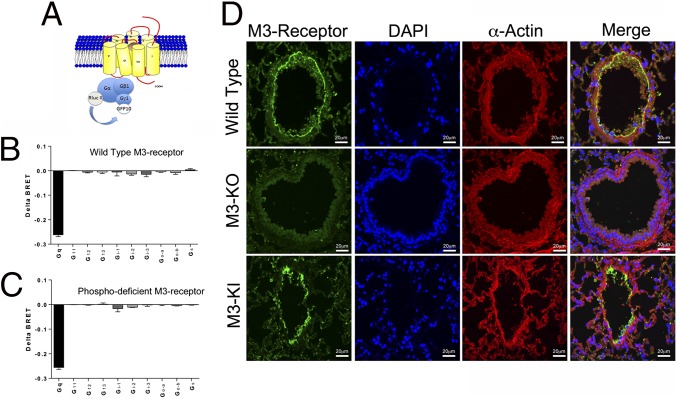
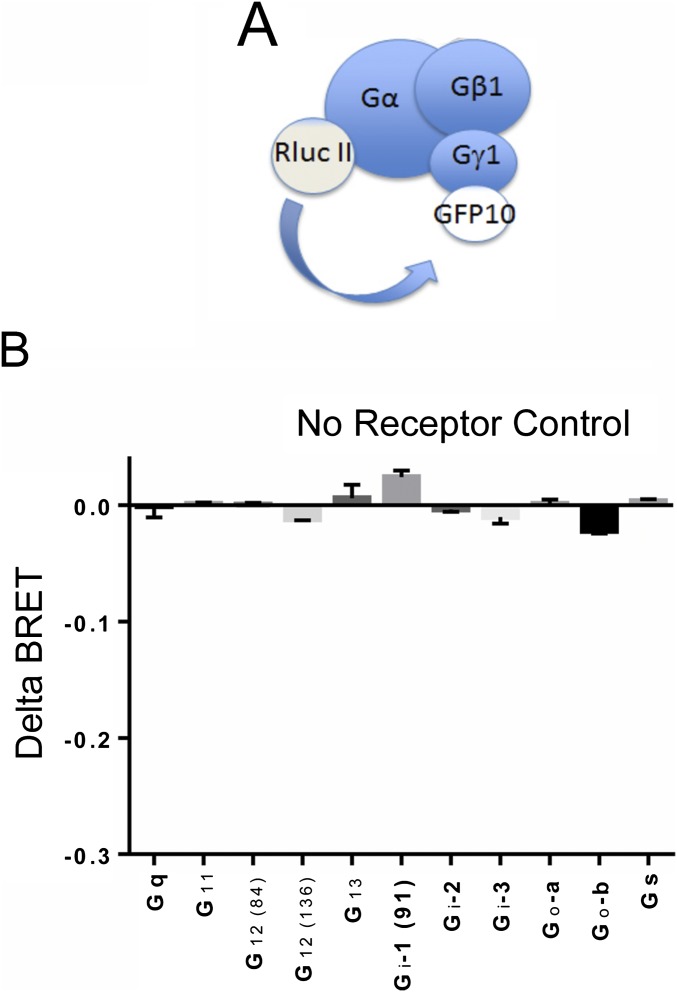
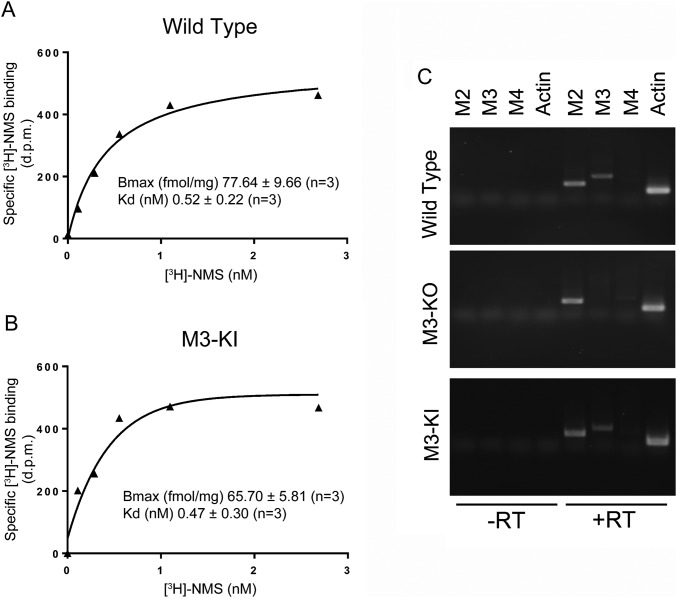
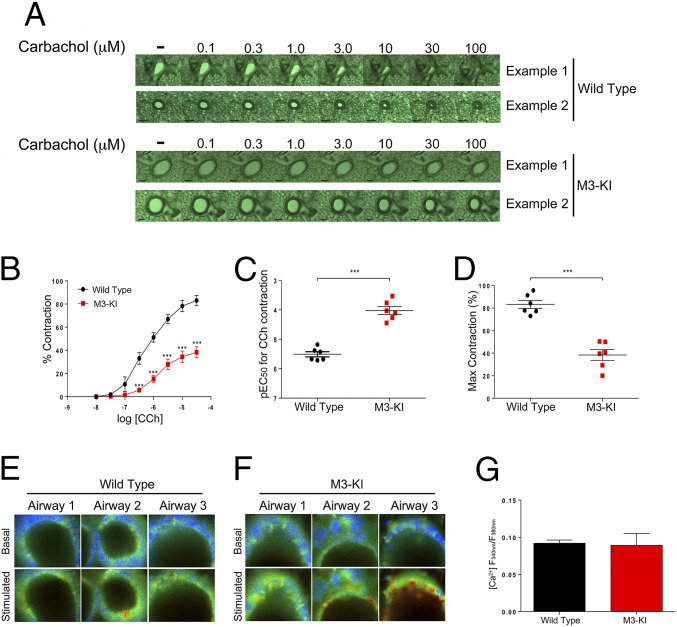
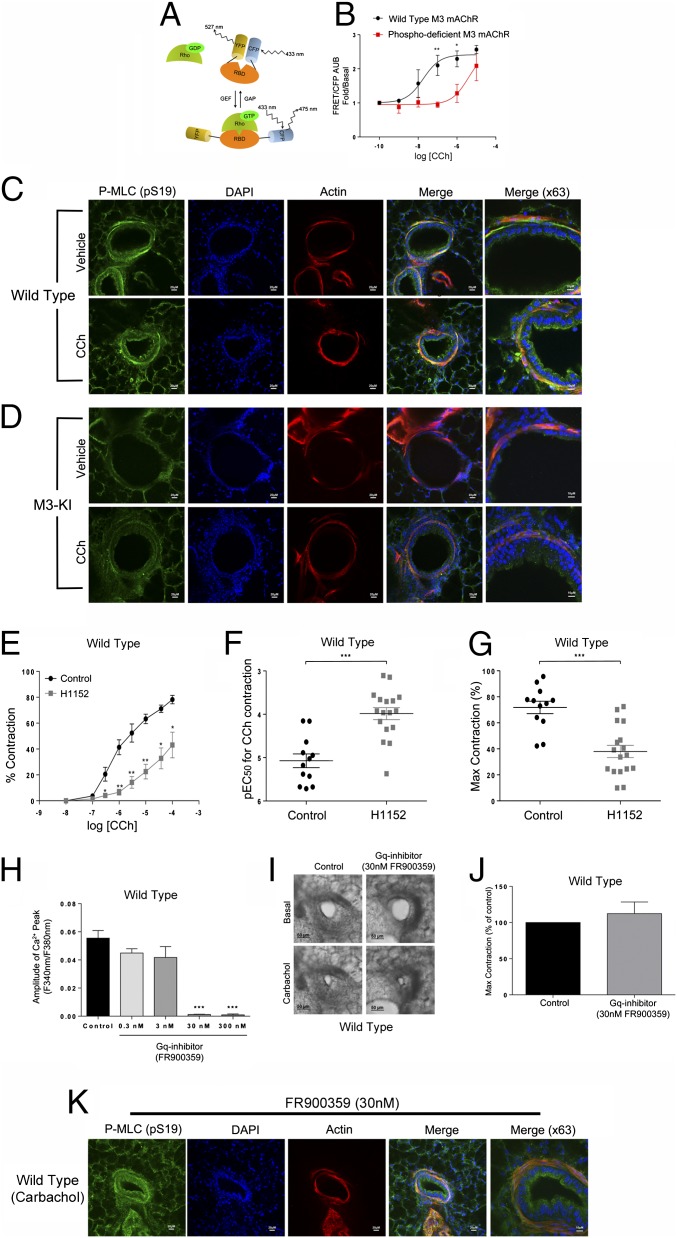
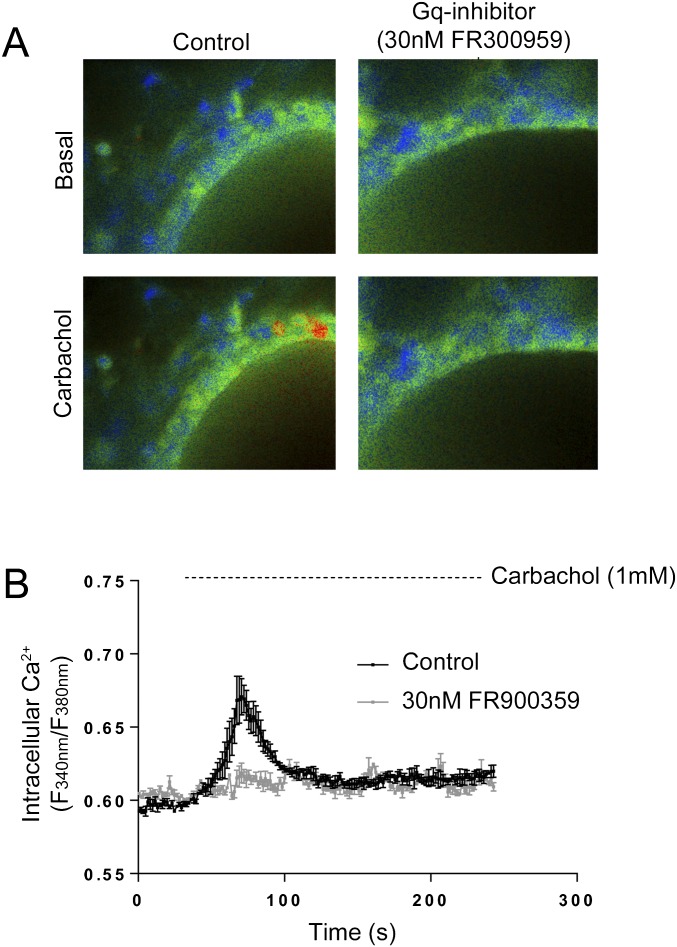
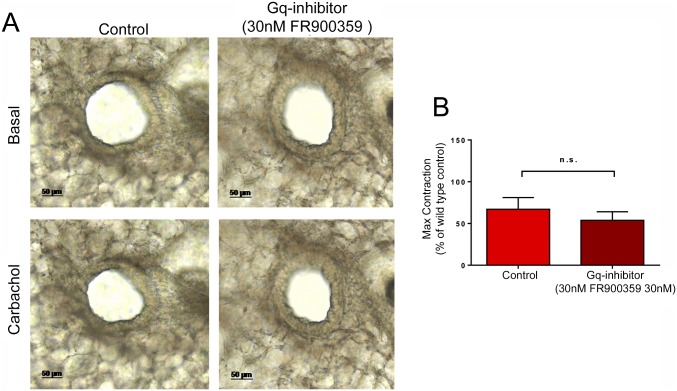
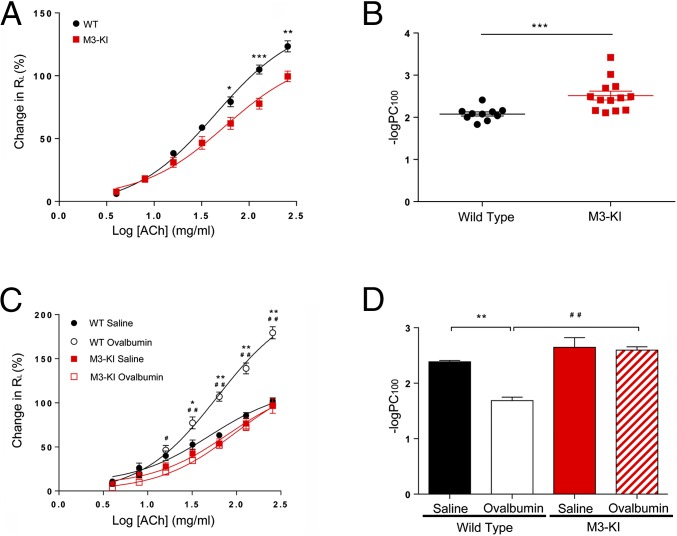
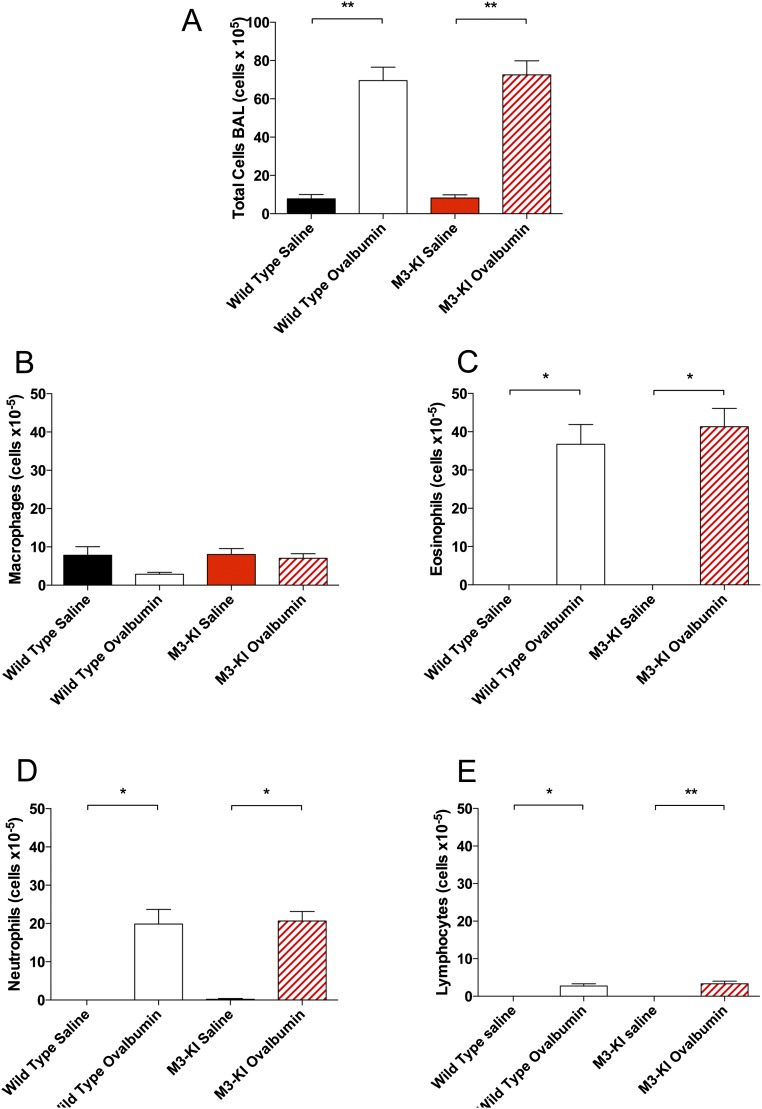
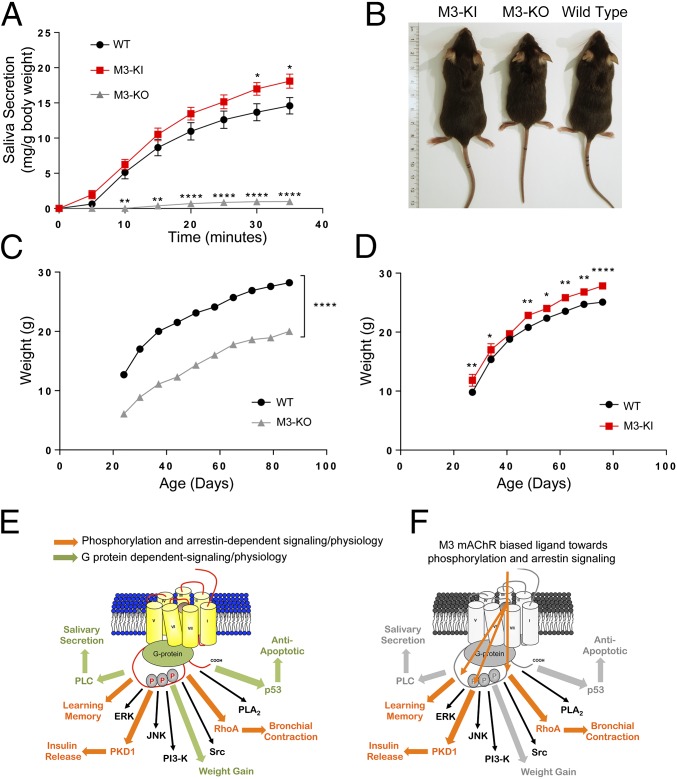
G protein-coupled receptors (GPCRs) are known to initiate a plethora of signaling pathways in vitro. However, it is unclear which of these pathways are engaged to mediate physiological responses. Here, we examine the distinct roles of Gq/11-dependent signaling and receptor phosphorylation-dependent signaling in bronchial airway contraction and lung function regulated through the M3-muscarinic acetylcholine receptor (M3-mAChR). By using a genetically engineered mouse expressing a G protein-biased M3-mAChR mutant, we reveal the first evidence, to our knowledge, of a role for M3-mAChR phosphorylation in bronchial smooth muscle contraction in health and in a disease state with relevance to human asthma. Furthermore, this mouse model can be used to distinguish the physiological responses that are regulated by M3-mAChR phosphorylation (which include control of lung function) from those responses that are downstream of G protein signaling. In this way, we present an approach by which to predict the physiological/therapeutic outcome of M3-mAChR-biased ligands with important implications for drug discovery.

Keywords: G protein-coupled receptor; asthma; ligand bias; muscarinic; signaling.


Conflict of interest statement

The authors declare no conflict of interest.

Figures

Fig. 1.
Fig. 1.
Characterization of M3-mAChR expression and G protein coupling in the airways of WT and M3-KI mice. (A) Illustration of the BRET-based biosensor to measure G protein coupling, where various donor Rluc II Gα-subunits can be transfected with an acceptor GFP10-Gγ1 subunit together with the M3-mAChR. (B and C) Cells were transfected with the BRET biosensor consisting of various Rluc Gα-subunits. The change in BRET signal following receptor stimulation with carbachol (100 μM) in cells expressing the WT (B) or phosphodeficient M3-mAChR (C) is shown. Data represent the mean ± SEM of three independent experiments. (D) M3-mAChR (green) and smooth muscle α-actin immunoreactivity (red) in the airways of WT, M3-KO, and M3-KI mice. DAPI (blue) was used to stain nuclei. (Right) Overlaid images are shown.
Fig. S1.
Fig. S1.
Control for G protein BRET biosensor. (A) Illustration of the BRET-based biosensor to measure G protein coupling where various donor Rluc II Gα-subunits can be transfected together with an acceptor GFP10-Gγ1 subunit. The illustration is of the biosensor transfected without the receptor as a control. (B) Change in BRET signal following stimulation with CCh (100 μM) in cells transfected with the BRET biosensor consisting of various Rluc Gα-subunits without cotransfection with the M3-mAChR. Data represent the mean ± SEM of three independent experiments.
Fig. S2.
Fig. S2.
mAChR expression is unaltered in the lung of M3-KI mice relative to WT. Saturation binding of the muscarinic receptor antagonist [3H]-NMS to membranes prepared from the lung of WT (A) or M3-KI (B) mice. Membranes were incubated with increasing concentrations of [3H]-NMS in the absence or presence of 10 μM atropine to generate values for specific [3H]-NMS binding. Single representative experiments are shown, with similar data being obtained on two additional occasions (mean Bmax and Kd values are also shown). (C) RT-PCR showing the expression profile of M2-, M3- and M4-mAChR RNA in the lungs of WT, M3-KO, and M3-KI mice. Expression of actin RNA and omission of reverse transcriptase (RT) were used as a control.
Fig. 2.
Fig. 2.
M3-mAChR–mediated ASM contraction is dependent on receptor phosphorylation-dependent signaling. (A) Four representative experiments, two from WT controls and two from M3-KI mice, showing the bronchoconstriction responses to increasing concentrations of carbachol in PCLS. (BD) Contractile responses in PCLS derived from WT and M3-KI mice. (B) Mean concentration–response curves to carbachol (CCh) in WT and M3-KI PCLS. Mean pEC50 (C) and mean Emax (D) values calculated from the above PCLS concentration–response curves (n = 6 in each group). (E and F) In PCLS from WT and M3-KI mice, calcium responses following ACh (100 μM) stimulation were evaluated. Shown are three representative airway responses from PCLS derived from WT mice (E) and three representative airway responses from PCLS derived from M3-KI mice (F). (G) Average (±SEM) peak calcium responses from representative airways shown in E and F (all responsive single cells from each airway were included in the analysis). Data show the mean ± SEM and were analyzed using an unpaired t test (***P < 0.001).
Fig. 3.
Fig. 3.
M3-mAChR–mediated ASM contraction is dependent on receptor phosphorylation-dependent coupling to RhoA signaling. (A) Illustration of the FRET-based biosensor used to detect activated RhoA (GTP-bound). (B) Rho activity in CHO cells expressing the WT or the phosphodeficient M3-mAChR mutant in response to CCh. Data represent the mean ± SEM (n = 4). Data were analyzed using two-way ANOVA (*P < 0.05; **P < 0.01). Phospho-MLC2 (Ser-19, green) and smooth muscle α-actin (red) immunoreactivity is shown in the airways of WT (C) or M3-KI (D) mice stimulated with vehicle or CCh (100 μM,10 min). DAPI (blue) was used to stain nuclei. (Right) Overlaid images and images of the same airway using a 63× objective are shown. (EG) Effect of Rho-kinase inhibitor H1152 on contractile responses in WT PCLS. (E) Mean concentration–response curves to CCh in WT PCLS pretreated with vehicle or H1152 (100 nM, 45 min of preincubation). Mean pEC50 (F) and mean Emax (G) values calculated from the above PCLS CCh concentration–response curves in the presence and absence of H1152 (n = 12 in vehicle-treated PCLS and n = 17 in H1152-treated PCLS) are shown. Data in EG were analyzed using an unpaired t test (***P < 0.001). (HJ) Effects of the Gq inhibitor FR900359 on CCh (100 μM)-stimulated calcium responses and bronchoconstriction in PCLS from WT mice. (H) Average (±SEM) peak calcium responses stimulated by CCh after preincubation with increasing concentrations of FR900359 (0.3–300 nM, 30 min). (I) Representative examples of CCh-induced bronchoconstriction in PCLS from WT mice under control conditions (Left) or following preincubation with 30 nM FR900359 (Right). (J) Mean contractile response to CCh in WT PCLS following preincubation with FR900359 (30 nM, 30 min), expressed as a percentage of CCh-stimulated maximum contraction in control slices. Max, Maximum. (K) Phospho-MLC2 (Ser-19, green) and smooth muscle α-actin (red) immunoreactivity in PCLS from WT mice stimulated with CCh (100 μM, 10 min) after preincubation with 30 nM FR900359. DAPI (blue) was used to stain nuclei. (Right) Overlaid image and an image of the same airway using a 63× objective are shown.
Fig. S3.
Fig. S3.
Inhibition of Gq abolishes the CCh-stimulated calcium mobilization in airways. (A) Representative examples of CCh (100 μM)-stimulated calcium release in PCLS from WT mice under control conditions or following preincubation with FR300959 (30 nM, 30 min) are shown. Images are 40× magnification. (B) Calcium response following carbachol (1 mM) stimulation under control conditions or following preincubation with FR900359 (30 nM, 30 min). The data are generated by analysis of fluorescent changes in 3–5 regions of interest.
Fig. S4.
Fig. S4.
FR900359 has no effect on the contractile response to CCh in PCLS from M3-KI mice. (A) Representative examples of CCh-induced bronchoconstriction in PCLS from M3-KI mice under control conditions (Left) or following preincubation with 30 nM FR900359 (Right). (B) Mean contractile response to CCh in M3-KI PCLS following preincubation with FR900359 (30 nM, 30 min), expressed as a percentage of CCh-stimulated maximum contraction in control WT PCLS. Max, Maximum; n.s., not significant.
Fig. 4.
Fig. 4.
Lung function and airway hyperresponsiveness are regulated by M3-mAChR phosphorylation/arrestin signaling. (A) Lung resistance (RL) was measured in WT and M3-KI mice at various ACh concentrations. Data represent the mean ± SEM (WT, n = 10; M3-KI, n = 13). (B) −LogPC100 was determined for WT and M3-KI mice. Data presented in A and B are the mean ± SEM (WT, n = 10; M3-KI, n = 13). Data were analyzed using Kruskal–Wallis and Mann–Whitney tests (WT vs. M3-KI: *P < 0.05; **P < 0.01; ***P < 0.001). (C) Airway hyperresponsiveness was induced using ovalbumin sensitization followed by ovalbumin challenge in WT and M3-KI mice. Controls were ovalbumin sensitization followed by saline challenge. RL was determined at various ACh concentrations. Data represent the mean ± SEM (WT, n = 6; M3-KI, n = 6). Data were analyzed using Kruskal–Wallis and Mann–Whitney tests (WT saline vs. WT ovalbumin: *P < 0.05; **P < 0.01 and WT ovalbumin vs. M3-KI ovalbumin: #P < 0.05; ##P < 0.01). (D) −LogPC100 was determined for WT and M3-KI mice sensitized with ovalbumin and challenged with either control saline or ovalbumin. Data present the mean ± SEM (WT, n = 6, M3-KI, n = 6). Data were analyzed using Kruskal–Wallis and Mann–Whitney tests (WT saline vs. WT ovalbumin: **P < 0.01 and WT ovalbumin vs. M3-KI ovalbumin: ##P < 0.01).
Fig. S5.
Fig. S5.
Immune cell infiltration into the lung following allergen challenge is not dependent on M3-mAChR signaling via phosphorylation-dependent pathways. (A) Total cell count on BAL was counted using a trypan blue exclusion method. Cells isolated from BAL were centrifuged on glass slides and stained. Macrophages (B), eosinophils (C), neutrophils (D), and lymphocytes (E) were counted. Data represent the mean ± SEM (WT, n = 6; M3-KI, n = 6). Data were analyzed using Kruskal–Wallis and Mann–Whitney tests (*P < 0.05; **P < 0.01).
Fig. 5.
Fig. 5.
Mapping M3-mAChR physiological responses mediated by G protein- and receptor phosphorylation/arrestin-dependent signaling. (A) Salivary secretion in response to pilocarpine (1 mg/kg) administration was measured in WT, M3-KO, and M3-KI mice. The data represent the mean ± SEM of three to six mice. (B) Representative images of M3-KI, M3-KO, and WT mice demonstrating differences in weight. (C) Weight gain in WT and M3-KO mice. (D) Weight gain in WT and M3-KI mice. The data in A, C, and D represent the mean ± SEM of six to 11 mice and were analyzed using two-way ANOVA (*P < 0.05; **P < 0.01; ****P < 0.0001). (E) Illustration of the physiologically relevant signaling pathways downstream of the M3-mAChR. Some of the pathways activated by the M3-mAChR in heterologous systems are illustrated (i.e., PLC, ERK, PKD, JNK, PI3-K, Src, RhoA, PLA2, and p53). P13-K, phosphoinositide 3-kinase; PKD, protein kinase D; PLA2, phospholipase A2; PLC, phospholipase C. In this study, we used a mutant mouse strain (M3-KI) expressing a G protein-biased variant of the M3-mAChR to assign those physiological responses that were downstream of either G protein signaling (green arrows) or receptor phosphorylation and arrestin signaling (orange arrows). (F) Such a map also allows for the rational design of biased ligands because our studies present a model by which the physiological/therapeutic outcome of biased ligands can be predicted. Thus, for the M3-mAChR, a ligand that is biased toward receptor phosphorylation and arrestin signaling would preferentially affect insulin release, learning and memory, and bronchial contraction (orange arrows), although having potentially little impact on weight gain, salivary secretion, and cell death pathways (gray arrows).

Similar articles

Cited by

References

    1. Gosens R, Zaagsma J, Meurs H, Halayko AJ. Muscarinic receptor signaling in the pathophysiology of asthma and COPD. Respir Res. 2006;7:73. - PMC - PubMed
    1. Singh D, et al. Plethysmography and impulse oscillometry assessment of tiotropium and ipratropium bromide; a randomized, double-blind, placebo-controlled, cross-over study in healthy subjects. Br J Clin Pharmacol. 2006;61(4):398–404. - PMC - PubMed
    1. Somlyo AP, Somlyo AV. Ca2+ sensitivity of smooth muscle and nonmuscle myosin II: Modulated by G proteins, kinases, and myosin phosphatase. Physiol Rev. 2003;83(4):1325–1358. - PubMed
    1. Bai Y, Sanderson MJ. Modulation of the Ca2+ sensitivity of airway smooth muscle cells in murine lung slices. Am J Physiol Lung Cell Mol Physiol. 2006;291(2):L208–L221. - PubMed
    1. Liu C, Zuo J, Janssen LJ. Regulation of airway smooth muscle RhoA/ROCK activities by cholinergic and bronchodilator stimuli. Eur Respir J. 2006;28(4):703–711. - PubMed

Publication types

Substances