. 2016 May 3;113(18):5041-6.
doi: 10.1073/pnas.1523825113. Epub 2016 Apr 11.

Implications of lemuriform extinctions for the Malagasy flora

Affiliations

Implications of lemuriform extinctions for the Malagasy flora

Sarah Federman et al. Proc Natl Acad Sci U S A. .

Abstract

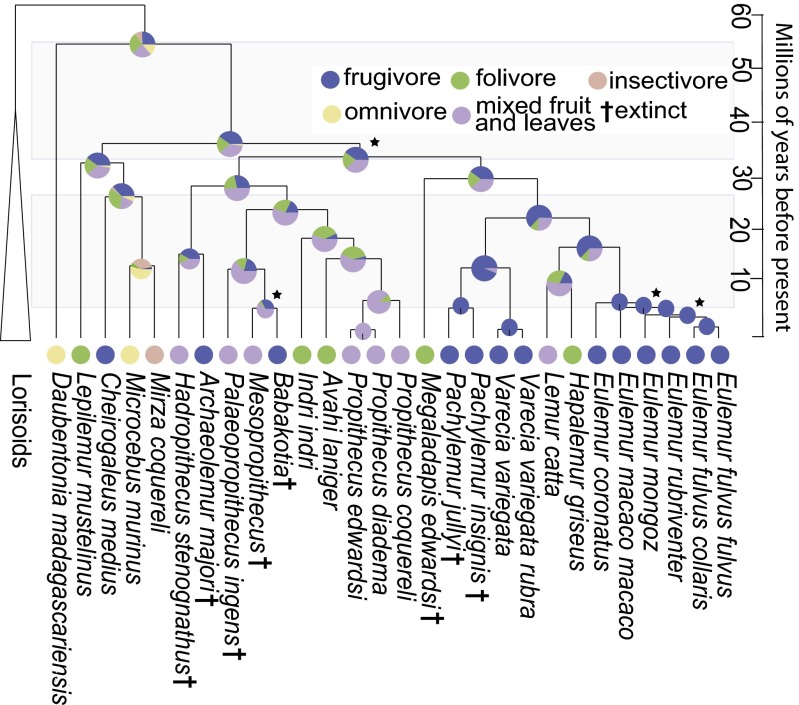
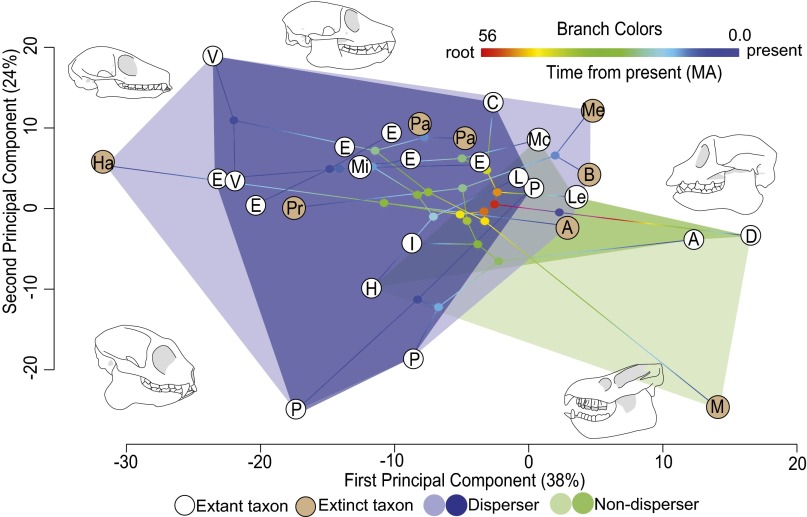
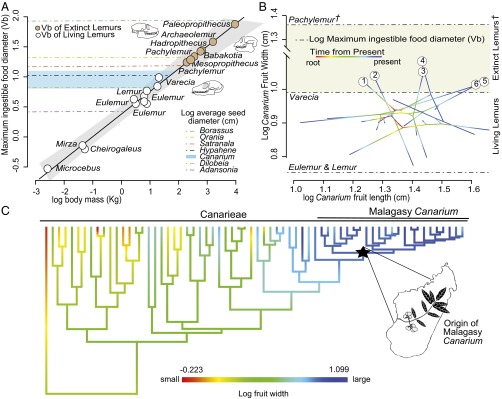
Madagascar's lemurs display a diverse array of feeding strategies with complex relationships to seed dispersal mechanisms in Malagasy plants. Although these relationships have been explored previously on a case-by-case basis, we present here the first comprehensive analysis of lemuriform feeding, to our knowledge, and its hypothesized effects on seed dispersal and the long-term survival of Malagasy plant lineages. We used a molecular phylogenetic framework to examine the mode and tempo of diet evolution, and to quantify the associated morphological space occupied by Madagascar's lemurs, both extinct and extant. Using statistical models and morphometric analyses, we demonstrate that the extinction of large-bodied lemurs resulted in a significant reduction in functional morphological space associated with seed dispersal ability. These reductions carry potentially far-reaching consequences for Malagasy ecosystems, and we highlight large-seeded Malagasy plants that appear to be without extant animal dispersers. We also identify living lemurs that are endangered yet occupy unique and essential dispersal niches defined by our morphometric analyses.

Keywords: Madagascar; anachronism; extinction; lemurs; seed dispersal.


Conflict of interest statement

The authors declare no conflict of interest.

Figures

Fig. 1.
Fig. 1.
Evolution of lemuriform dietary strategies. Time-calibrated lemur phylogeny with stochastic character mapping of feeding strategy (color legend at the base of the figure). Unless starred, all nodes represent a Bayesian posterior probability (BPP) of 0.95 and higher, whereas starred nodes have a BPP of 0.94 and lower. Extinct taxa are indicated by a dagger (†).
Fig. 2.
Fig. 2.
Phylogenetic PCA of phylogenetic residuals of lemur morphological measurements projected into morphological space. Colored phylogenetic branches indicate time since the root. Tips of the phylogeny are abbreviated: A, Avahi; B, Babakotia; C, Cheirogaleus; D, Daubentonia; E, Eulemur; H, Hapalemur; Ha, Hadropithecus; I, Indri; L, Lemur; Le, Lepilemur; M, Megaladapis; Me, Mesopropithecus; Mc, Microcebus; Mz, Mirza; P, Propithecus; Pa, Pachylemur; Pr, Paleopropithecus; V, Varecia. Tips with colored white circles indicate extant taxa, and tips with orange circles indicate extinct taxa. Colored polygons represent seed dispersers vs. nondispersers, with darker shaded areas indicating the morphological space occupied solely by extant lemurs. Lemur skull illustrations show morphologies occupying particular areas of morphological space. MA, million years before present.
Fig. S1.
Fig. S1.
Schematic of cranial and mandibular measurements. (1) Cranium length: prosthion to inion (i.e., distance from the most anterior point on the maxillary alveolar process, between the central incisors, to the most prominent projection on the occipital bone at the posteroinferior part of the skull). (2) Palate length: prosthion to alveolare (i.e., distance from the most anterior point on the maxillary alveolar process, between the central incisors, to the posterior palatine). (3) Upper canine length: length of the upper canine from gumline to tip. (4) Lower p2 length: length of the lower second (caniniform) premolar from gumline to tip. (5) Mandible length: infradentale to the posterior edge of the mandibular condyle. (6) Superficial masseter origin: measured from the posterior edge of the mandibular condyle to the posterior margin of m2. (7) Mandibular height: measured from the superior edge of the mandibular condyle to the base of the mandibular corpus. (8) Superficial masseter insertion: measured from the superior edge of the mandibular condyle to the superior edge of the angular process. (9) Upper M1 length: length at the longest point on the upper M1. (10) Upper M1 width: width at the broadest point on the upper M1. (11) Upper M2 length: length at the longest point on the upper M2. (12) Upper M2 width: width at the broadest point on the upper M2. (13) Lower m1 length: length at the longest point on the lower m1. (14) Lower m1 width: width at the broadest point on the lower m1. (15) Lower m2 length: length at the longest point on the lower m2. (16) Lower m2 width: width at the broadest point on the lower m2.
Fig. 3.
Fig. 3.
Seed size and evolution and the limits of Vb for extinct and extant frugivorous lemurs. (A) Linear model of relationships between frugivorous lemur body weight and Vb (n = 8; R2 = 0.96, P = 3.27 e−7). The light gray surrounding the regression line represents the 95% confidence range of Vb predictions. Orange circles represent Vb predictions for extinct lemurs, and white circles represent Vb predictions for extant lemurs. The horizontal blue area shows the 95% confidence range of Malagasy Canarium fruit diameters. Horizontal colored dashed lines indicate the seed diameter of other putatively orphaned angiosperm lineages. (B) Log-transformed Malagasy Canarium fruit length and width data projected into a 2D phylogenetic morphospace. Numbered lineages represent those Canarium species inferred to be outside of the Vb of extant lemur lineages (1, C. betamponae; 2, C. galokense; 3, C. longistipulatum; 4, C. elegans; 5, C. ampasindavae; 6, C. planifolium). Dashed lines indicate Vb of lemur lineages. (C) Maximum likelihood reconstruction of fruit width on the time-calibrated Canarieae phylogeny; the black star represents the crown of the Malagasy Canarium.
Fig. S2.
Fig. S2.
Lemuriform molecular phylogeny. Maximum clade credibility tree summarizing the results of Bayesian dating analyses (fossil calibration nodes marked with letters A–C) with normal probability priors on nodes B and C and a lognormal probability prior on node A. Numbers at the nodes show Bayesian posterior probabilities (BPPs). Daggers (†) next to species names indicate extinct taxa.

References

    1. Dewar RE, Richard AF. Evolution in the hypervariable environment of Madagascar. Proc Natl Acad Sci USA. 2007;104(34):13723–13727. - PMC - PubMed
    1. Yoder AD, Nowak MD. Has vicariance or dispersal been the predominant biogeographic force in Madagascar? Only time will tell. Annu Rev Ecol Evol Syst. 2006;37:405–431.
    1. Wright PC. Lemur traits and Madagascar ecology: Coping with an island environment. Am J Phys Anthropol. 1999;110(29) Suppl 29:31–72. - PubMed
    1. Razafindratsima OH, Mehtani S, Dunham AE. Extinctions, traits and phylogenetic community structure: Insights from primate assemblages in Madagascar. Ecography. 2013;36(1):47–56.
    1. Wright PC, et al. Frugivory in four sympatric lemurs: Implications for the future of Madagascar’s forests. Am J Primatol. 2011;73(6):585–602. - PubMed

Publication types

LinkOut - more resources