. 2016 Apr 26;113(17):E2383-92.
doi: 10.1073/pnas.1603892113. Epub 2016 Apr 11.

Induction of autoimmune disease by deletion of CTLA-4 in mice in adulthood

Affiliations

Induction of autoimmune disease by deletion of CTLA-4 in mice in adulthood

Katrin Klocke et al. Proc Natl Acad Sci U S A. .

Abstract

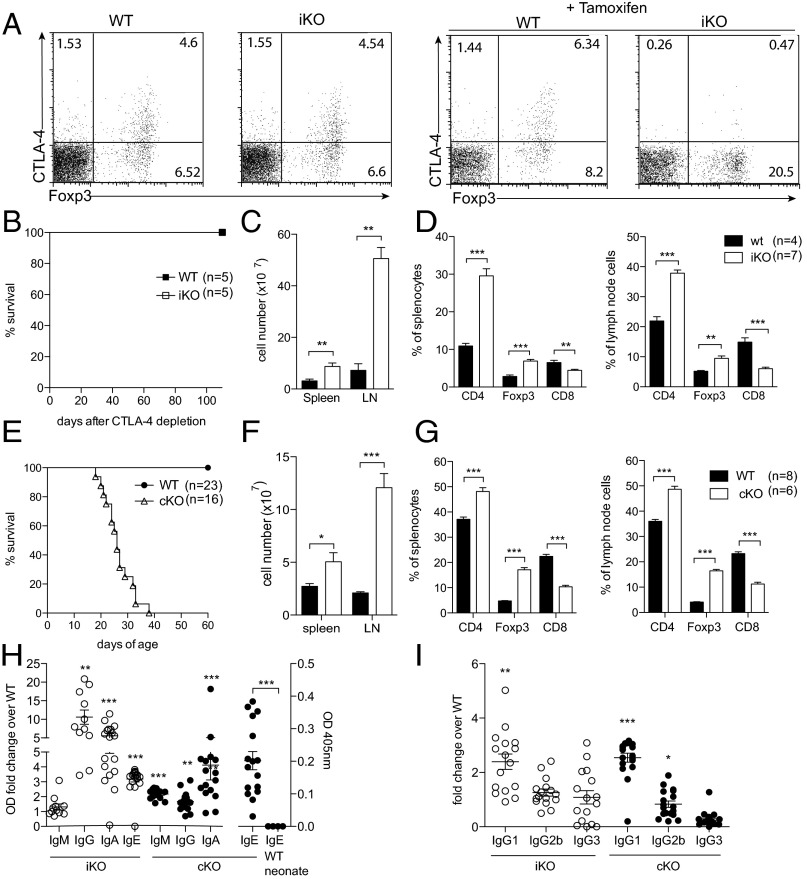
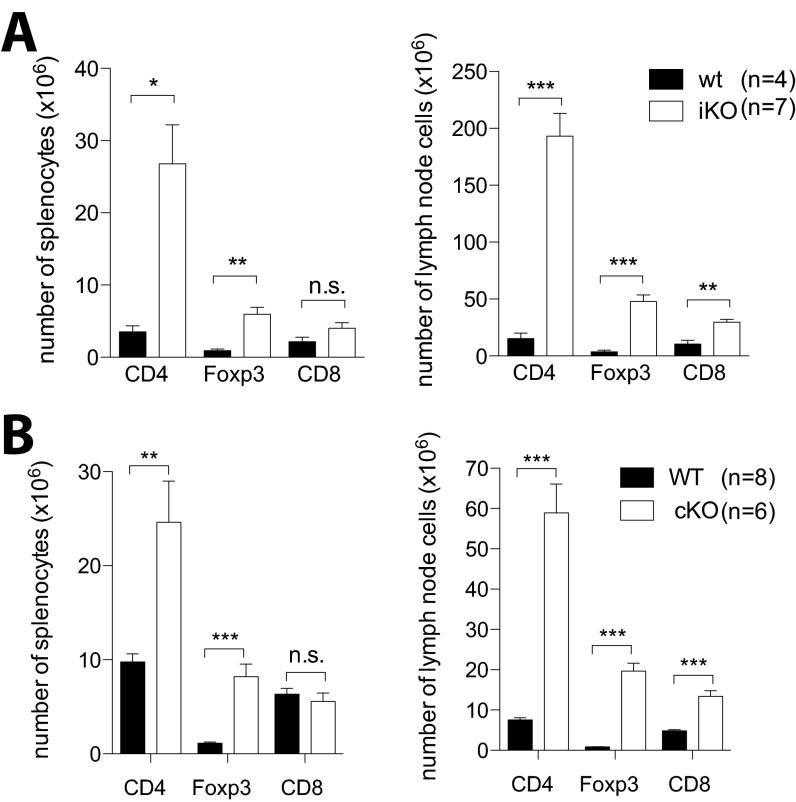
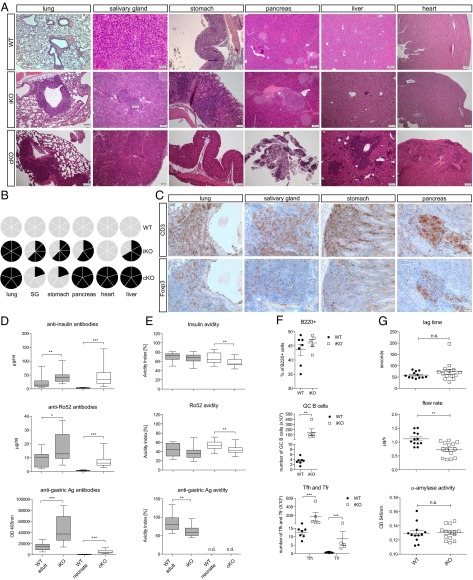
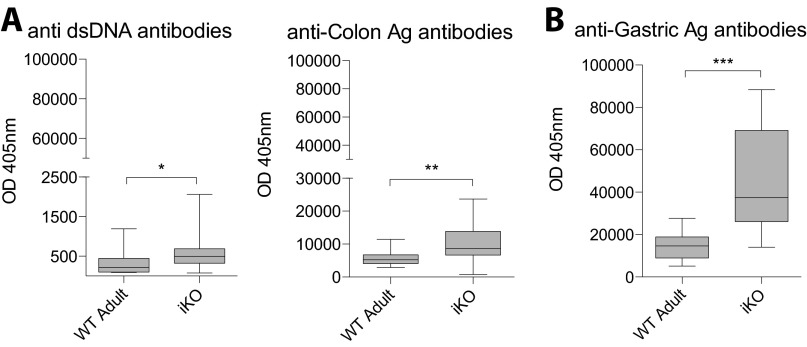
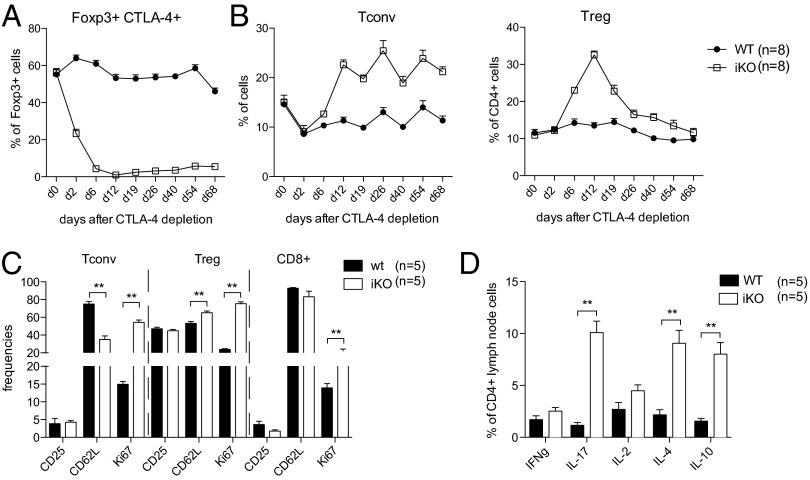
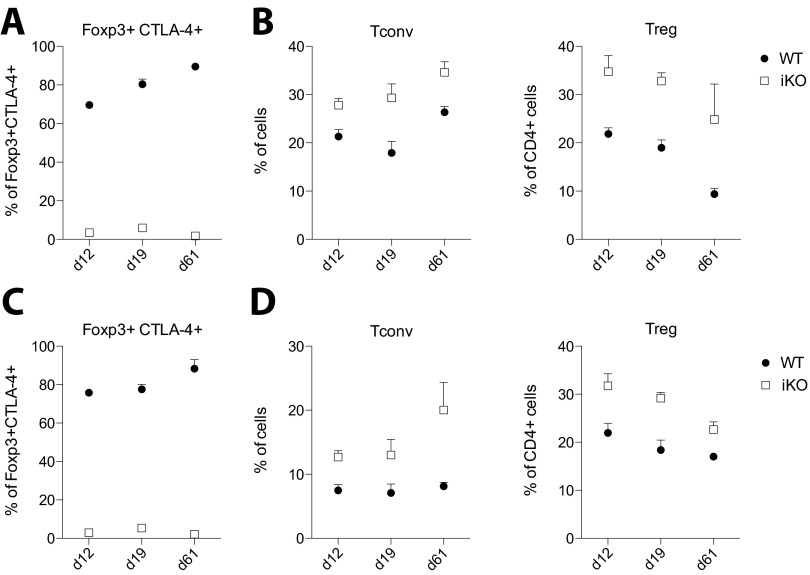
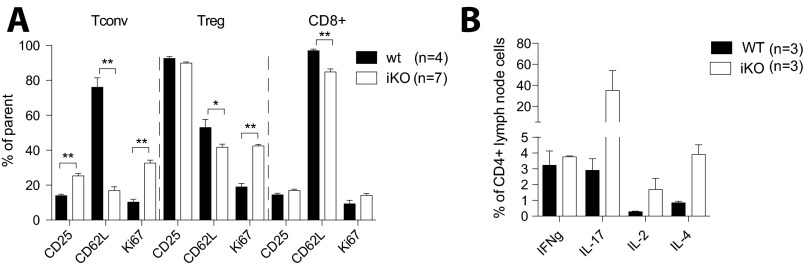
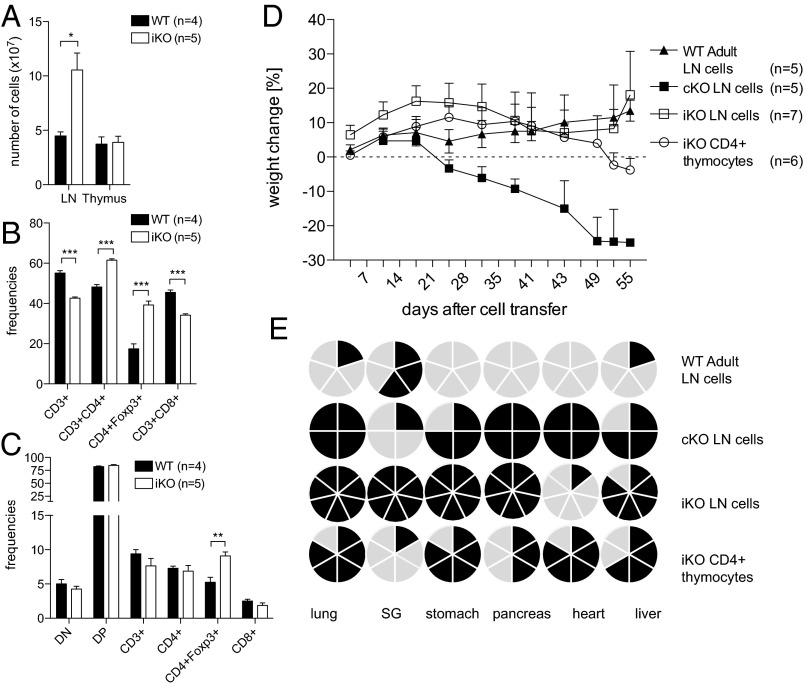
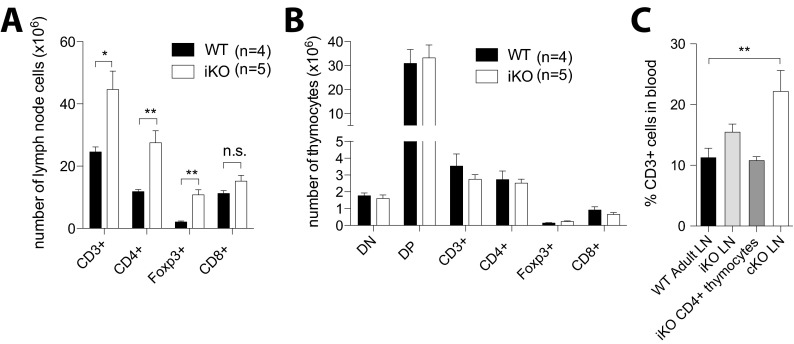
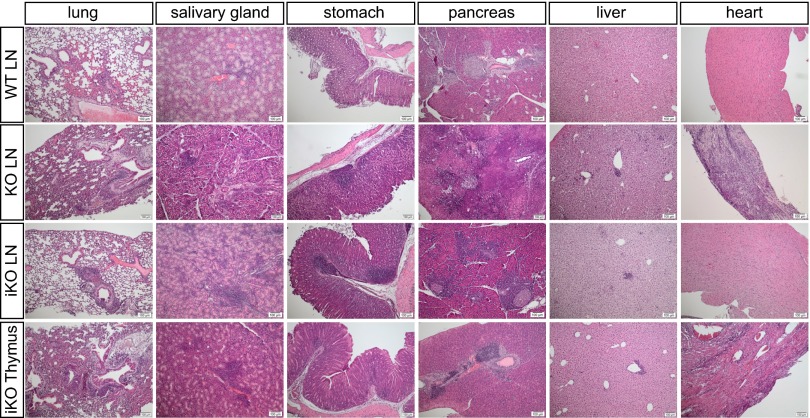
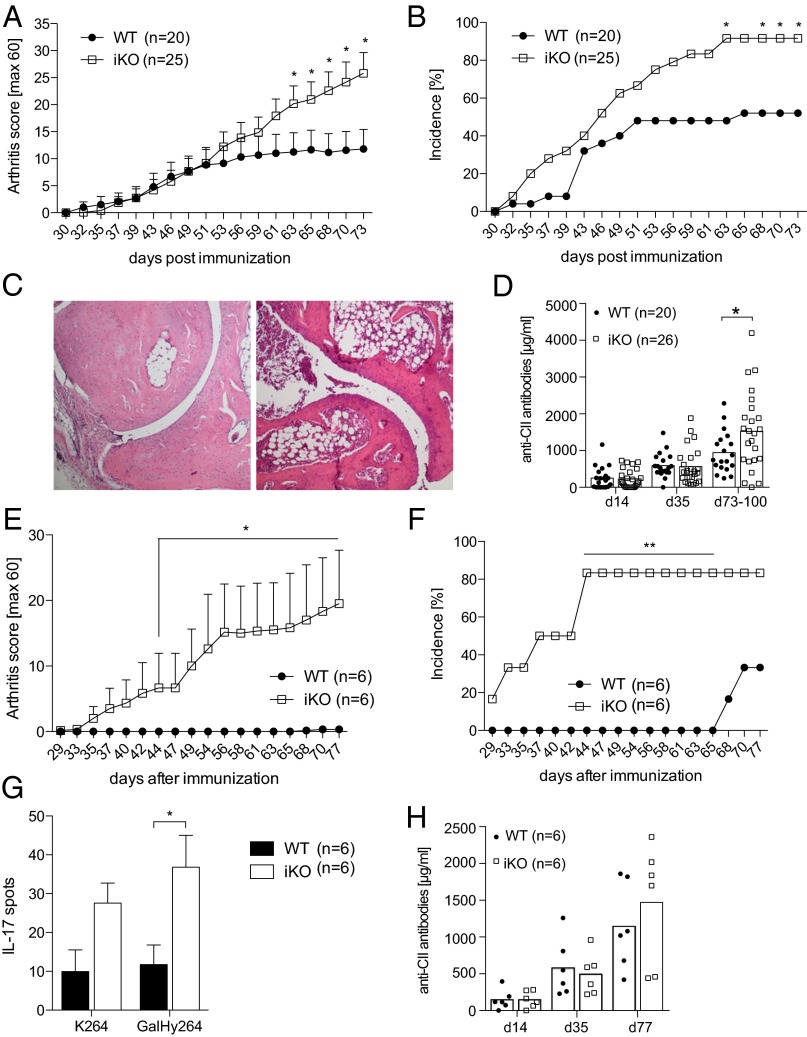
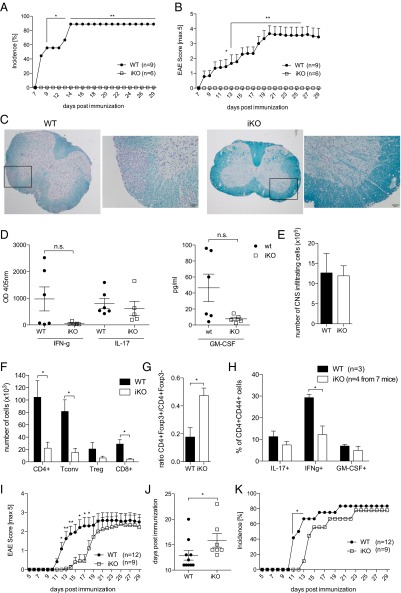
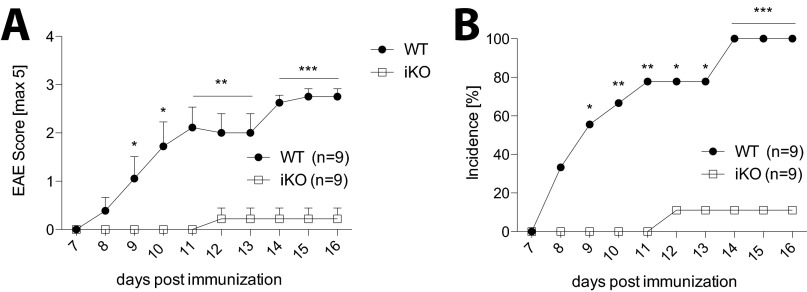
Cytotoxic T lymphocyte antigen-4 (CTLA-4) is essential for immunological (self-) tolerance, but due to the early fatality of CTLA-4 KO mice, its specific function in central and peripheral tolerance and in different systemic diseases remains to be determined. Here, we further examined the role of CTLA-4 by abrogating CTLA-4 expression in adult mice and compared the resulting autoimmunity that follows with that produced by congenital CTLA-4 deficiency. We found that conditional deletion of CTLA-4 in adult mice resulted in spontaneous lymphoproliferation, hypergammaglobulinemia, and histologically evident pneumonitis, gastritis, insulitis, and sialadenitis, accompanied by organ-specific autoantibodies. However, in contrast to congenital deficiency, this was not fatal. CTLA-4 deletion induced preferential expansion of CD4(+)Foxp3(+) Treg cells. However, T cells from CTLA-4-deficient inducible KO mice were able to adoptively transfer the diseases into T cell-deficient mice. Notably, cell transfer of thymocytes de novo produced myocarditis, otherwise not observed in donor mice depleted in adulthood. Moreover, CTLA-4 deletion in adult mice had opposing impacts on induced autoimmune models. Thus, although CTLA-4-deficient mice had more severe collagen-induced arthritis (CIA), they were protected against peptide-induced experimental autoimmune encephalomyelitis (EAE); however, onset of protein-induced EAE was only delayed. Collectively, this indicates that CTLA-4 deficiency affects both central and peripheral tolerance and Treg cell-mediated suppression.

Keywords: CTLA-4; Foxp3; autoimmunity; regulatory T cells; tolerance.


Conflict of interest statement

The authors declare no conflict of interest.

Figures

Fig. 1.
Fig. 1.
CTLA-4 deletion in adult mice produces lymphoproliferation and autoimmunity similar to congenital CTLA-4 deficiency. (A) Representative examples of CTLA-4 levels in WT and iKO mice before and after complete tamoxifen treatment day 6. (B) Survival of iKO mice and WT littermate controls after tamoxifen treatment. (C) Absolute cell numbers in spleen and lymph nodes of iKO and WT littermate controls 8 wk after CTLA-4 depletion. (D) Frequency of CD8+, CD4+, and Foxp3+ T-cell subsets in spleen and lymph nodes of iKO and WT mice after 8 wk of CTLA-4 depletion. (E) Survival of cKO mice and littermate controls after birth. (F) Absolute cell numbers in spleen and lymph nodes of 20- to 22-d-old cKO mice and WT littermate controls. (G) Frequency of CD8+, CD4+, and Foxp3+ T-cell subsets in spleen and lymph nodes of 20- to 22-d-old cKO mice and WT littermate controls. (H) Total IgM, IgG, IgE, and IgA levels in serum of cKO and iKO mice depicted as relative OD fold change over respective WT littermate control except for IgE in cKO mice depicted as OD only because it was not detectable in corresponding WT littermate controls. (I) IgG subclasses depicted as relative OD fold change over control. Error bars represent mean ± SEM. Differences were considered statistically significant with a P value of <0.05 (*), <0.01 (**), or <0.001 (***).
Fig. S1.
Fig. S1.
CTLA-4 deletion in adult mice produces lymphoproliferation and autoimmunity similar to congenital CTLA-4 deficiency. (A) Absolute numbers of CD4+, Foxp3+, and CD8+ T-cell subsets in spleen and lymph nodes of iKO and WT mice after 8 wk of CTLA-4 depletion. (B) Absolute numbers of CD4+, Foxp3+, and CD8+ T-cell subsets in spleen and lymph nodes of 20- to 22-d-old cKO mice and WT littermate controls. Error bars represent mean ± SEM. Differences were considered statistically significant with a P value of <0.05 (*), <0.01 (**), or <0.001 (***).
Fig. 2.
Fig. 2.
Spontaneous development of autoimmunity in iKO mice. (A) H&E stainings of representative organ sections of WT mice (Top; n = 6), iKO mice 8 wk after CTLA-4 depletion (Middle; n = 6), and cKO newborns at 16 d of age (Bottom; n = 5). (B) Cake diagrams depicting organ infiltrations in all WT (Top), iKO (Middle), and cKO (Bottom) mice. Each cake piece represents one mouse and filled pieces symbolize observed infiltrations. (C) Immunohistochemistry on representative paraffin sections from 8-wk depleted iKO mice stained with anti-CD3 (Upper) and anti-Foxp3 antibody (Lower). Sequential sections are shown and n = 6. (D) Total auto-antibody levels against insulin, Ro52, and gastric Ag in serum of 19- to 22-d-old cKO and >14-wk-old iKO mice and littermate controls. (E) Calculated avidity index of antibodies against insulin, Ro52, and gastric Ag. Tested serum was from 16- to 25-d-old cKO neonates (n = 16) and from 8- to 13-wk depleted iKO mice (n = 18) with age-matched littermate controls (n = 10 WT adult, n = 16 WT neonate). (F) Lag time, saliva flow rate, and amylase activity in iKO mice and WT controls after pilocarpine injection. (G) Frequency of B220+ B cells (Top), germinal center (GC) B cells (Middle), and T follicular helper (Tfh) and T follicular regulatory (Tfr) T cells (Bottom) in spleens of iKO mice and WT littermate controls 4 wk after CTLA-4 depletion. GC B cells were defined as B220+CD38PNA+, Tfh as CD19CD4+CXCR5+ICOS+Foxp3, and Tfr as CD19CD4+CXCR5+ICOS+Foxp3+. Error bars represent mean ± SEM. Differences were considered statistically significant with a P value of <0.05 (*), <0.01 (**), or <0.001 (***).
Fig. S2.
Fig. S2.
Spontaneous development of autoimmunity in iKO mice. (A) iKO mice do not suffer from lymphocytic infiltrations in kidneys or colon but total auto-antibody levels against dsDNA and colon Ag are elevated in serum of 8-wk depleted iKO mice compared with WT littermate controls (n = 10 WT adult, n = 18 iKO). As a comparison for the difference in titers between infiltrated vs. noninfiltrated organs, (B) auto-antibody levels against gastric Ag are shown. Error bars represent mean ± SEM. Differences were considered statistically significant with a P value of <0.05 (*), <0.01 (**), or <0.001 (***).
Fig. 3.
Fig. 3.
Activation of Treg and Tconv cells by CTLA-4 depletion in adulthood. (A) Frequency of CTLA-4+ Treg cells in blood of iKO and WT littermate controls before, during, and after depletion of CTLA-4. (B) Frequencies of Tconv (Left) and Foxp3+Treg cells (Right) in blood of iKO and WT littermate mice before, during, and after CTLA-4 depletion. (C) Flow cytometric analysis of T-cell activation markers in lymph nodes 1 wk after full CTLA-4 depletion in iKO mice and WT littermate controls. (D) Intracellular cytokine production by lymph node CD4+ T cells after stimulation with PMA/Ionomycin, 1 wk after full CTLA-4 depletion in iKO mice and WT littermate controls. Error bars represent mean ± SEM. Differences were considered statistically significant with a P value of <0.05 (*), <0.01 (**), or <0.001 (***).
Fig. S3.
Fig. S3.
Activation of Treg and Tconv cells by CTLA-4 depletion in adulthood. (A) Frequency of CTLA-4+ Treg cells in LN of iKO and WT littermate controls after depletion of CTLA-4. (B) Frequencies of Tconv cells (Left) and Foxp3+ Treg cells (Right) in LNs of iKO and WT littermate mice after CTLA-4 depletion. (C) Frequency of CTLA-4+ Treg cells in spleen of iKO and WT littermate controls after depletion of CTLA-4. (D) Frequencies of Tconv cells (Left) and Foxp3+Treg cells (Right) in spleen of iKO and WT littermate mice after CTLA-4 depletion. n = 3–5 mice per group and time point. Error bars represent mean ± SEM.
Fig. S4.
Fig. S4.
Gating strategy for gating of T-cell populations, activation markers, and cytokines.
Fig. S5.
Fig. S5.
Spontaneous T-cell activation in iKO mice after 8 wk of depletion. (A) Flow cytometric analysis of T-cell activation markers in lymph node 8 wk after full CTLA-4 depletion in iKO mice and littermate controls. (B) Intracellular cytokine production by lymph node CD4+ T cells after stimulation with PMA/Ionomycin, 8 wk after full CTLA-4 depletion in iKO mice and littermate controls. Error bars represent mean ± SEM. Differences were considered statistically significant with a P value of <0.05 (*), <0.01 (**), or <0.001 (***).
Fig. 4.
Fig. 4.
T-cell transfer into TCRβKO recipients recapitulates the distinct organ infiltration pattern seen in iKO and cKO donors. (A) Absolute cell numbers in lymph nodes and thymus in iKO donors and WT littermates 1 wk after loss of CTLA-4. Frequencies of T-cell subsets in lymph nodes (B) and thymus (C) of iKO and WT mice 1 wk after CTLA-4 depletion. (D) Weight change in percent of initial weight of TCRβKO recipients after i.v. cell transfer of 30 million total LN cells from either 16-d-old cKO neonates, >6-wk-old iKO donors, or 1.3–3.4 million purified CD4+ thymocytes from iKO donors. As a control, 30 million total LN cells from >4-wk-old WT littermate controls were transferred. (E) Cake diagrams depicting organ infiltrations in recipient mice. Each cake piece represents one mouse and filled pieces symbolize observed infiltrations. Error bars represent mean ± SEM. Differences were considered statistically significant with a P value of <0.05 (*), <0.01 (**), or <0.001 (***).
Fig. S6.
Fig. S6.
T-cell transfer into TCRβKO recipients recapitulates the distinct organ infiltration pattern seen in iKO and cKO donors. Absolute numbers of T-cell subsets in LNs (A) and thymus (B) of iKO and WT mice 1 wk after CTLA-4 depletion. (C) CD3 T-cell repopulation in blood of TCRβKO recipients 19 d after i.v. cell transfer of 30 million total LN cells from 16-d-old cKO neonates or 14 d after transfer of 30 million total LN cells from >6-wk-old iKO donors or 1.3–3.4 million purified CD4+ thymocytes from iKO donors. As a control, 30 million total LN cells from >4-wk-old WT littermate controls were transferred (n = 5–7 mice per group). Statistical comparisons were made against the WT adult LN group. Error bars represent mean ± SEM. Differences were considered statistically significant with a P value of <0.05 (*), <0.01 (**), or <0.001 (***).
Fig. S7.
Fig. S7.
Lymphocytic infiltrations in TCRβKO recipients 8 wk after transfer of iKO or cKO donor cells. H&E staining of representative paraffin-embedded organ sections of TCRbKO recipients 8 wk after i.v. transfer of 30 million total LN cells from either 16-d-old cKO neonates (second row), >7-wk-old iKO donors (third row), or 1.3–3.4 million purified CD4+ thymocytes from iKO donors (fourth row). As a control, 30 million total LN cells from >7-wk-old WT littermate controls were transferred (first row).
Fig. 5.
Fig. 5.
Depletion of CTLA-4 in adulthood enhances severity and susceptibility to collagen-induced arthritis. (A) Mean arthritis score and (B) incidence of iKO and littermate controls immunized with CII day 7 after tamoxifen treatment was initiated. Mice were boosted 35 d later. (C) Representative images of one WT (Left) and one iKO (Right) joint section stained with H&E, 25× magnification. (D) Total anticollagen antibody titers in serum. (E) Mean arthritis score and (F) incidence of iKO mice and littermate controls without booster immunization. (G) IL-17 T-cell response against CII259-273 peptides determined by ELISPOT from draining lymph node cells of immunized but not boosted mice with unmodified CII peptide (K264), CII peptide glactocylated on hydroxylysine at position 264 (GalHyK264), or Concaviline A (ConA). (H) Total anticollagen antibodies in serum of immunized but not boosted mice. A–D show data from three pooled independent experiments, and error bars represent mean ± SEM. Differences were considered statistically significant with a P value of <0.05 (*), <0.01 (**), or <0.001 (***).
Fig. 6.
Fig. 6.
Depletion of CTLA-4 in adulthood leads to resistance to MOG79–96 peptide but not MOG1–125 protein-induced EAE. (A) Clinical scores and (B) incidence of iKO mice and littermate controls immunized with MOG79–96 peptide day 7 after tamoxifen treatment was initiated. (C) Representative images of one WT (Left) and one iKO (Right) spinal cord section stained with Luxol Fast Blue and Cresyl violet, 25× magnification or 200× magnification for the depicted inlet. (D) Cytokine production in supernatants of purified and restimulated CD4+ T cells pooled from draining lymph nodes and spleen on day 36 of MOG79–96 EAE. (E) Absolute numbers of total CNS infiltrating cells. (F) Absolute numbers of CNS infiltrating CD4+, CD4+Foxp3 Tconv, CD4+Foxp3+ Treg, and CD8+ cells, (G) ratio of Tconv/Treg, and (H) intracellular cytokine production in iKO mice and littermate controls 14 d after EAE induction. (I) Clinical scores, (J) day of onset, and (K) incidence of MOG1-125 protein induced EAE in iKO mice and WT controls. A and B show a representative experiment of four independent experiments, and G–I show data from two pooled independent experiments. Error bars represent mean ± SEM. Differences were considered statistically significant with a P value of <0.05 (*), <0.01 (**), or <0.001 (***).
Fig. S8.
Fig. S8.
iKO mice are protected from MOG79-96 peptide EAE also when CTLA-4 is depleted 4 wk before disease induction. CTLA-4 was depleted in iKO mice, and 4 wk later, MOG79-96 peptide EAE was induced. With this scheme, iKO mice have a similar day of EAE disease onset after loss of CTLA-4 as in CIA. (A) Clinical scores and (B) incidence are shown. Error bars represent mean ± SEM. Differences were considered statistically significant with a P value of <0.05 (*), <0.01 (**), or <0.001 (***).

References

    1. Takahashi T, et al. Immunologic self-tolerance maintained by CD25(+)CD4(+) regulatory T cells constitutively expressing cytotoxic T lymphocyte-associated antigen 4. J Exp Med. 2000;192(2):303–310. - PMC - PubMed
    1. Rudd CE, Taylor A, Schneider H. CD28 and CTLA-4 coreceptor expression and signal transduction. Immunol Rev. 2009;229(1):12–26. - PMC - PubMed
    1. Thompson CB, Allison JP. The emerging role of CTLA-4 as an immune attenuator. Immunity. 1997;7(4):445–450. - PubMed
    1. Kuehn HS, et al. Immune dysregulation in human subjects with heterozygous germline mutations in CTLA4. Science. 2014;345(6204):1623–1627. - PMC - PubMed
    1. Schubert D, et al. Autosomal dominant immune dysregulation syndrome in humans with CTLA4 mutations. Nat Med. 2014;20(12):1410–1416. - PMC - PubMed

Publication types