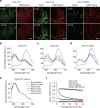
. 2016 Apr 13:7:11221.
doi: 10.1038/ncomms11221.

Augmenting drug-carrier compatibility improves tumour nanotherapy efficacy

Affiliations

Augmenting drug-carrier compatibility improves tumour nanotherapy efficacy

Yiming Zhao et al. Nat Commun. .

Abstract

A major goal of cancer nanotherapy is to use nanoparticles as carriers for targeted delivery of anti-tumour agents. The drug-carrier association after intravenous administration is essential for efficient drug delivery to the tumour. However, a large number of currently available nanocarriers are self-assembled nanoparticles whose drug-loading stability is critically affected by the in vivo environment. Here we used in vivo FRET imaging to systematically investigate how drug-carrier compatibility affects drug release in a tumour mouse model. We found the drug's hydrophobicity and miscibility with the nanoparticles are two independent key parameters that determine its accumulation in the tumour. Next, we applied these findings to improve chemotherapeutic delivery by augmenting the parent drug's compatibility; as a result, we achieved better antitumour efficacy. Our results help elucidate nanomedicines' in vivo fate and provide guidelines for efficient drug delivery.


Figures
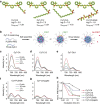
Figure 1
Figure 1. Cy7-X model drugs release in serum from Cy5.5-NP:Cy7-X FRET nanoparticles.
(a) Chemical structures of Cy7-X (X=CA, C12, OLA and PLGA2k) with hydrophobic segments presented in green and hydrophilic ones in red. The Cy7-X molecule's overall hydrophobicity (log D) and miscibility (χdrug-poly) in PLGA matrix were modified by varying the tail part X. (b) Schematic showing Cy5.5-NP:Cy7-X FRET nanoparticle formed through self-assembly of PLGA(blue)–PEG(grey) block copolymer and Cy5.5(green)-conjugated PLGA in the presence of Cy7-X (red). FRET is achieved when Cy7-X associated with particle and reduced when Cy7-X is released. (cg) Emission spectra of Cy5.5-NP:Cy7-X and Cy5.5-Cy7-NP incubated with FBS at 37 °C after indicated times. The significant differences in release rates observed for different model drugs are displayed in h. int., intensity; Norm., normalized.
Figure 2
Figure 2. In vitro drug release dynamics of Cy5.5-NP:Cy7-X in serum.
(a) A typical measurement of release dynamics, determined by recording time-dependent fluorescence in Cy5.5 channel (red circles, λExc=620 nm and λEmi=700 nm) and FRET channel (blue circles, λExc=620 nm and λEmi=780 nm). The normalized (Norm.) FRET/Cy5.5 intensity (int.) ratio (black solid dots) represents the amount of Cy7-X still associated with nanoparticles. Arrows indicate the corresponding y axes. (bd) FBS concentration (b,c) and temperature (c,d) affects release rate. Data are fitted with a two-compartment decay model (black curves). (e) FPLC analysis of Cy7-X distribution in incubation mixtures of FBS and Cy5.5-NP:Cy7-X. Chromatograms of the FBS reference (ref.) and Cy7-X were recorded through absorbance at 250 and 760 nm, respectively. (fh) Release dynamics of Cy5.5-NP:Cy7-X mixed with selected single-plasma protein solutions: albumin (f); γ-globulin (g); and high-density lipoprotein (HDL) (h).
Figure 3
Figure 3. Computer simulations on drug–nanoparticle interactions and predictions of drug-loading positions.
(a) Schematic illustration of the SMD simulations. A three-phase model system was constructed to simulate the environment of the drug molecules in a colloidal PLGA–PEG micelle. From the top to bottom the phases are as follows: water (blue); hydrated PEG (grey); and PLGA (green). Different Phe-X (X=CA, C12, OLA and PLGA2k) model drugs (red dot) were steered by a force F (black arrow) progressing along the Z-coordinate to visit all three phases. (b) The molecular structures (in space-filling renderings) of the four Cy7-X analogues. (c) Snapshots of the simulated systems. The Phe-CA compound (orange) is depicted as it moves along the water (left), the PEG (middle) and the PLGA (right) phase. Oxygen atoms (red), PLGA carbons (green), PEG carbon (grey) and water oxygen atoms (cyan). (d,e) Results from the SMD simulations. The forces applied on the Phe-X along the designed pathway (Z-coordinate) are plotted against the position (e), with the different phases indicated by the same colour scheme as in a. The solid lines, meant to guide the eye, are obtained through adjacent-averaging method. The distributions of the force values in each phase are displayed on top of the panels using the same colour code (d). Possible loading positions for each drug model are indicated in the nanoparticle schematics in d.
Figure 4
Figure 4. Intravital microscopy investigation of drug release dynamics in the vasculature.
Window chamber mice were injected intravenously with Cy3.5-NP:Cy5-X (X=C12, OLA and PLGA2k) FRET and Cy3.5-NP non-FRET control nanoparticles and continuously observed for 1 h. (a) Representative images of Cy3.5 channel (green) and FRET/Cy3.5 ratio (red) at 2 and 40 min post injection. Scale bars, 100 μm. (be) Emission spectra of Cy3.5-NP/Cy5-X in the vasculature, at selected post-injection times. The legend in e applies to be. (f) The drug release dynamics in circulation were measured via spectral imaging. The FRET/Cy3.5 intensity ratio is normalized to the value before injection. Dotted lines are for vision guidance.
Figure 5
Figure 5. Accumulation and subsequent drug release of Cy5.5-NP:Cy7-X in tumour.
(a) Representative NIRF images obtained at selected post-injection times in three optical channels: Cy5.5 (λExc=640 nm and λEm=720 nm); Cy7 (λExc=745 nm and λEm=800 nm); and FRET (λExc=640 nm and λEm=800 nm). The right flank tumours are indicated with arrows. The units are radiant efficiency (p s−1 cm−2 sr−1)/(μW cm−2). (bd) The mean intensities from the tumour area (n=8 mice per group) in the Cy5.5 channel (b), the Cy7 channel (c) and FRET/Cy5.5 intensity ratios (d) are plotted against post-injection time. (e,f) The biodistribution (n=3) of Cy5.5-NP/Cy7-X in tumour and major organs at 24 h post injection, as evaluated by Cy5.5 tissue concentration (representing Cy5.5-NP carrier particles concentration) (e) and Cy7 tissue concentration (representing Cy7-X model drug concentration) (f). Data are shown as mean±s.d. *P<0.01, **P<0.001 using a Mann–Whitney test. (g) Correlations between Cy5.5 and Cy7 concentrations in tumour tissues samples (n=3) at 24 h post injection. Dotted lines are the linear fits with R2 values given in the plot.
Figure 6
Figure 6. A guideline for efficient drug delivery and its application to doxorubicin nanoparticle therapy.
(a) Schematic showing that hydrophobicity (log D) and miscibility with the PLGA matrix (χdrug-poly) are two independent parameters that determine the drug's release rate in the circulation. Drugs with properties located in the red area release quickly and those in the blue area release slowly. The scales are arbitrary. White arrows indicate the direction for modifying a parent drug for more efficient drug delivery. (b) The pro-drug approach for doxorubicin. In an acidic environment (pH <5), Dox-C4, Dox-C18 and Dox-PLA2k hydrazones will hydrolyse to generate free doxorubicin. (c) Doxorubicin concentrations in tumour tissues at 24 h post injection. Three groups of mice (n=3–4) were administered NP:Dox-X (X=C4, C18 and PLA2k) at 20 mg doxorubicin equivalent per kg BW. Data are means±s.d. P values were calculated with the nonparametric Kruskal–Wallis test and Dunn's nonparametric comparison for post hoc testing. *P<0.01, **P<0.001. (d,e) Therapeutic study with Dox-X nanoparticles. Mice (n=8–9) bearing 4T1 tumours were injected with NP:Dox-X at 10 mg doxorubicin equivalent per kg BW or PBS control on days 0, 3 and 6. (d) Relative tumour volume up to 18 days post treatment. Data are means±s.e.m. *For values at day 10, P values were calculated with the nonparametric Kruskal–Wallis test (P=0.001) and Dunn's nonparametric comparison for post hoc testing, P=0.002 for Dox-PLA2k versus PBS, P=0.011 for Dox-PLA2k versus Dox-C4. (e) Cumulative mouse survival. *P=0.03 for Dox-C18 versus PBS, **P=0.0001 for Dox-PLA2k versus PBS, using a Log-rank (Mantel–Cox) test.

References

    1. Schroeder A. et al.. Treating metastatic cancer with nanotechnology. Nat. Rev. Cancer 12, 39–50 (2012). - PubMed
    1. Davis M. E., Chen Z. & Shin D. M. Nanoparticle therapeutics: an emerging treatment modality for cancer. Nat. Rev. Drug Discov. 7, 771–782 (2008). - PubMed
    1. Nie S., Xing Y., Kim G. J. & Simons J. W. Nanotechnology applications in cancer. Annu. Rev. Biomed. Eng. 9, 257–288 (2007). - PubMed
    1. Torchilin V. P. Multifunctional, stimuli-sensitive nanoparticulate systems for drug delivery. Nat. Rev. Drug Discov. 13, 813–827 (2014). - PMC - PubMed
    1. Bartlett D. W., Su H., Hildebrandt I. J., Weber W. A. & Davis M. E. Impact of tumour-specific targeting on the biodistribution and efficacy of siRNA nanoparticles measured by multimodality in vivo imaging. Proc. Natl Acad. Sci. USA 104, 15549–15554 (2007). - PMC - PubMed

Publication types