Comparative Study
. 2017 Feb;475(2):336-350.
doi: 10.1007/s11999-016-4815-2.

The John Charnley Award: Redefining the Natural History of Osteoarthritis in Patients With Hip Dysplasia and Impingement

Affiliations
Comparative Study

The John Charnley Award: Redefining the Natural History of Osteoarthritis in Patients With Hip Dysplasia and Impingement

Cody C Wyles et al. Clin Orthop Relat Res. 2017 Feb.

Abstract

Background: Structural hip deformities including developmental dysplasia of the hip (DDH) and femoroacetabular impingement (FAI) are thought to predispose patients to degenerative joint changes. However, the natural history of these malformations is not clearly delineated.

Questions/purposes: (1) Among patients undergoing unilateral THA who have a contralateral hip without any radiographic evidence of hip disease, what is the natural history and progression of osteoarthritis in the native hip based on morphological characteristics? (2) Among patients undergoing unilateral THA who have a contralateral hip without any radiographic evidence of hip disease, what are the radiographic parameters that predict differential rates of degenerative change?

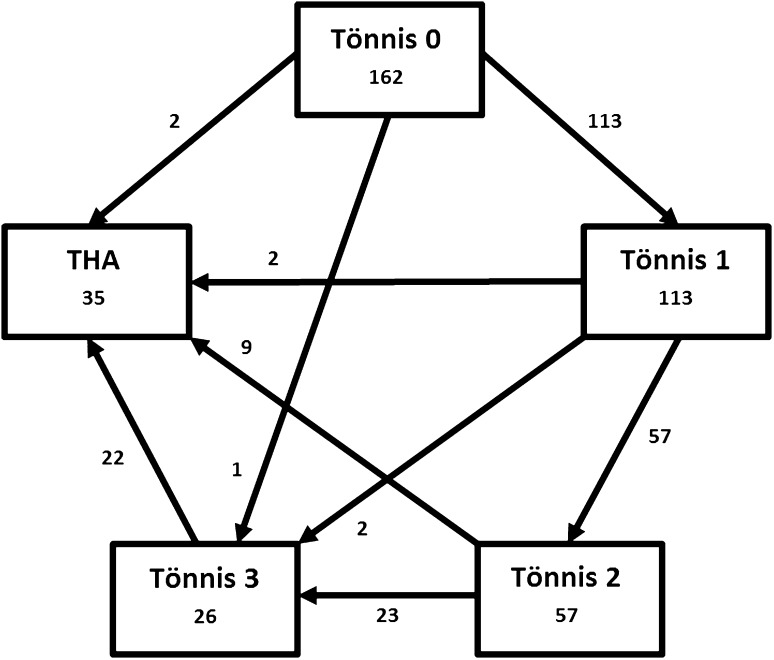
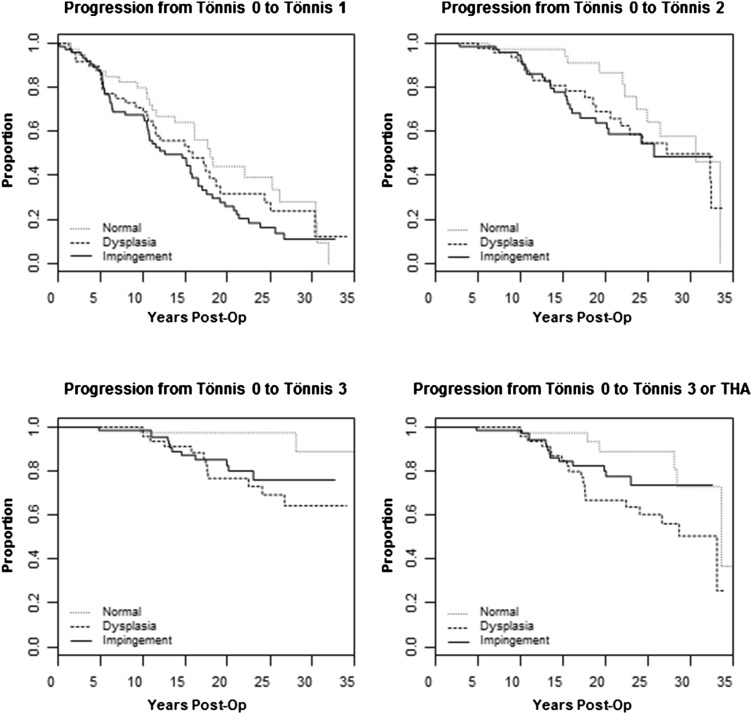
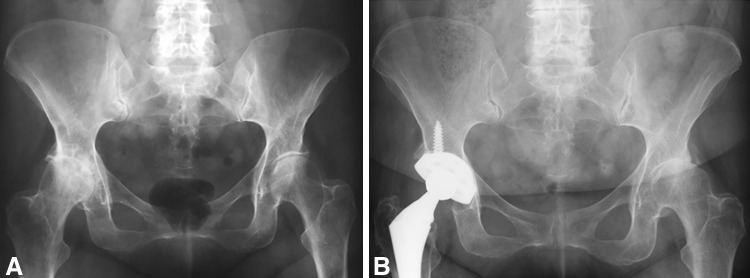
Methods: We identified every patient 55 years of age or younger at our institution who received unilateral primary THA from 1980 to 1989 (n = 722 patients). Preoperative radiographs were reviewed on the contralateral hip and only hips with Tönnis Grade 0 degenerative change that had minimum 10-year radiographic followup were included. A total of 172 patients met all eligibility criteria with the following structural diagnoses: 48 DDH, 74 FAI, and 40 normal morphology, and an additional 6% (10 of the 172 patients) met all eligibility criteria but were lost to followup before the 10-year minimum. Mean age at the time of study inclusion was 47 years (range, 18-55 years), and 56% (91 of 162) of the patients in this study were female. Mean followup was 20 years (range, 10-35 years). Radiographic metrics, in conjunction with the review of two experienced arthroplasty surgeons, determined the structural hip diagnosis as DDH, FAI, or normal morphology. Every available followup AP radiograph was reviewed to determine progression from Tönnis Grade 0 to 3 until the time of last followup or operative intervention with THA. Survivorship was analyzed by Kaplan-Meier methodology, hazard ratios, and multistate modeling. Thirty-five patients eventually underwent THA: 16 (33%) DDH, 13 (18%) FAI, and six (15%) normal morphology.

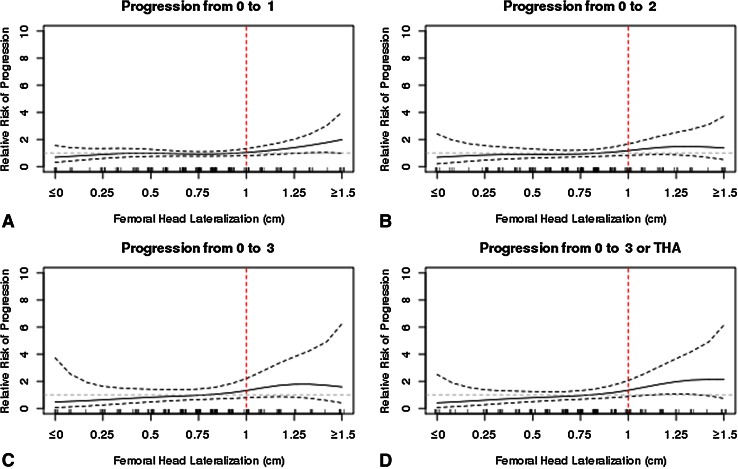
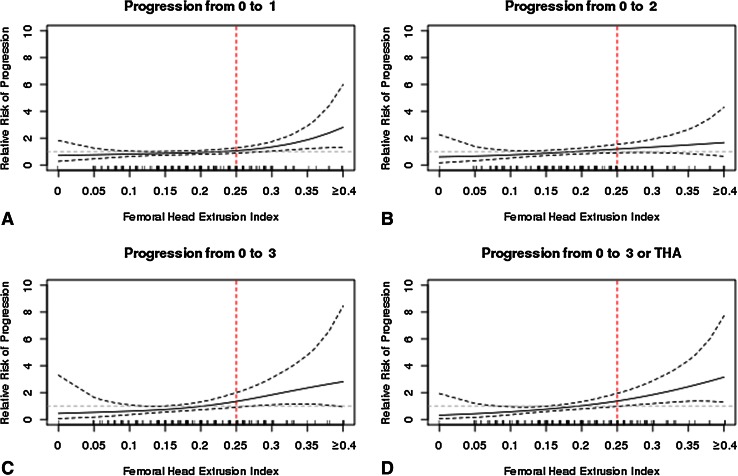
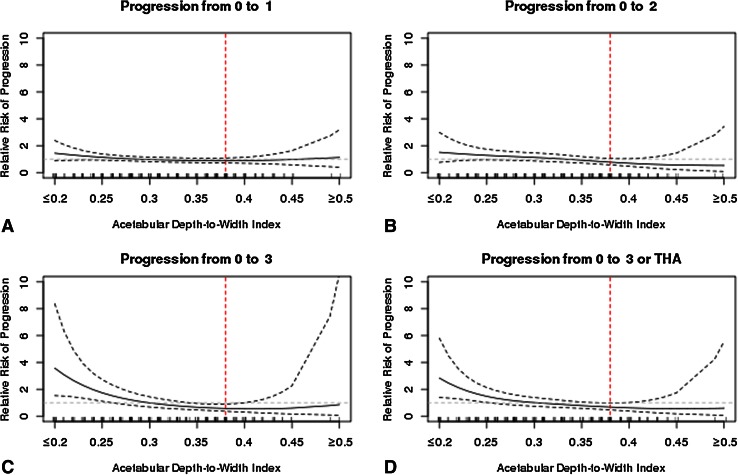
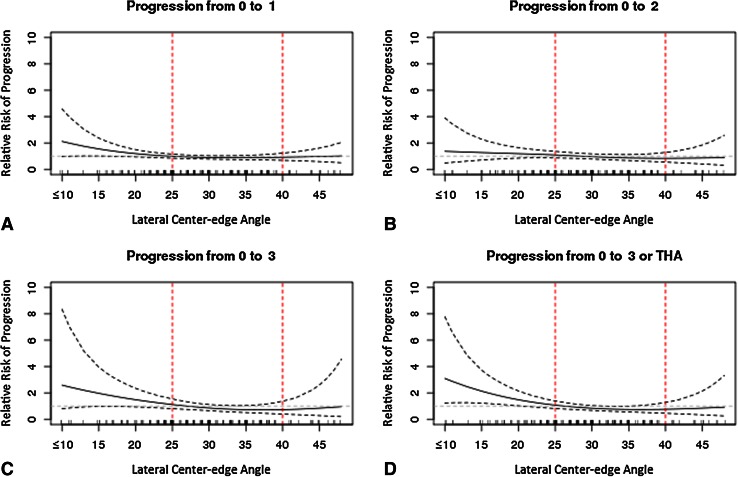
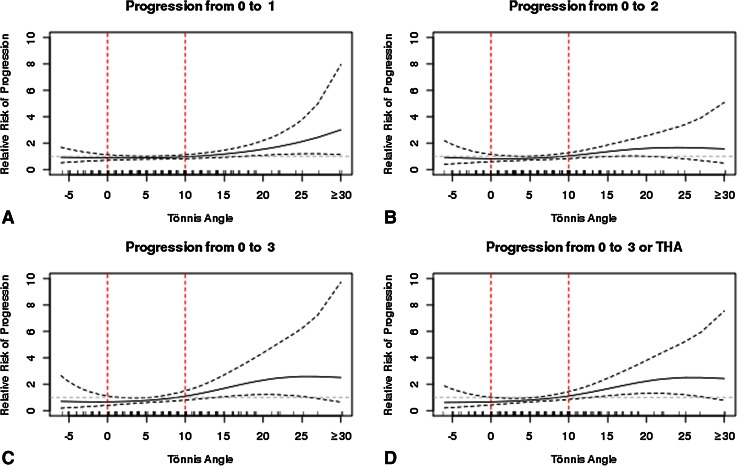
Results: Degenerative change was most rapid in patients with DDH followed by FAI and normal morphology. Among patients who recently developed Tönnis 1 degenerative change, the probability of undergoing THA in 10 years based on hip morphology was approximately one in three for DDH and one in five for both FAI and normal morphology hips, whereas the approximate probability at 20 years was two in three for DDH and one in two for both FAI and normal morphology hips. The likelihood of radiographic degeneration was increased in patients with the following findings: femoral head lateralization > 8 mm, femoral head extrusion index > 0.20, acetabular depth-to-width index < 0.30, lateral center-edge angle < 25°, and Tönnis angle > 8°.

Conclusions: Degenerative change occurred earliest in patients with DDH, whereas the natural history of patients with FAI was quite similar to structurally normal hips. However, patients with cam deformities and concomitant acetabular dysplasia developed osteoarthritis more rapidly. Although the results of this study cannot be directly correlated to highly active patients with FAI, these findings suggest that correction of FAI to a normal morphology may only minimally impact the natural history, especially if intervention takes place beyond Tönnis 0. Analysis of radiographic parameters showed that incremental changes toward dysplastic morphology increase the risk of degenerative change.

Level of evidence: Level III, prognostic study.


Figures

Fig. 1
Fig. 1
This diagram summarizes all 162 patients in the study and their observed transitions through the various stages of degenerative change over long-term followup. These transitions served as the basis for subsequent multistate Markov modeling.
Fig. 2
Fig. 2
These Kaplan-Meier (KM) plots demonstrate native hip survival by hip morphology. In general, patients with DDH progressed most rapidly followed by FAI with normal morphology hips progressing the slowest. This did not reach significance at early stages; however, patients with dysplasia had significantly worse survival compared with structurally normal morphology hips from Tönnis 0 to Tönnis 3 and Tönnis 0 to Tönnis 3 or THA.
Fig. 3A–B
Fig. 3A–B
These AP pelvis radiographs show a typical study patient with developmental dysplasia of the left hip. (A) This film is a preoperative radiograph for the right hip at the time of study inclusion when the patient still has Tönnis 0 degenerative change in the left hip. (B) This subsequent radiograph is taken 18 years later at which point the left hip has developed Tönnis 3 degenerative change.
Fig. 4A–D
Fig. 4A–D
This plot shows femoral head lateralization in a continuous fashion to describe the impact on risk of hip degeneration in the overall cohort. The horizontal dashed lines show a relative risk of 1. The red vertical dashed line at 1 cm shows the common cutoff for a morphological diagnosis of DDH (> 1 cm) versus normal morphology (< 1 cm) hips. The curvilinear solid line demonstrates the relative risk of degeneration as a function of femoral head lateralization. The curvilinear dashed lines represent the 95% CI of the relative risk. Risk of degeneration increases above 8 mm of femoral head lateralization.
Fig. 5A–D
Fig. 5A–D
This plot shows femoral head extrusion index in a continuous fashion to describe the impact on risk of hip degeneration in the overall cohort. The horizontal dashed lines show a relative risk of 1. The red vertical dashed line at 0.25 shows the common cutoff for a morphological diagnosis of DDH (> 0.25) versus normal morphology (< 0.25) hips. The curvilinear solid line demonstrates the relative risk of degeneration as a function of femoral head extrusion index. The curvilinear dashed lines represent the 95% CI of the relative risk. Risk of degeneration increases above a femoral head extrusion index of 0.20.
Fig. 6A–D
Fig. 6A–D
This plot shows acetabular depth-to-width index in a continuous fashion to describe the impact on risk of hip degeneration in the overall cohort. The horizontal dashed lines show a relative risk of 1. The red vertical dashed line at 0.38 shows the common cutoff for a morphological diagnosis of DDH (< 0.38) versus normal morphology (> 0.38) hips. The curvilinear solid line demonstrates the relative risk of degeneration as a function of acetabular depth-to-width index. The curvilinear dashed lines represent the 95% CI of the relative risk. Risk of degeneration increases below an acetabular depth-to-width index of 0.30.
Fig. 7A–D
Fig. 7A–D
This plot shows lateral center-edge angle in a continuous fashion to describe the impact on risk of hip degeneration in the overall cohort. The horizontal dashed lines show a relative risk of 1. The red vertical dashed lines at 25° and 40° show the common cutoffs for a morphological diagnosis of DDH (< 25°) versus normal morphology (25°–40°) versus FAI (> 40°) hips. The curvilinear solid line demonstrates the relative risk of degeneration as a function of lateral center-edge angle. The curvilinear dashed lines represent the 95% CI of the relative risk. Risk of degeneration increases below a lateral center-edge angle of 25°.
Fig. 8A–D
Fig. 8A–D
This plot shows Tönnis angle in a continuous fashion to describe the impact on risk of hip degeneration in the overall cohort. The horizontal dashed lines show a relative risk of 1. The red vertical dashed lines at 0° and 10° show the common cutoffs for a morphological diagnosis of FAI (< 0°) versus normal morphology (0°–10°) versus DDH (> 10°) hips. The curvilinear solid line demonstrates the relative risk of degeneration as a function of Tönnis angle. The curvilinear dashed lines represent the 95% CI of the relative risk. Risk of degeneration increases above a Tönnis angle of 8°.

Comment in

References

    1. Allen D, Beaule PE, Ramadan O, Doucette S. Prevalence of associated deformities and hip pain in patients with cam-type femoroacetabular impingement. J Bone Joint Surg Br. 2009;91:589–594. doi: 10.1302/0301-620X.91B5.22028. - DOI - PubMed
    1. Bardakos NV, Villar RN. Predictors of progression of osteoarthritis in femoroacetabular impingement: a radiological study with a minimum of ten years follow-up. J Bone Joint Surg Br. 2009;91:162–169. doi: 10.1302/0301-620X.91B2.21137. - DOI - PubMed
    1. Beck M, Kalhor M, Leunig M, Ganz R. Hip morphology influences the pattern of damage to the acetabular cartilage: femoroacetabular impingement as a cause of early osteoarthritis of the hip. J Bone Joint Surg Br. 2005;87:1012–1018. doi: 10.1302/0301-620X.87B7.15203. - DOI - PubMed
    1. Chegini S, Beck M, Ferguson SJ. The effects of impingement and dysplasia on stress distributions in the hip joint during sitting and walking: a finite element analysis. J Orthop Res. 2009;27:195–201. doi: 10.1002/jor.20747. - DOI - PubMed
    1. Clohisy JC, Carlisle JC, Beaule PE, Kim YJ, Trousdale RT, Sierra RJ, Leunig M, Schoenecker PL, Millis MB. A systematic approach to the plain radiographic evaluation of the young adult hip. J Bone Joint Surg Am. 2008;90(Suppl 4):47–66. doi: 10.2106/JBJS.H.00756. - DOI - PMC - PubMed

Publication types

MeSH terms