Review
. 2016 Jul;7(4):512-26.
doi: 10.1002/wrna.1349. Epub 2016 Apr 12.

SAXS studies of RNA: structures, dynamics, and interactions with partners

Affiliations
Review

SAXS studies of RNA: structures, dynamics, and interactions with partners

Yujie Chen et al. Wiley Interdiscip Rev RNA. 2016 Jul.

Abstract

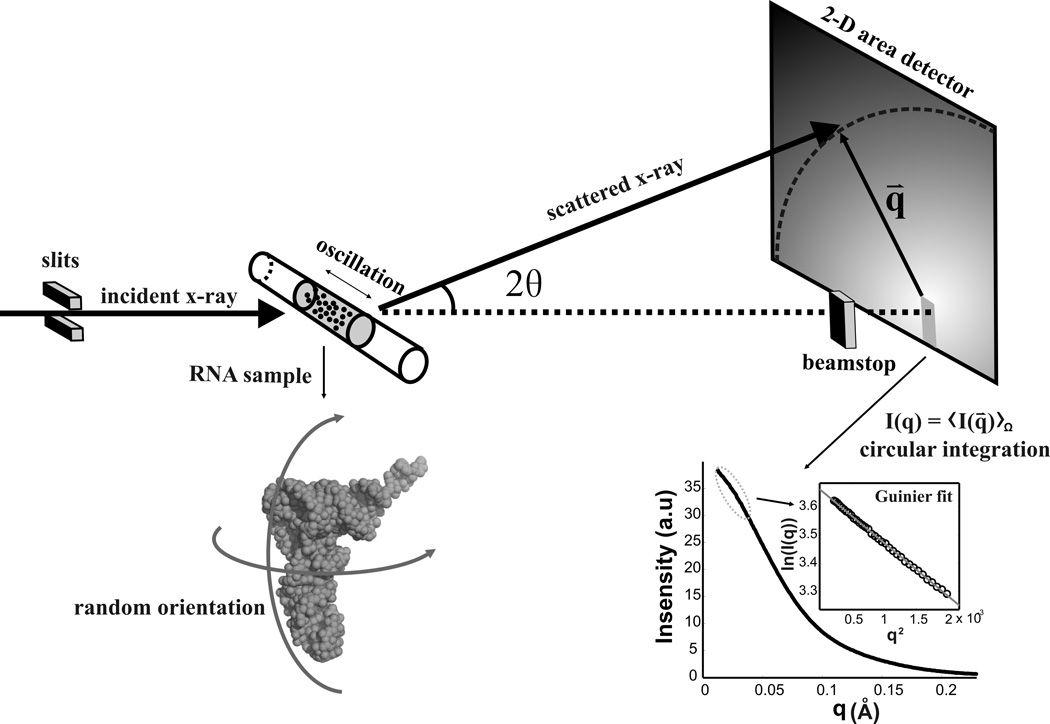
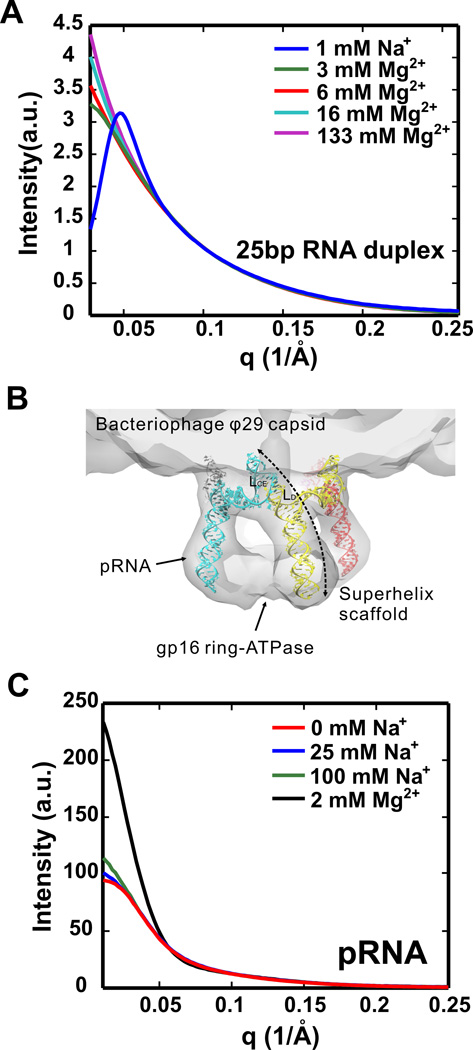
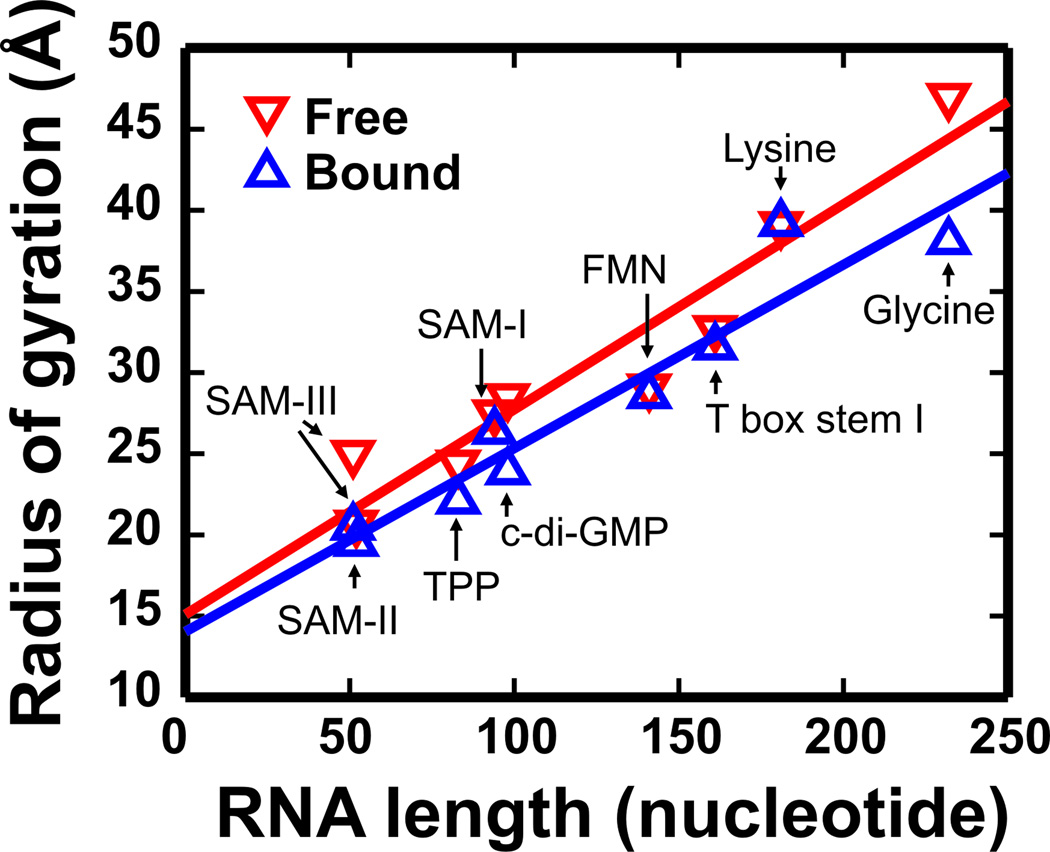
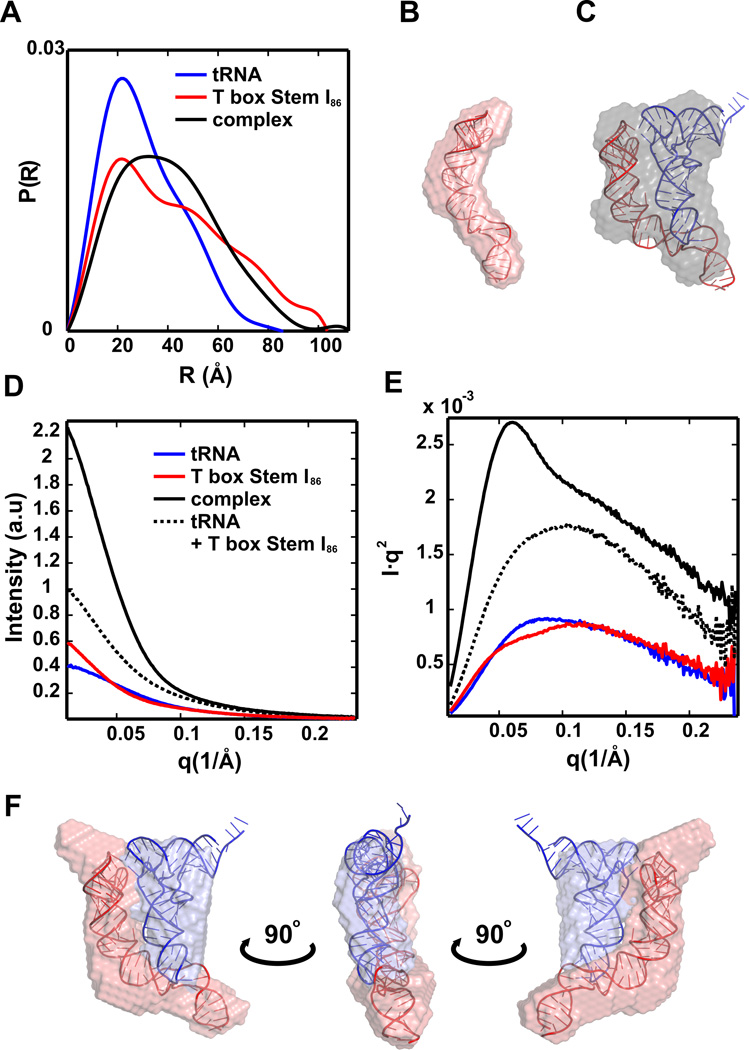
Small-angle X-ray scattering, SAXS, is a powerful and easily employed experimental technique that provides solution structures of macromolecules. The size and shape parameters derived from SAXS provide global structural information about these molecules in solution and essentially complement data acquired by other biophysical methods. As applied to protein systems, SAXS is a relatively mature technology: sophisticated tools exist to acquire and analyze data, and to create structural models that include dynamically flexible ensembles. Given the expanding appreciation of RNA's biological roles, there is a need to develop comparable tools to characterize solution structures of RNA, including its interactions with important biological partners. We review the progress toward achieving this goal, focusing on experimental and computational innovations. The use of multiphase modeling, absolute calibration and contrast variation methods, among others, provides new and often unique ways of visualizing this important biological molecule and its essential partners: ions, other RNAs, or proteins. WIREs RNA 2016, 7:512-526. doi: 10.1002/wrna.1349 For further resources related to this article, please visit the WIREs website.


Figures

Figure 1
Figure 1
Schematic of a SAXS experiment. The top panel represents a typical SAXS setup at the G1 station of Cornell’s High Energy Synchrotron Source (CHESS). An incident x-ray beam is collimated using 2 (or more) sets of slits, then passes through a quartz capillary that contains a plug of diluted sample solution. The solutes are schematically shown as black dots in the upper panel; they are magnified in the lower left panel. To minimize radiation damage, the sample is oscillated during the exposure. X-rays scattered by the sample are captured by a 2 dimensional area detector. The isotropic scattering pattern arises from the random orientation of the RNA in solution. A beamstop blocks the direct beam to avoid detector damage. The scattering intensity is integrated at each angle to produce a 1 dimensional Intensity vs. q curve. As an example, the scattering profile of tRNA, the structure shown in the lower left panel, is plotted in the lower right panel. As described in the text, its radius of gyration can be readily computed from a linear fit to the low q (or Guinier) region of this curve plotted as ln(I(q)) vs. q2 in the inset.
Figure 2
Figure 2
Effects of counterions on RNA. (A) SAXS profiles of 25 bp RNA duplexes at different Mg2+ concentrations. These curves have been normalized by [RNA] to enable a comparison of their shapes. The profile measured at low salt without Mg2+ yields a sharp ‘downturn’ at the lowest q, indicating strong repulsive inter-particle interactions. The peak reflects the mean separation between highly charged duplexes in solution. As the [Mg2+] increases, the intensity rises at the lowest q. At first this increase signals decreasing repulsion; at higher [Mg2+] the continued increase reflects end-to-end association of RNA duplexes. (B) Side view of a pRNA pentameric ring superimposed with the cryo-EM envelopes of the pRNA and the pRNA-bound gp16 ATPase , in a functional structure. The construction of the pentamer is mediated by base pairing between the Lce and Ld loops of adjacent pRNA mononers, forming 5 superhelix scaffolds. (C) SAXS profiles of pRNA in solutions with varying salts. In Na+, SAXS profiles of dilute solutions of pRNA demonstrate weak repulsive interactions between monomers. The dramatic increase in the signal at low q, when 2mM Mg2+ is added, suggests strong intermolecular interactions between pRNA monomers.
Figure 3
Figure 3
SAXS analysis of Riboswitches. The radius of gyration (Rg) of free (red) and ligand-bound riboswitches (blue) is plotted as a function of RNA length. In all samples, Mg2+ is present. A linear least square fit to these two data sets shows a nearly monotonic relationship between the size and length of the riboswitches. The two separated straight lines also show that the ligand-bound riboswitches are in general more compact than the free riboswitches. The Rgs of T box stem I was measured in our lab and reported in Ref. (60). The Rgs of other riboswitches are from Table 1 in Ref. (40).
Figure 4
Figure 4
SAXS analysis of T box RNA – tRNA complex. (A) Pair distance distribution functions P(R) of tRNA, T box–stem I86, and stem I86–tRNA complex, computed as described in the text. (B) Docking of the T box stem I86 model into the single phase SAXS reconstructed envelope from DAMMIF (average NSD = 0.77 ± 0.12). (C) Docking of the stem I86–tRNA complex model into the SAXS reconstructed envelope from DAMMIF, the single phase approximation treats the two components as part of a single particle (average NSD = 0.66 ± 0.09). (D and E) Experimental SAXS profiles of tRNA, T box–stem I86, and stem I86–tRNA complex in linear (D) and Kratky representations (E). The dashed curve (black) is the sum of tRNA (red) and T box RNA (blue). (F) Docking of the stem I86–tRNA complex model into the averaged two-phase MONSAreconstructed envelope. This model shows the relative placement of the two RNA components in the reconstruction
Figure 5
Figure 5
SAXS analysis of DEAD-box helicase protein CYT-19. (A–C) SAXS data for full-length CYT-19 (green) and CYT-19/ΔC-tail (red) in the absence of ligands. (A) Normalized distance distribution functions. (B) and (C) low-resolution envelopes calculated by DAMMIN (Upper) and BUNCH atomic models (Lower), which are aligned inside the DAMMIN envelope (gray). BUNCH models were generated using a homology model of CYT-19 that is based upon its sequence similarity to Mss116p (see SI Methods in Ref. 68). (D–F) SAXS data for CYT-19 bound to U10–RNA and ADP-BeFx, shown in the same arrangement as in (A–C). For the minimal CYT-19/ΔC-tail complex, the DAMMIN envelope in (F) is aligned to the homology model for CYT-19. (G–I) SAXS data for full-length CYT-19 bound to large nucleic acid substrates.* (G) Normalized distribution functions for CYT-19-ADP-BeFx bound to RNA-DNA-duplex 1 (solid green line) and RNA-DNAduplex RNA–DNA duplex 1 (substrate 1) and RNA–DNA duplex 2 (substrate 2), respectively. Two-phase models of protein (green) and nucleic acid (yellow) were constructed by MONSA (Upper) and atomic models for protein and nucleic acid were manually placed inside the corresponding SAXS envelopes (Lower). This figure and caption originally appeared in the article Mallam et al., Proceedings of the National Academy of Sciences USA, 108(30):12254–12259, (2011).
Figure 6
Figure 6
Probing the ion atmosphere around RNA using ASAXS. (A and B) Real part of the anomalous scattering factor f’ for Rb+ ions (A) and Sr2+ ions (B), respectively. The f’ values at the energies used in the multiple energy ASAXS experiment are circled in red. Measurements at five energies are used to extract the number of ions from Eqn. 7. As described in the text, measurements at only two energies are used to generate the anomalous difference signals that report the spatial distribution of ions around the macromolecule. (C and D) ASAXS difference signals, Ianom (q) ~ b(q), for 0.1 M Rb+ ions (C) and 0.01 M Sr2+ ions (D), respectively. The ASAXS signal is calibrated on an absolute scale using water as a standard.

References

    1. Svergun DI, Koch MHJ. Small-angle scattering studies of biological macromolecules in solution. Reports on Progress in Physics. 2003;66:1735–1782.
    1. Lipfert J, Doniach S. Small-angle X-ray scattering from RNA, proteins, and protein complexes. Annual Review of Biophysics and Biomolecular Structure. 2007;36:307–327. - PubMed
    1. Doniach S, Lipfert J. Use of Small Angle X-Ray Scattering (Saxs) to Characterize Conformational States of Functional RNAs. Methods in Enzymology, Vol 469: Biophysical, Chemical, and Functional Probes of RNA Structure, Interactions and Folding, Pt B. 2009;469:237–251. - PubMed
    1. Fang XY, Stagno JR, Bhandari YR, Zuo XB, Wang YX. Small-angle X-ray scattering: a bridge between RNA secondary structures and three-dimensional topological structures. Current Opinion in Structural Biology. 2015;30:147–160. - PMC - PubMed
    1. Baird NJ, West J, Sosnick TR. RNA Structure and Folding Analyzed Using Small-Angle X-Ray Scattering. Handbook of RNA Biochemistry, Vols 1 and 2, 2nd Edition. 2014:407–425.

Publication types

LinkOut - more resources