

Testing for Hardy-Weinberg equilibrium at biallelic genetic markers on the X chromosome
- PMID: 27071844
- PMCID: PMC4868269
- DOI: 10.1038/hdy.2016.20
Testing for Hardy-Weinberg equilibrium at biallelic genetic markers on the X chromosome
Abstract
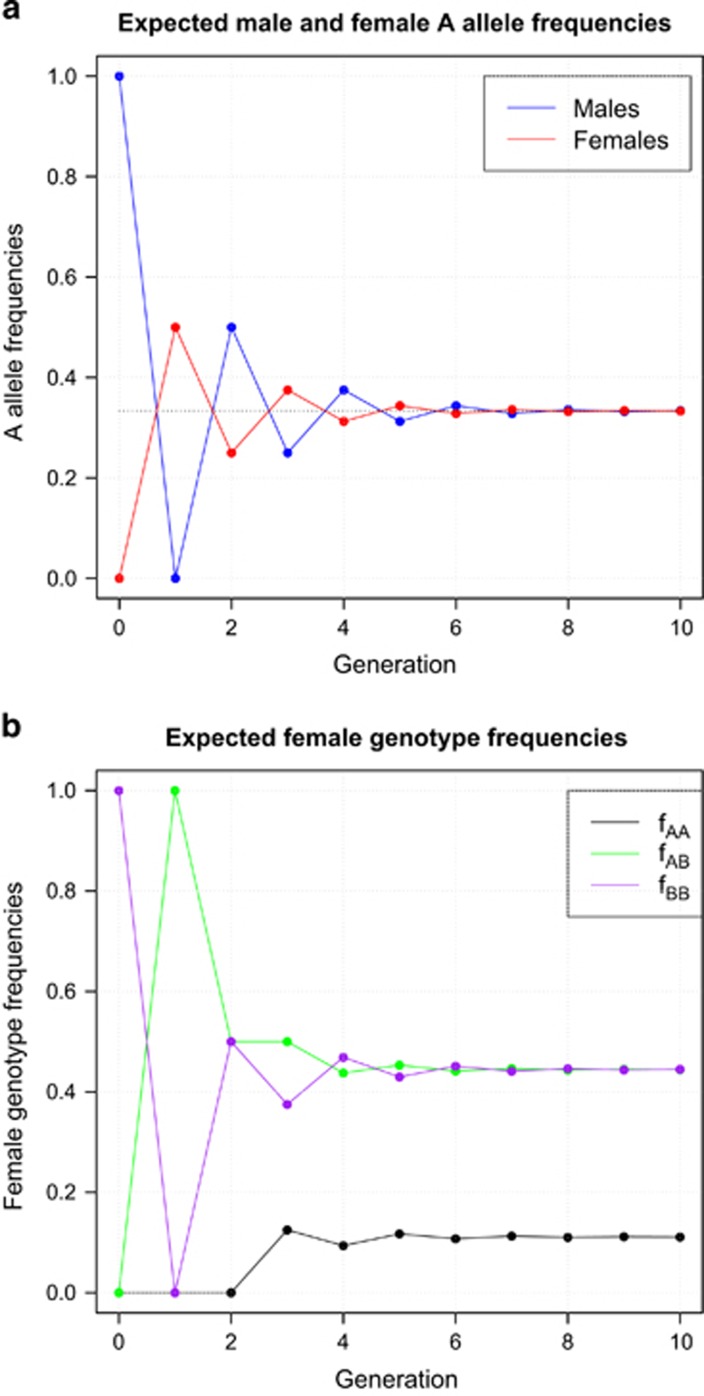
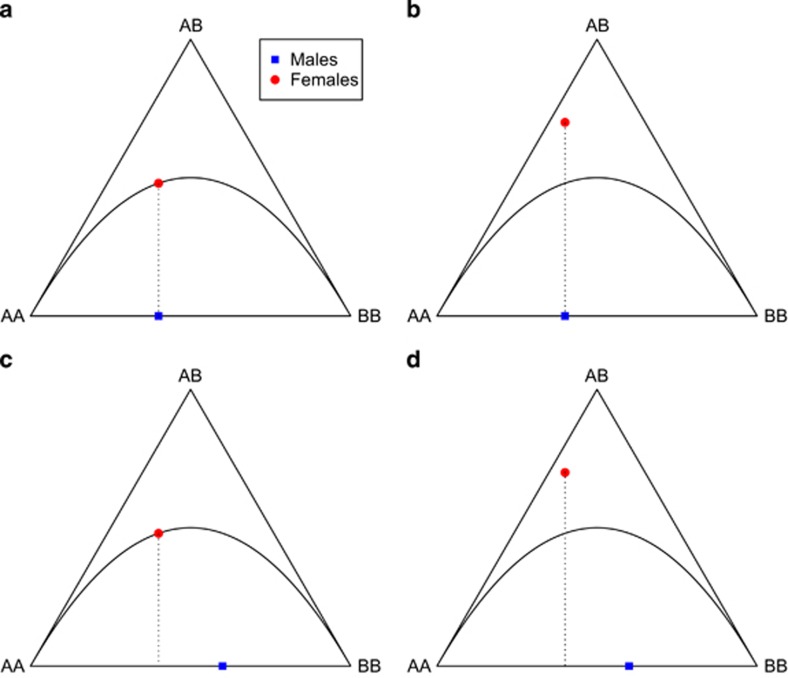
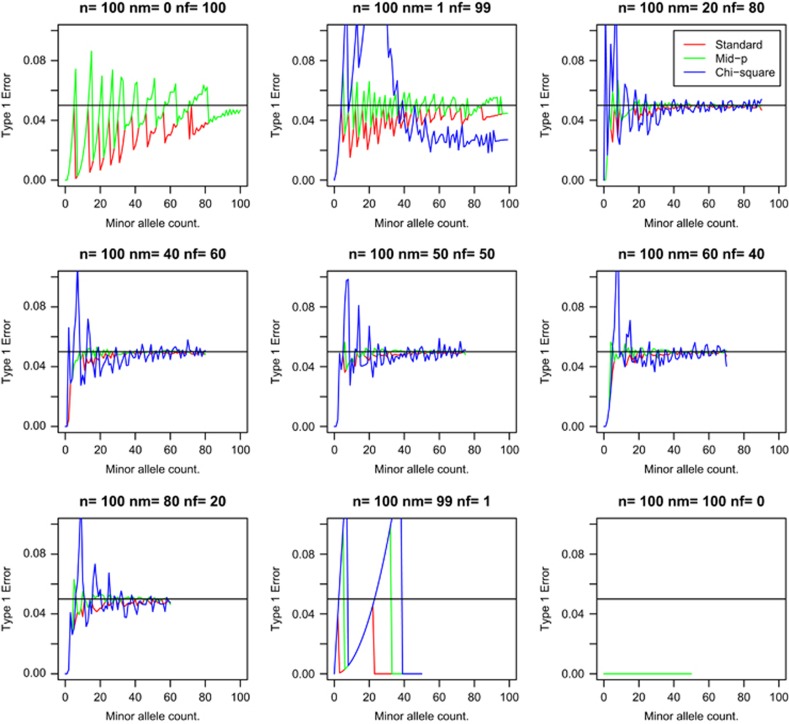
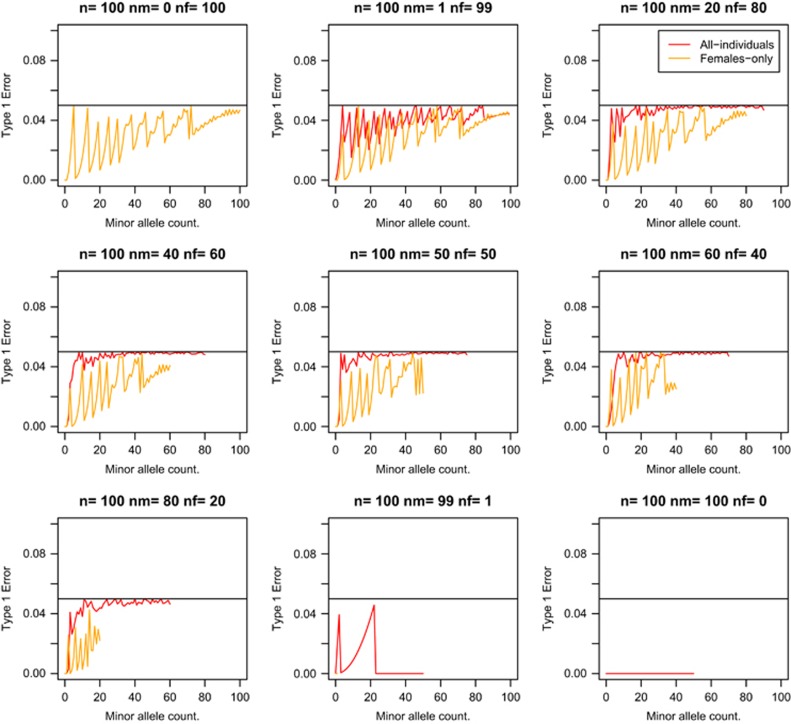
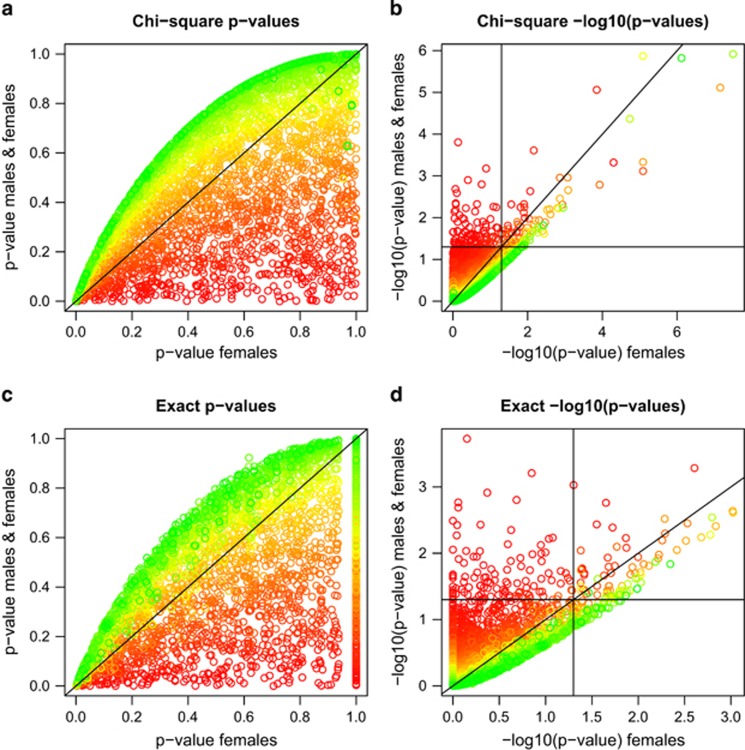
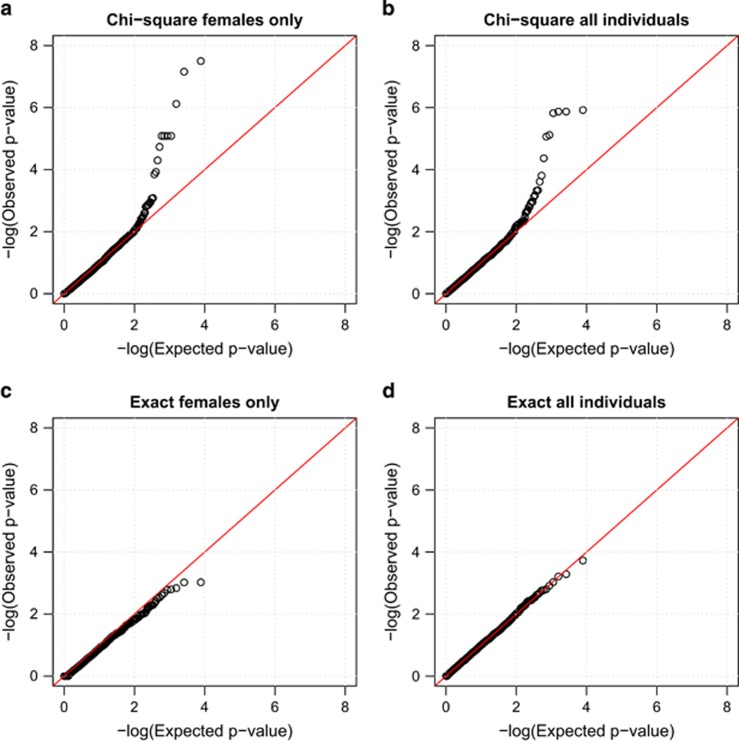
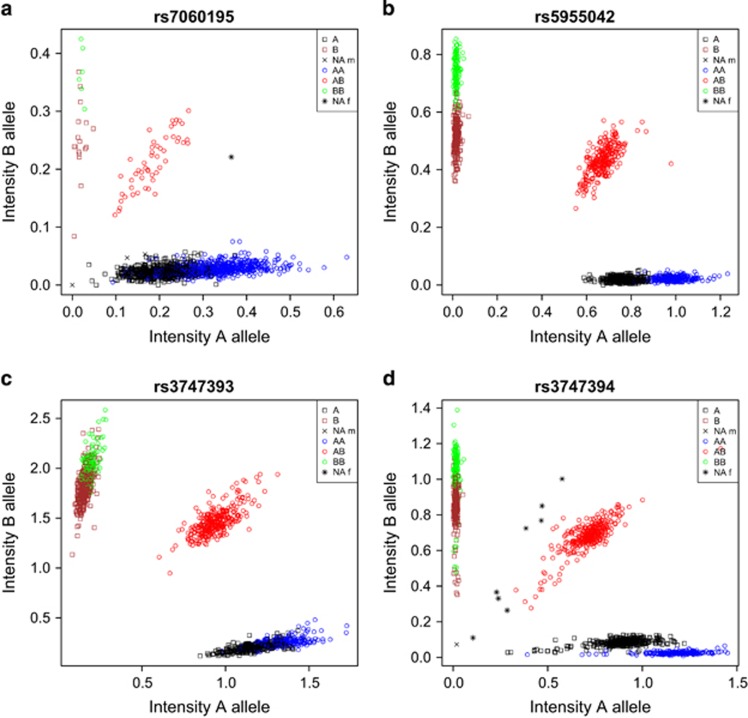
Testing genetic markers for Hardy-Weinberg equilibrium (HWE) is an important tool for detecting genotyping errors in large-scale genotyping studies. For markers at the X chromosome, typically the χ(2) or exact test is applied to the females only, and the hemizygous males are considered to be uninformative. In this paper we show that the males are relevant, because a difference in allele frequency between males and females may indicate HWE not to hold. The testing of markers on the X chromosome has received little attention, and in this paper we lay down the foundation for testing biallelic X-chromosomal markers for HWE. We develop four frequentist statistical test procedures for X-linked markers that take both males and females into account: the χ(2) test, likelihood ratio test, exact test and permutation test. Exact tests that include males are shown to have a better Type I error rate. Empirical data from the GENEVA project on venous thromboembolism is used to illustrate the proposed tests. Results obtained with the new tests differ substantially from tests that are based on female genotype counts only. The new tests detect differences in allele frequencies and seem able to uncover additional genotyping error that would have gone unnoticed in HWE tests based on females only.
Figures
Similar articles
-
A test for deviations from expected genotype frequencies on the X chromosome for sex-biased admixed populations.Heredity (Edinb). 2019 Oct;123(4):470-478. doi: 10.1038/s41437-019-0233-z. Epub 2019 May 17. Heredity (Edinb). 2019. PMID: 31101879 Free PMC article.
-
A Bayesian test for Hardy-Weinberg equilibrium of biallelic X-chromosomal markers.Heredity (Edinb). 2017 Oct;119(4):226-236. doi: 10.1038/hdy.2017.30. Epub 2017 Jul 5. Heredity (Edinb). 2017. PMID: 28900292 Free PMC article.
-
Multi-allelic exact tests for Hardy-Weinberg equilibrium that account for gender.Mol Ecol Resour. 2018 May;18(3):461-473. doi: 10.1111/1755-0998.12748. Epub 2018 Jan 22. Mol Ecol Resour. 2018. PMID: 29288525 Free PMC article.
-
[Application of chi-square test and exact test in Hardy-Weinberg equilibrium testing].Fa Yi Xue Za Zhi. 2004;20(2):116-9. Fa Yi Xue Za Zhi. 2004. PMID: 15311526 Review. Chinese.
-
[Hardy-Weinberg equilibrium in genetic epidemiology].Zhong Nan Da Xue Xue Bao Yi Xue Ban. 2010 Jan;35(1):90-3. doi: 10.3969/j.issn.1672-7347.2010.01.013. Zhong Nan Da Xue Xue Bao Yi Xue Ban. 2010. PMID: 20130370 Review. Chinese.
Cited by
-
eXclusionarY: 10 years later, where are the sex chromosomes in GWASs?Am J Hum Genet. 2023 Jun 1;110(6):903-912. doi: 10.1016/j.ajhg.2023.04.009. Am J Hum Genet. 2023. PMID: 37267899 Free PMC article. Review.
-
A genome-wide study of Hardy-Weinberg equilibrium with next generation sequence data.Hum Genet. 2017 Jun;136(6):727-741. doi: 10.1007/s00439-017-1786-7. Epub 2017 Apr 3. Hum Genet. 2017. PMID: 28374190 Free PMC article.
-
Unveiling ancestral threads: Exploring CCR5 ∆32 mutation frequencies in Colombian populations for HIV/AIDS therapeutics.Infect Genet Evol. 2024 Nov;125:105680. doi: 10.1016/j.meegid.2024.105680. Epub 2024 Oct 5. Infect Genet Evol. 2024. PMID: 39374819
-
Pilot study: genetic distribution of AR, FGF5, SULT1A1 and CYP3A5 polymorphisms in male Mexican population with androgenetic alopecia.Int J Mol Epidemiol Genet. 2022 Dec 15;13(3):32-41. eCollection 2022. Int J Mol Epidemiol Genet. 2022. PMID: 36660495 Free PMC article.
-
Comprehensive analysis of chemokine gene polymorphisms in Korean children with autoimmune thyroid disease.Sci Rep. 2023 Sep 20;13(1):15642. doi: 10.1038/s41598-023-42021-4. Sci Rep. 2023. PMID: 37730733 Free PMC article.
References
-
- Ayres KL, Balding DJ. (1998). Measuring departures from Hardy-Weinberg: a Markov chain monte carlo method for estimating the inbreeding coefficient. Heredity 80: 769–777. - PubMed
-
- Cannings C, Edwards AWF. (1968). Natural selection and the de Finetti diagram. Ann Hum Genet 31: 421–428. - PubMed
-
- Consonni G, Moreno E, Venturini S. (2010). Testing Hardy-Weinberg equilibrium: an objective bayesian analysis. Stat Med 30: 62–74. - PubMed
-
- Crow JF, Kimura M. (1970) An Introduction to Population Genetics Theory. Harper & Row Publishers.
-
- De Finetti B. (1926). Considerazioni matematiche sull'eredità mendeliana. Metron 6: 3–41.
Publication types
MeSH terms
Substances
Grants and funding
LinkOut - more resources
Full Text Sources
Other Literature Sources
