

Relationship Between Measures of Adiposity, Arterial Inflammation, and Subsequent Cardiovascular Events
- PMID: 27072302
- PMCID: PMC5036397
- DOI: 10.1161/CIRCIMAGING.115.004043
Relationship Between Measures of Adiposity, Arterial Inflammation, and Subsequent Cardiovascular Events
Abstract
Background: The objective of this study was to evaluate how different measures of adiposity are related to both arterial inflammation and the risk of subsequent cardiovascular events.
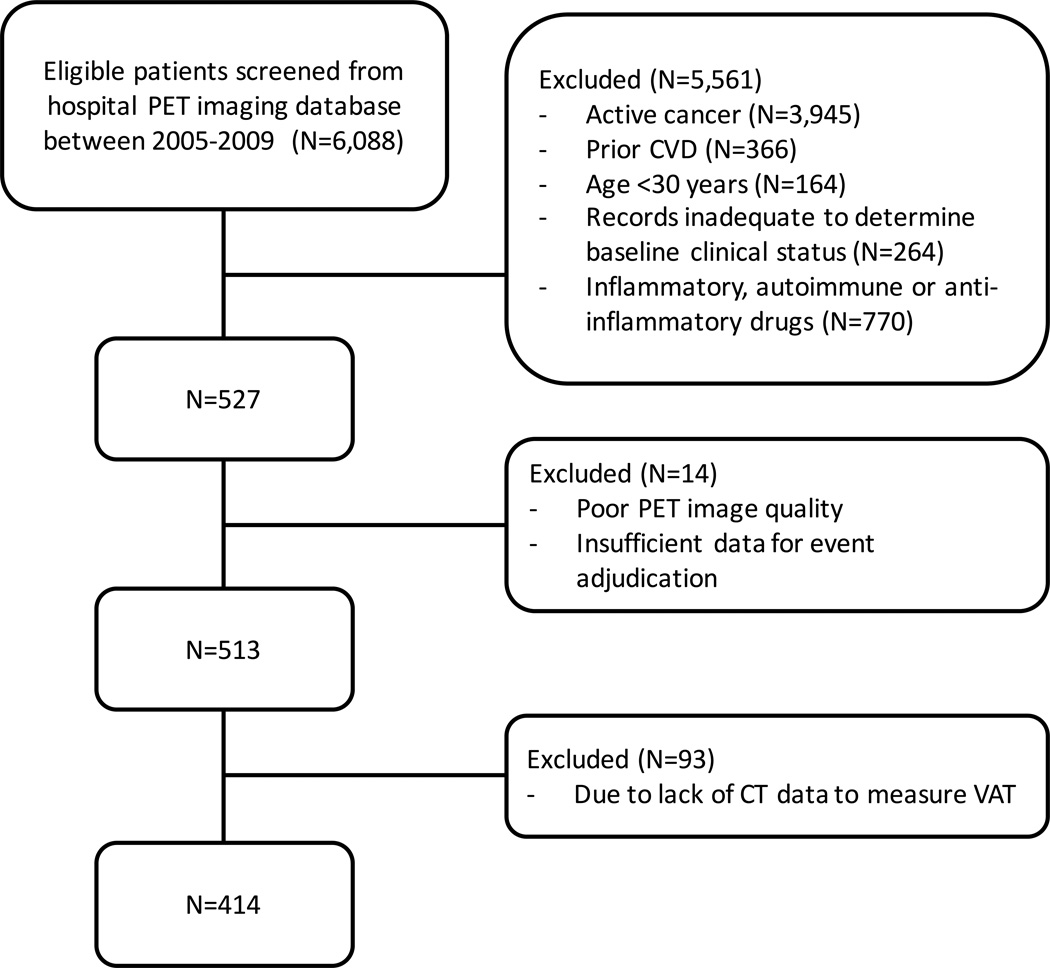
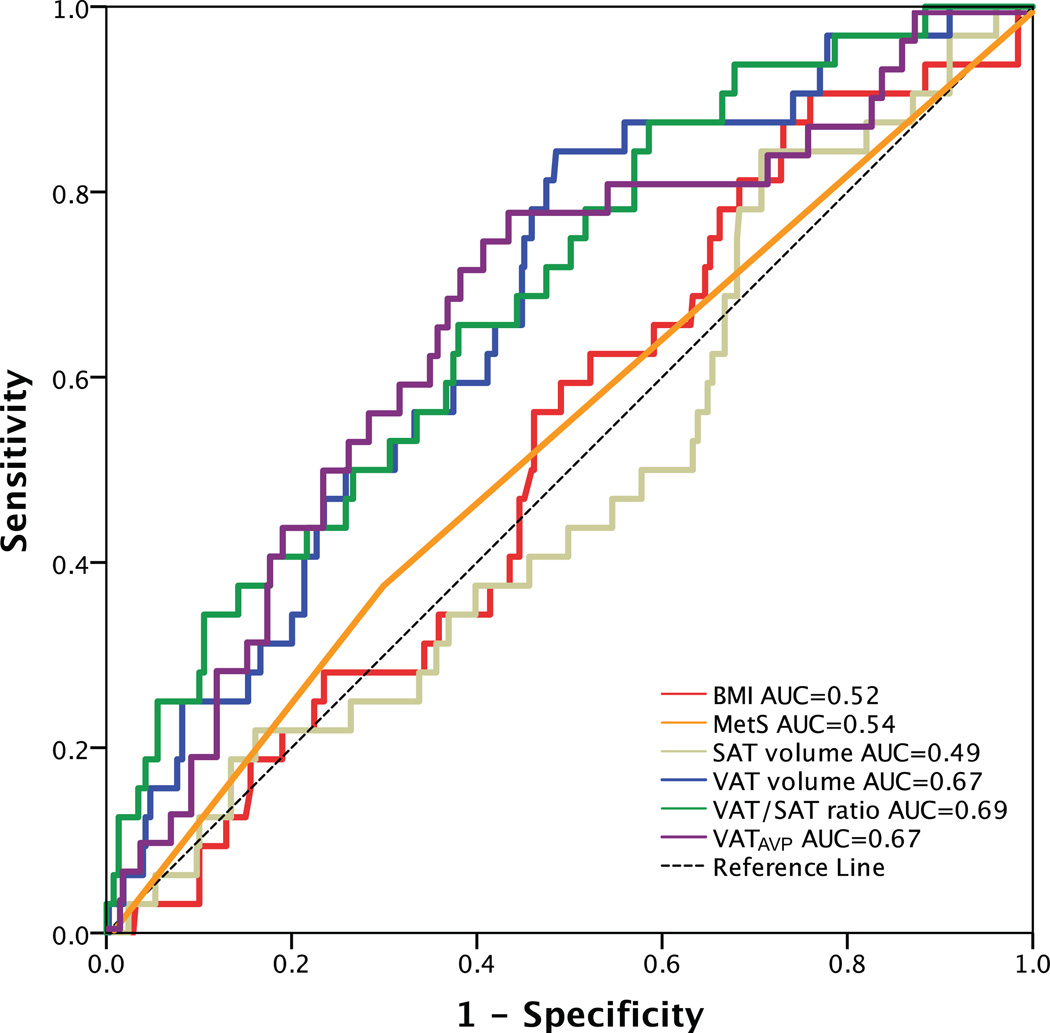
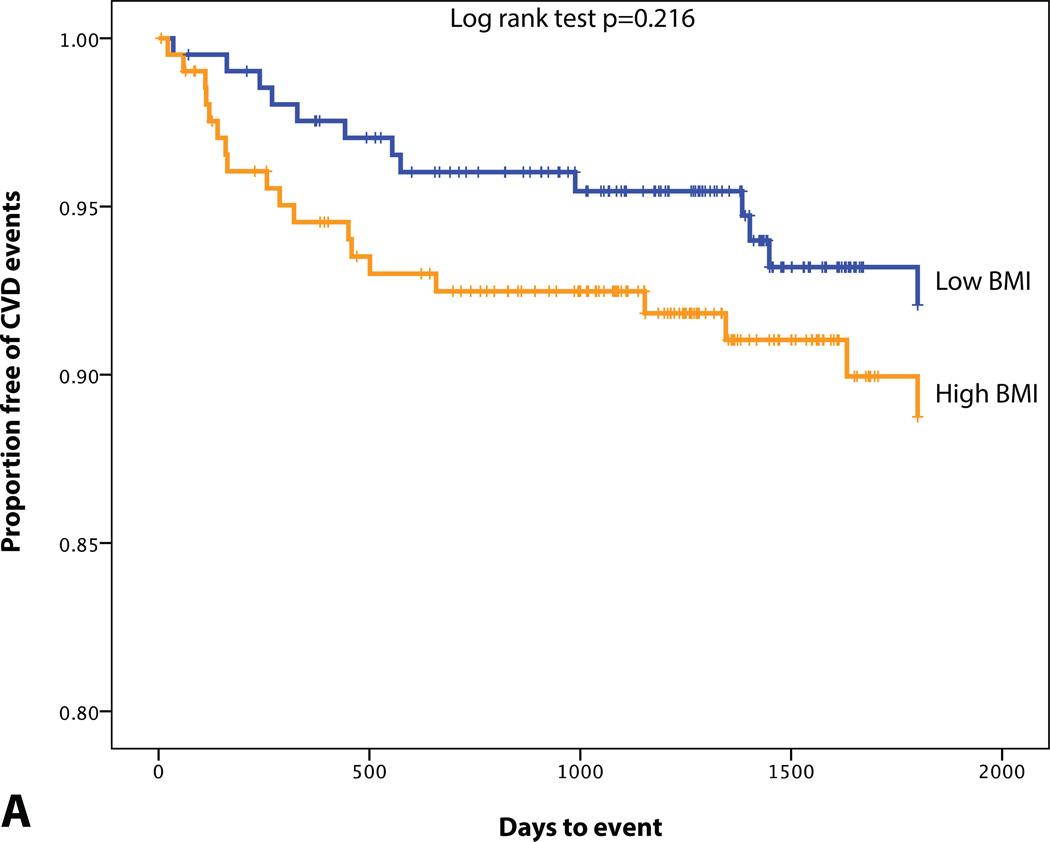
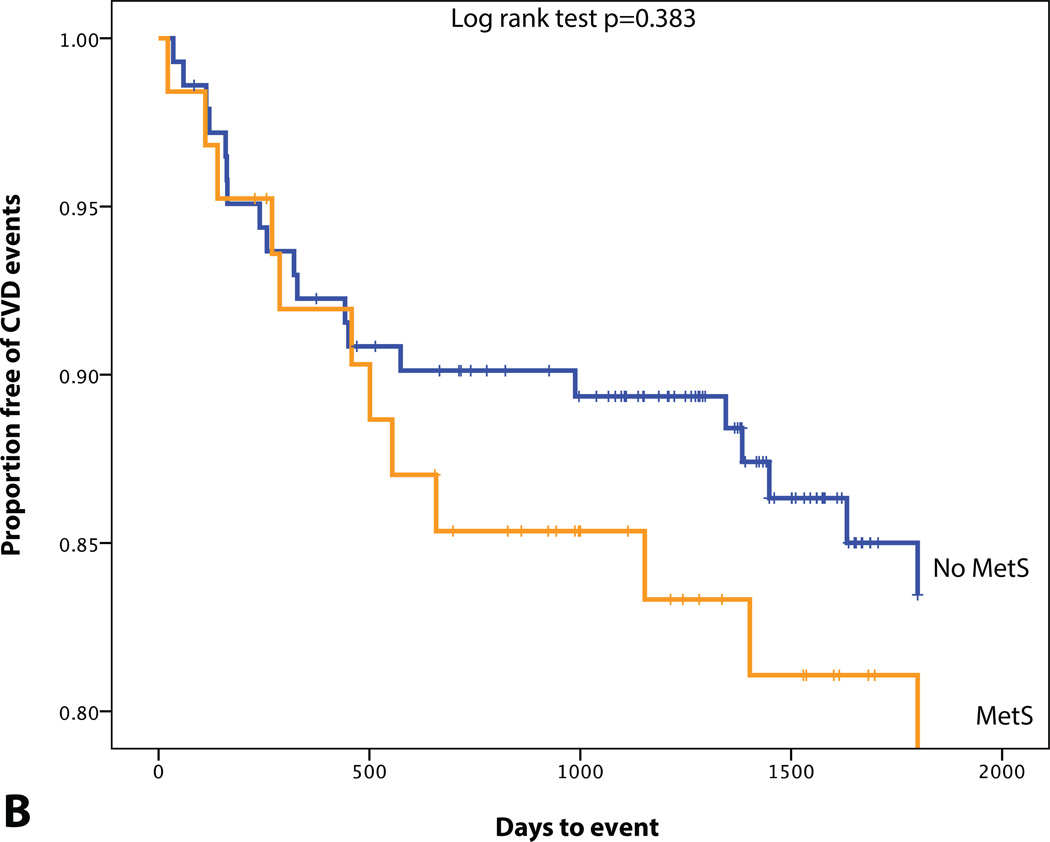
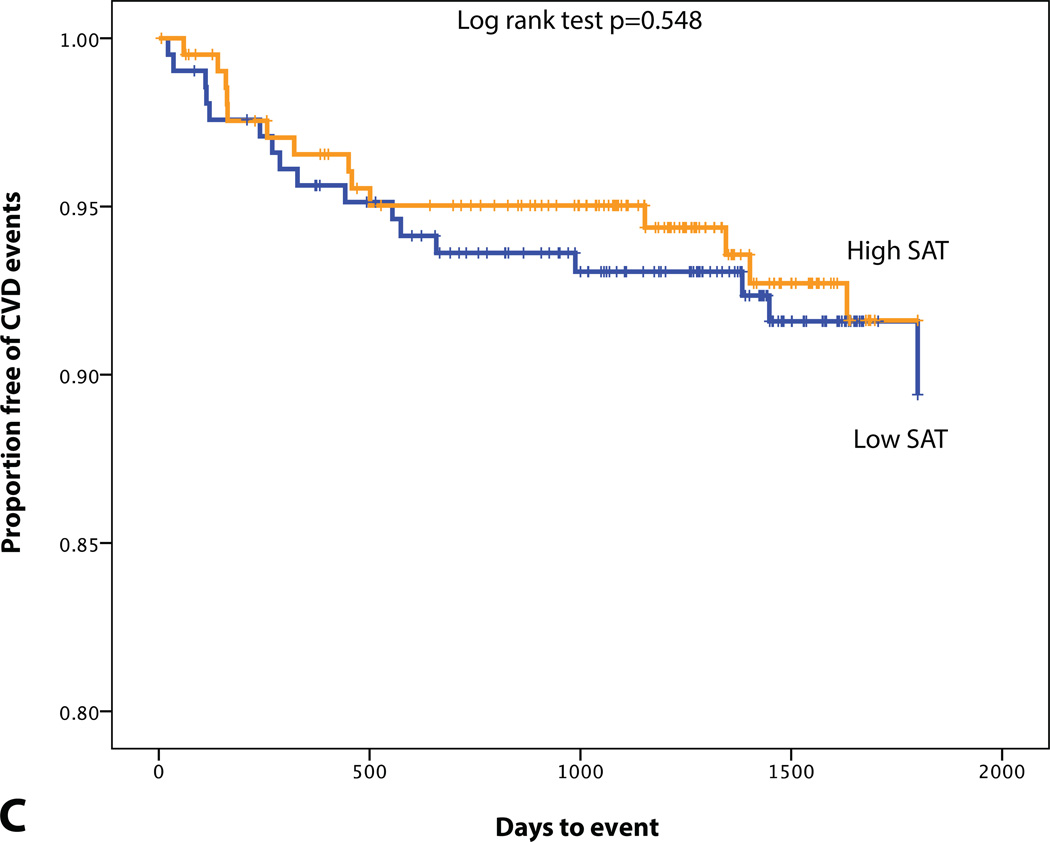
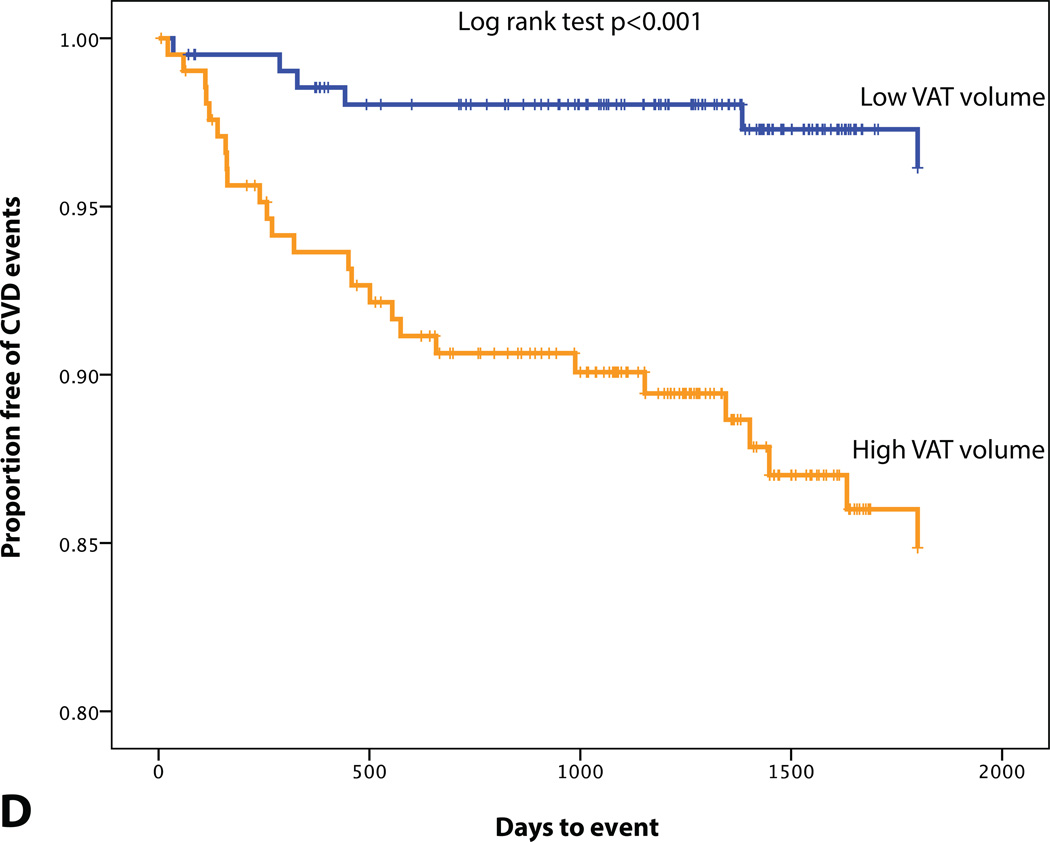
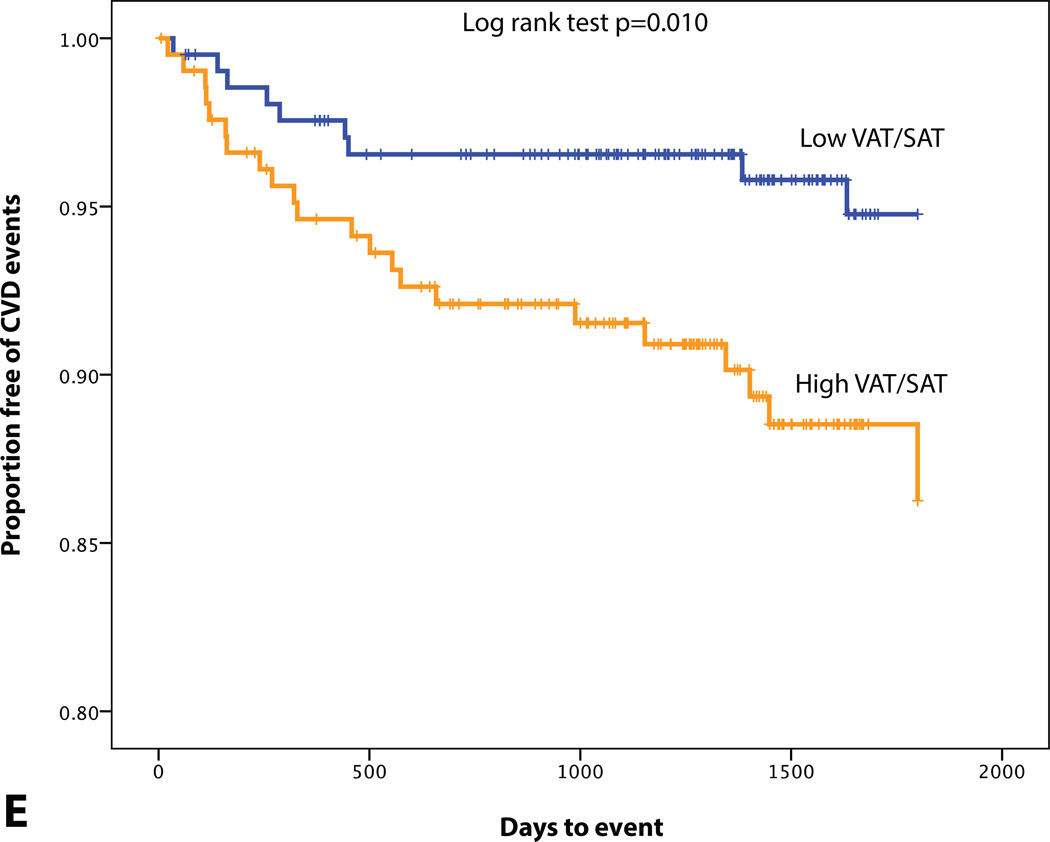
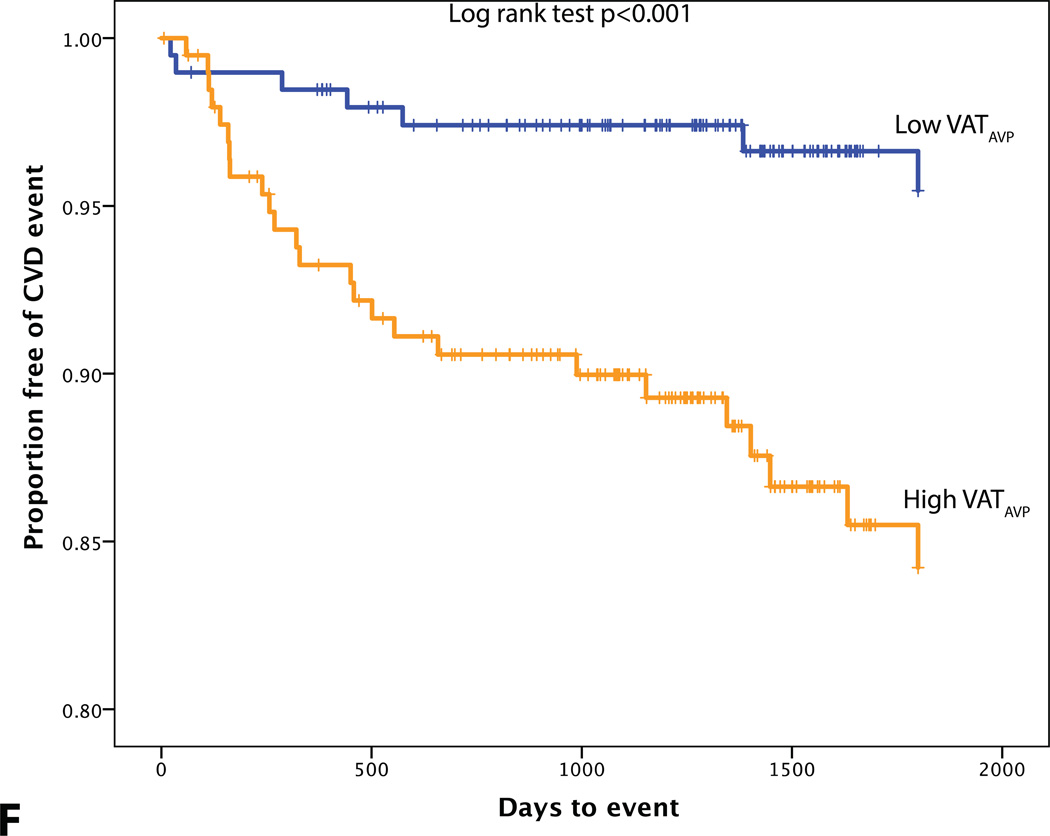
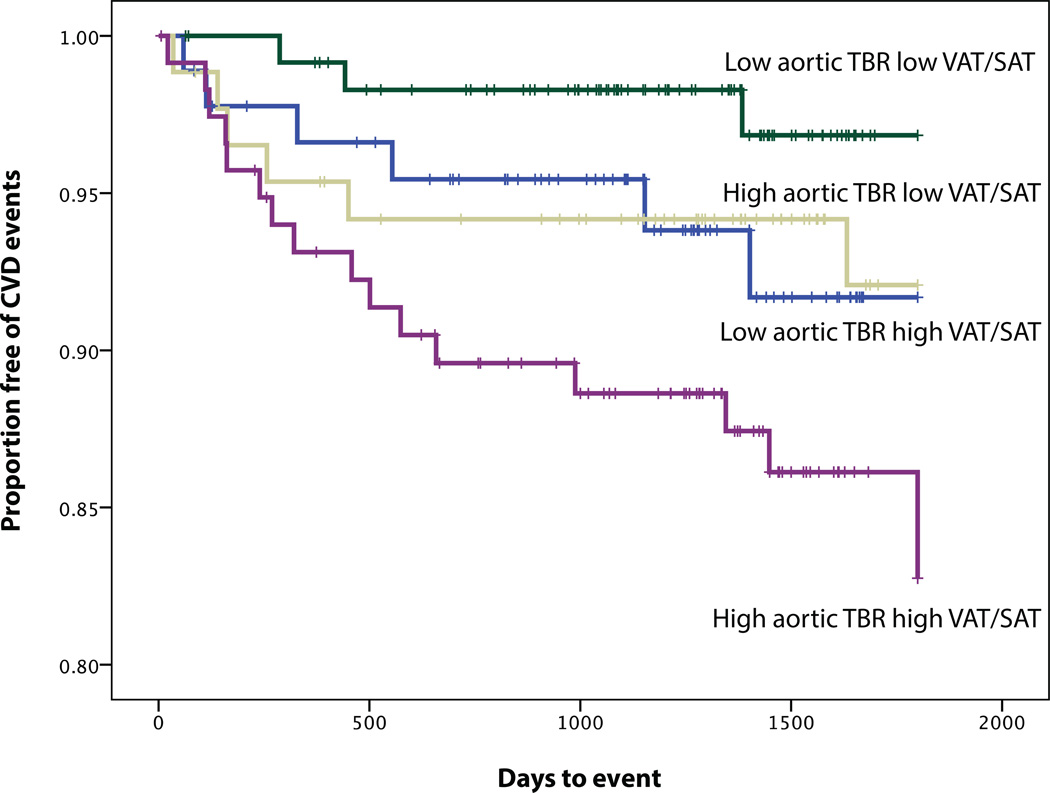
Methods and results: We included individuals who underwent (18)F-fluorodeoxyglucose positron emission tomography/computed tomography imaging for oncological evaluation. Subcutaneous adipose tissue (SAT) volume, visceral adipose tissue (VAT) volume, and VAT/SAT ratio were determined. Additionally, body mass index, metabolic syndrome, and aortic (18)F-fluorodeoxyglucose uptake (a measure of arterial inflammation) were determined. Subsequent development of cardiovascular disease (CVD) events was adjudicated. The analysis included 415 patients with a median age of 55 (P25-P75: 45-65) and a median body mass index of 26.4 (P25-P75: 23.4-30.9) kg/m(2). VAT and SAT volume were significantly higher in obese individuals. VAT volume (r=0.290; P<0.001) and VAT/SAT ratio (r=0.208; P<0.001) were positively correlated with arterial inflammation. Thirty-two subjects experienced a CVD event during a median follow-up of 4 years. Cox proportional hazard models showed that VAT volume and VAT/SAT ratio were associated with CVD events (hazard ratio [95% confidence interval]: 1.15 [1.06-1.25]; P<0.001; 3.60 [1.88-6.92]; P<0.001, respectively). Body mass index, metabolic syndrome, and SAT were not predictive of CVD events.
Conclusions: Measures of visceral fat are positively related to arterial inflammation and are independent predictors of subsequent CVD events. Individuals with higher measures of visceral fat as well as elevated arterial inflammation are at highest risk for subsequent CVD events. The findings suggest that arterial inflammation may explain some of the CVD risk associated with adiposity.
Keywords: adipose tissue; atherosclerosis; cardiovascular events; obesity; positron emission tomography.
© 2016 American Heart Association, Inc.
Figures
Comment in
-
Can Imaging Improve Our Understanding of Cardiovascular Pathophysiology?Circ Cardiovasc Imaging. 2016 Apr;9(4):e004805. doi: 10.1161/CIRCIMAGING.116.004805. Circ Cardiovasc Imaging. 2016. PMID: 27072305 No abstract available.
References
-
- Obesity: preventing and managing the global epidemic. Report of a WHO consultation. World Health Organ Tech Rep Ser. 2000;894:i–xii. 1–253. - PubMed
-
- Ogden CL, Carroll MD, Curtin LR, Lamb MM, Flegal KM. Prevalence of high body mass index in US children and adolescents, 2007–2008. Jama. 2010;303:242–249. - PubMed
-
- Oda E. Obesity-related risk factors of cardiovascular disease. Circ J. 2009;73:2204–2205. - PubMed
-
- Logue J, Murray HM, Welsh P, Shepherd J, Packard C, Macfarlane P, Cobbe S, Ford I, Sattar N. Obesity is associated with fatal coronary heart disease independently of traditional risk factors and deprivation. Heart. 2011;97:564–568. - PubMed
MeSH terms
Substances
Grants and funding
LinkOut - more resources
Full Text Sources
Other Literature Sources
Research Materials
