. 2016 Nov;9(6):1442-1454.
doi: 10.1038/mi.2016.27. Epub 2016 Apr 13.

The innate immune properties of airway mucosal surfaces are regulated by dynamic interactions between mucins and interacting proteins: the mucin interactome

Affiliations

The innate immune properties of airway mucosal surfaces are regulated by dynamic interactions between mucins and interacting proteins: the mucin interactome

Giorgia Radicioni et al. Mucosal Immunol. 2016 Nov.

Abstract

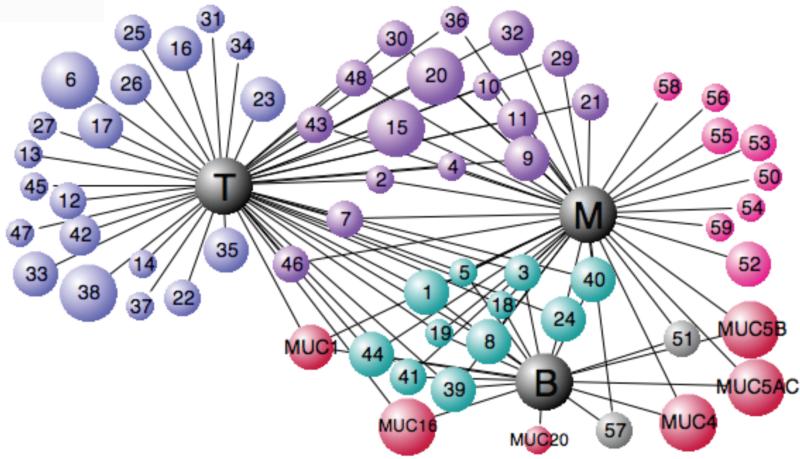
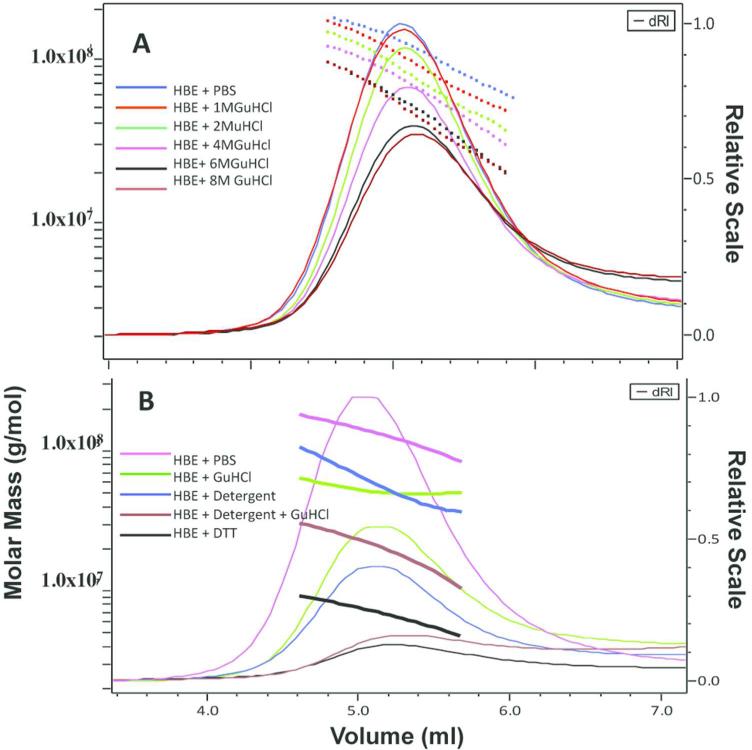
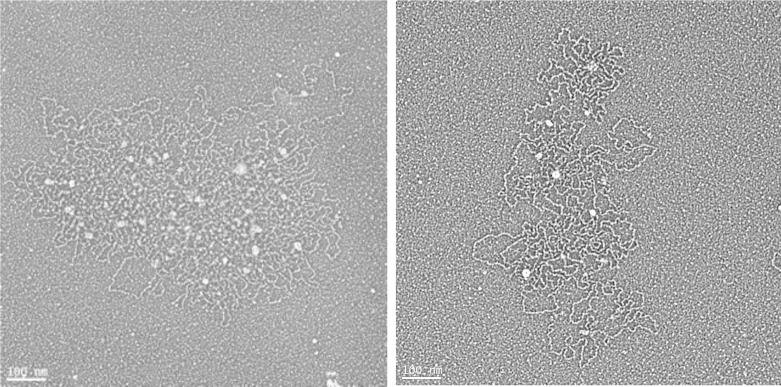
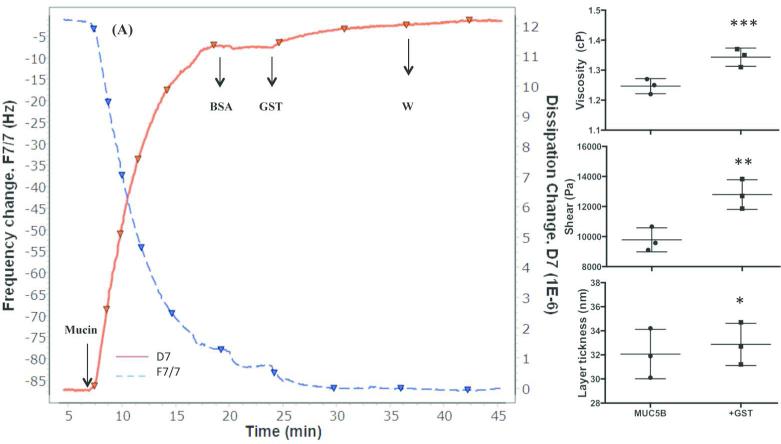
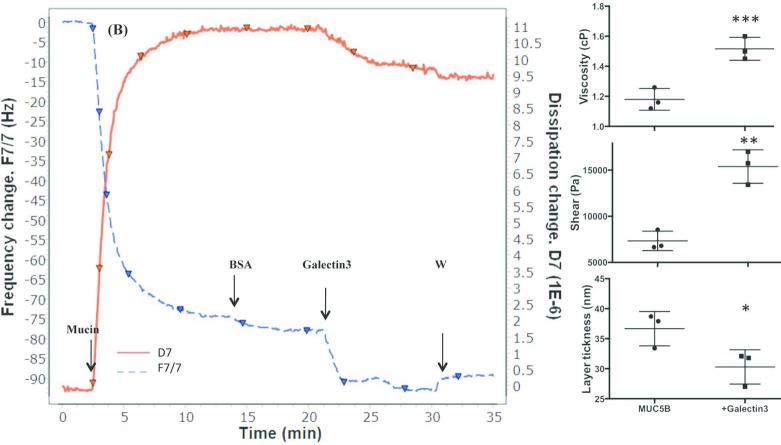
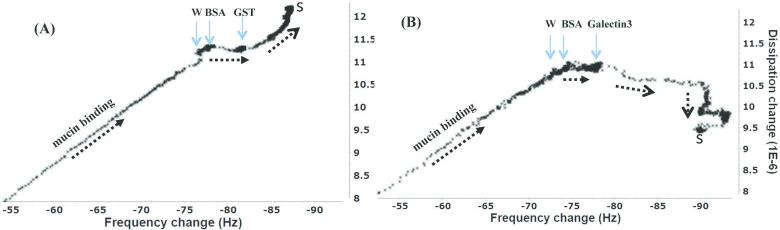
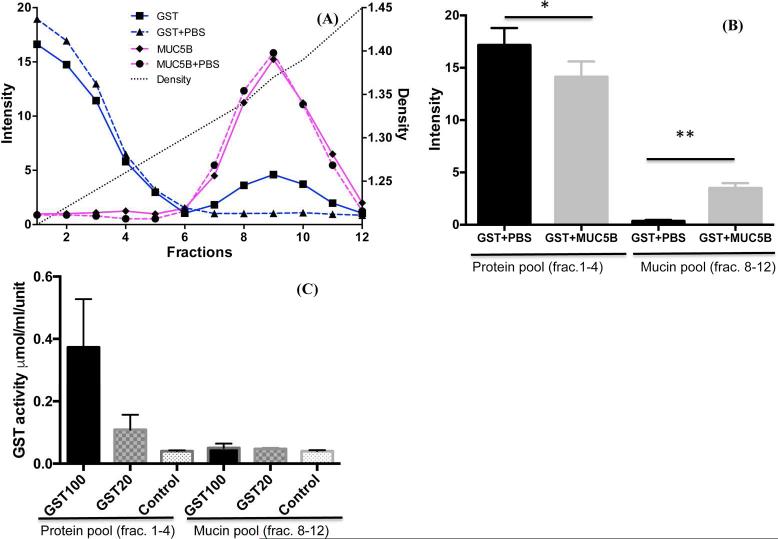
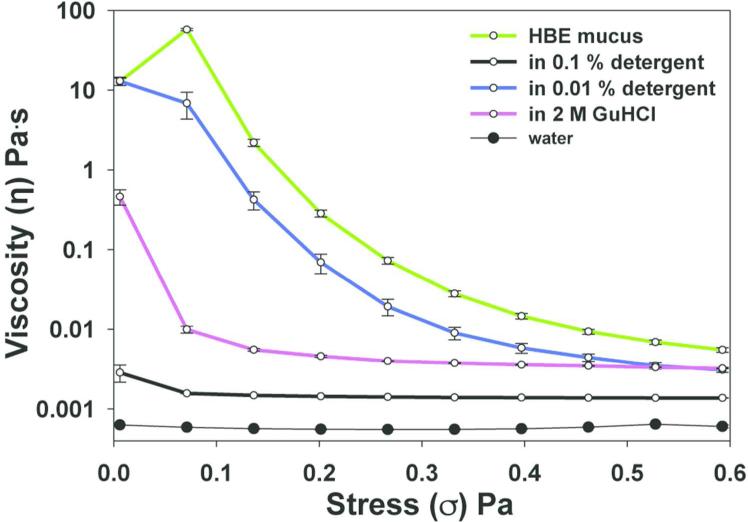
Chronic lung diseases such as cystic fibrosis, chronic bronchitis, and asthma are characterized by hypersecretion and poor clearance of mucus, which are associated with poor prognosis and mortality. Little is known about the relationship between the biophysical properties of mucus and its molecular composition. The mucins MUC5B and MUC5AC are traditionally believed to generate the characteristic biophysical properties of airway mucus. However, the contribution of hundreds of globular proteins to the biophysical properties of mucus is not clear. Approximately one-third of the total mucus proteome comprises distinct, multi-protein complexes centered around airway mucins. These complexes constitute a discrete entity we call the "mucin interactome". The data suggest that while the majority of these proteins interact with mucins via electrostatic and weak interactions, some interact through very strong hydrophobic and/or covalent interactions. Using reagents that interfere with protein-protein interactions, the complexes can be disassembled, and mucus rheology can be dramatically altered. Using MUC5B-glutathione S-transferase (GST) and MUC5B-galectin-3 as a representative of these interactions, we provide evidence that individual mucin protein interactions can alter the biophysical properties of mucus and modulate the biological function of the protein. We propose that the key mechano- and bio-active functions of mucus depend on the dynamic interactions between mucins and globular proteins. These observations challenge the paradigm that mucins are the only molecules that confer biophysical properties of mucus. These observations may ultimately lead to a greater understanding of the system and guide the development of strategies for more effective interventions using better therapeutic agents.


Figures

Figure 1
Figure 1. Two-step isolation of the mucin protein complexes from HBE secretions
An aliquot (10 ml) of HBE secretions was subjected to gel filtration chromatography on an S1000 column. Then, 2-ml fractions were collected and analyzed with PAS (pink) and amido black staining (black) (A). The PAS-rich void volume was pooled and subjected to CsCl density gradient centrifugation (B). The fractions were unloaded and probed using slot blotting with PAS (pink) and amido black staining (black) and a keratin sulfate antibody (dotted black). Fractions 1-6, 8-15, 16-20 were pooled and subjected to proteomic analysis, as reported in figure 2. The blue line represent density. The intensity units are arbitrary.
Figure 2
Figure 2. Airway mucin interactome map
HBE secretions were first subjected to S1000 size-exclusion chromatography. Mucins and their interacting proteins were then separated from other structures and protein-protein complexes using isopycnic density gradient centrifugation. The low-density (T, fractions 1-6), medium-density (M, fractions 8-15) and high-density (B, fractions 16-20) regions were pooled and subjected to a proteomics analysis. Magenta: mucins, Red: proteins found only in the “M” region, Purple: proteins found in both the “M” and “T” regions, Blue: proteins only found only in the “T” region, Green: proteins found in all regions. The size of each proteins cycle reflects its relative abundance. The detected proteins are numbered as follows: 1- LPLUNC1, 2- Ezrin, 3- Actin, 4- Antileukoproteinase 1, 5- Chloride ion channel 1, 6- Complement C3, 7- PLUNC, 8- Dipeptidyl peptidase, 9- Polymeric-IG receptor, 10- Brain acid soluble protein, 11- Tubulin beta-chain, 12- CD9, 13- Gelsolin, 14- Superoxide dismutase, 15- Annexin A2, 16- EHD4, 17- Alpha-enolase, 18- Tetraspanin-1, 19- EBP50 20- Complement factor B, 21- Calgizzarin, 22- Peroxiredoxin 1&2, 23- NGALipocalin, 24- Calmyrin, 25- Aldehyde dehydrogenase, 26- Uteroglobin, 27- Pyruvate kinase isozymes M1/M2, 28- MUCIN-1, 29- Glutathione S-transferase P, 30- Cofilin-1, 31- Protein CGI-38, 32- Calcyphosine, 33- Ceruloplasmin, 34- Transgelin-2, 35- Calmodulin, 36- Stomatin, 37- Annexin A5, 38- Calpain-5,6, 39- Prominin 1, 40- Clusterin Apoliporotein J, 41- Cystatin-B, 42- Serpin F1, PEDF, 43- Protein S100 A6,8,9,14,16. 44- DMBT1, 45- Annexin A1, 46- CD59 glycoprotein, 47- Cathepsin D 48- Na/K ATPase alpha-1 chain, 49- Mucin-5B, 50- Prostate stem cell Ag 51- Galectin 9, 52- Leukocyte elastase inhibitor, 53- Galectin-3 BP, 54- Galectin 3, 55- WAP four-disulfide core protein2, 56- Defensin1, 57- Galectin 8, 58- Lysozyme C, 59- Serpins B3&B6 60- MUCIN 4, 61-MUCIN-5AC, 62-MUCIN-16, 63- MUC-20
Figure 3
Figure 3
A representative 3-dimensional rendering of an Atomic Force Microscope image of the organizational framework of the mucin interactome: The mucin interactome was isolated as described in the methods and deposited onto mica and observed in a Cypher AFM. Glycosylated domains/chains of the mucins are shown in green and measured approximately 1-2 nm in height. The brown color represents protein regions of the framework, including mucin's naked protein domains, as well as small mucin-binding proteins, which range in height from 2-5 nm (black arrows, small nodes). Larger brown protein nodes with 5-12 nm heights (red arrows) in the framework indicate the presence of more than one, or larger, and/or more hydrophobic proteins on the nodes. (A)- An oligomerized structure of a protein, possibly DMBT1, incorporated into the mucus network by interacting with mucin chains. (B) A compact/unfolded mucin form with a large globular node in the center. Scale bars: left 250 nm, insets 100 nm.
Figure 4
Figure 4. The effect of chaotropic agents on mucin inretactome: A: The effect of GuHCl (0 – 8 M) on the recovery of the void complexes
The results of the titration experiment show that the first discernible decrease in recovery of the void peak was observed at a GuHCl concentration of approximately 2 M (green; as indicated). The loss increases progressively through 4 M GuHCl (magenta) and 6 M (black) to peak at 8 M (brown). B: The effect of GuHCl and detergent on the recovery of the void complexes: The panel shows traces of the peak of the V0 region from the S1000 column, as obtained from the Optilab refractometer, and the molar masses, as obtained from Dawn MALLS, plotted across the mucin peak. The starting material, HBE cell culture secretion (diluted in PBS), is denoted by the largest peak (magenta), and the subsequent dilution with 4 M GuHCl (green) and 0.1% CHAPS/0.1% Triton is shown in blue. The results for GuHCl plus the detergent are shown in brown.
Figure 5
Figure 5. Organization of compact mucins in complex with other proteins under physiological and dissociative conditions, as observed with electron microscopy
A mucin-based complex isolated from HBE secretions under physiological conditions using S1000 chromatography (A). The compact form shown here contains abundant protein nodes on the mucin structure. The typical molecular weight of this structure is higher than 150 to 200 MDa. After the GuHCl + detergent treatment and S1000 isolation under dissociative conditions (eluted with GuHCl + CHAPS), the mucin structure was more relaxed, and quite a few protein nodes remained in the structure in a more organized fashion. The molecular weight was dramatically reduced (to 40-100 Mda) after these treatments.
Figure 6
Figure 6. Monitoring individual mucin-protein interactions and their effects on the layer properties using QCM-D
The frequency shift one of the 3 of the overtones (F7, blue) and the dissipation shift for one of the three overtones (D7, red), were monitored using MUC5B +BSA +GST (A). The Sauerbrey model calculated an absorbed mucin layer of 1600 ± 5 ng/cm2. The addition of BSA did not affect the properties of the layer. After the addition of GST, the frequency decreased to ΔF= −87 IE-6, which was equal to an additional mass of 233 ± 7 ng/cm2 and dissipation has significantly increased up to ΔD7= 12,14 IE-6. The graphics in the right panel show the viscosity, shear and layer thickness comparisons before and after GST binding. The means and SEM values are indicated by the major and minor horizontal bars, respectively. A paired samples t test was used to determine changes in before/after values. (*P = 0.04, **P = 0.015 and ***P = 0.005). (B) Effect of galectin-3 on the mucin layer. The model calculated an absorbed mucin layer of 1300 ± 50 ng/cm2. Unlike GST, the addition of galectin-3 decreased the dissipation from 11.2 to 10.6, suggesting that galectin-3 has a stiffening effect on the layer. There is a sharp decrease in the frequency and subsequent reorganization of the layer (broken arrow) from the galectin-3 addition until the buffer wash (W) at the end which significantly decreased the layer thickness. The graphics in the right panel show the viscosity, shear and layer thickness comparisons before and after galectin-3 binding. The means and SEM values are indicated by the major and minor horizontal bars, respectively. A paired samples t test was used to determine the changes in the before and after values. (*P = 0.0025, **P = 0.008 and ***P = 0.005).
Figure 7
Figure 7. Frequency versus dissipation changes, ΔDf, during the absorption of mucins, GST and galectin-3
The linear ΔDf corresponds to a highly hydrated layer (mucin binding). The addition of albumin changes the ΔDf to a flat or downward slope, suggesting the formation of a rigid layer on the surface. The subsequent GST additions change the ΔDf slope to a linear upward trend, with an increase in the mass bound resulting in greater dissipation (A). The addition of galectin-3 (B) first causes a slight and then sudden decrease in the dissipation and the ΔDf. The trend of the layer hydration/thickness is marked with broken arrows and the stabilization of the layer at the end of the wash is marked (S).
Figure 8
Figure 8. MUC5B-GST interaction
A known concentration of GST was used to spike the purified MUC5B preparation. Then, the complex was isolated using a CsCl density gradient to detect the proportion of bound GST. A typical density gradient profile (A) shows that all of the MUC5B mucin is recovered in the high-density regions (fractions 7-11), whereas approximately 15-20 % of the GST was detected in the mucin region. CsCl density gradient with only GST (broken blue line) or MUC5B (broken magenta line) were used as controls. Four independent experiments using different preparations were summarized in (B) indicated that a significant amount of GST was present in the mucin fractions compared to the control (*P = 0.002). (C)- the GST activity measurements over the gradient of different concentration of GST (GST100μg, GST20μg) including a similar concentration in the mucin fraction at 7A (~15-20 μg) indicated that the GST activity peaks in approximately the first 3-4 fractions, but no measurable GST enzymatic activity was detected in the mucin-rich fractions (C). MUC5B preparation with no GST addition was used as control.
Figure 9
Figure 9. Rheological analysis of HBE secretions before and after the disruption of the protein-protein interactions
The HBE secretions were diluted so that all of the experiments had the same biomolecular concentration. The experiments were performed in a ramp-down manner starting at the highest shear stress and moving to the lowest. The data indicate that chaotropic agents and detergents significantly reduced the viscosity and abolished of the network viscoelasticity. GuHCl at 2M caused a significant reduction in viscosity, whereas 0.1% detergent reduced the viscosity dramatically. The viscosity of water was also included (closed circles).

References

    1. Kesimer M, Ehre C, Burns KA, Davis CW, Sheehan JK, Pickles RJ. Molecular organization of the mucins and glycocalyx underlying mucus transport over mucosal surfaces of the airways. Mucosal immunology. 2013;6(2):379–392. - PMC - PubMed
    1. Sheehan JK, Kesimer M, Pickles R. Innate immunity and mucus structure and function. Novartis Foundation symposium. 2006;279:155–166. discussion 167-159, 216-159. - PubMed
    1. Rubin BK. Physiology of airway mucus clearance. Respiratory care. 2002;47(7):761–768. - PubMed
    1. Rogers DF. Mucus hypersecretion in chronic obstructive pulmonary disease. Novartis Foundation symposium. 2001;234:65–77. discussion 77-83. - PubMed
    1. Rubin BK. Mucus structure and properties in cystic fibrosis. Paediatric respiratory reviews. 2007;8(1):4–7. - PubMed

Publication types