

Rapid genome-wide evolution in Brassica rapa populations following drought revealed by sequencing of ancestral and descendant gene pools
- PMID: 27072809
- PMCID: PMC4963267
- DOI: 10.1111/mec.13615
Rapid genome-wide evolution in Brassica rapa populations following drought revealed by sequencing of ancestral and descendant gene pools
Abstract
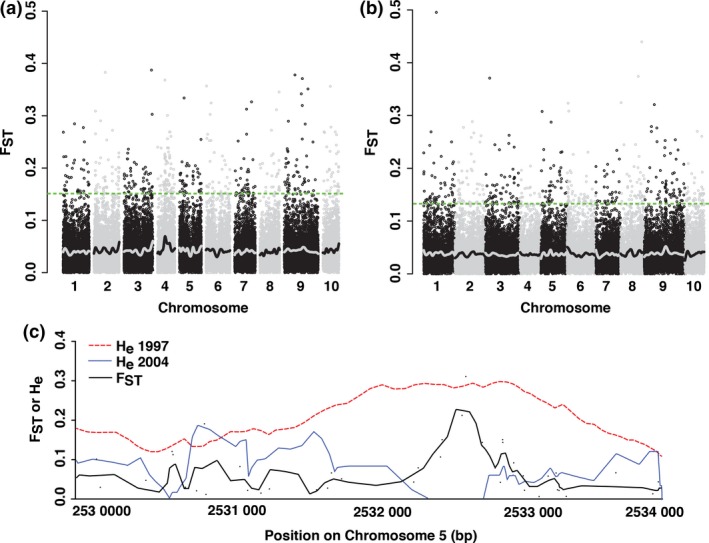
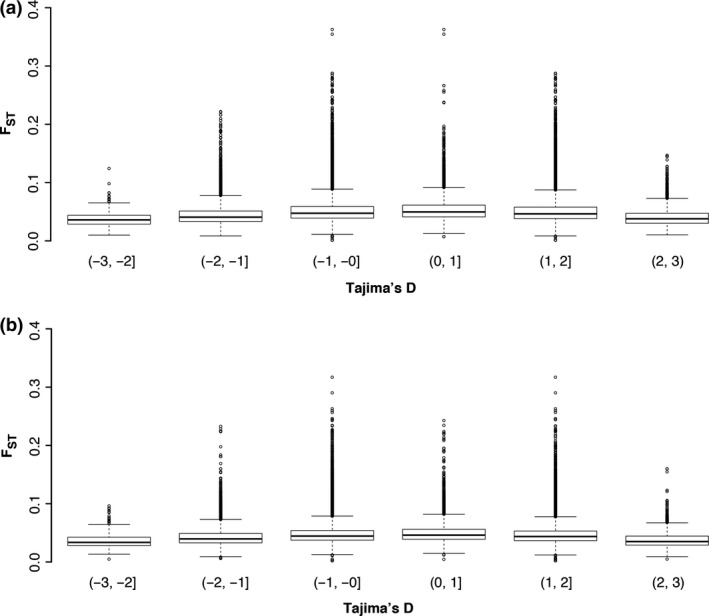
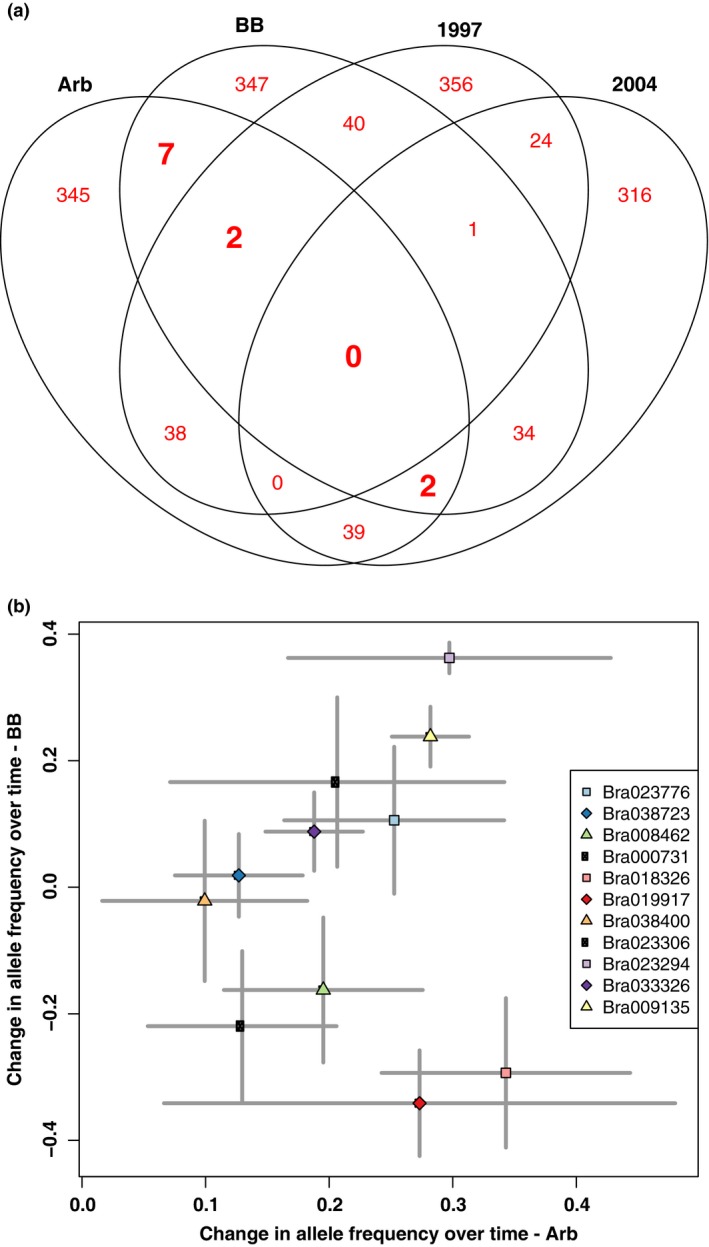
There is increasing evidence that evolution can occur rapidly in response to selection. Recent advances in sequencing suggest the possibility of documenting genetic changes as they occur in populations, thus uncovering the genetic basis of evolution, particularly if samples are available from both before and after selection. Here, we had a unique opportunity to directly assess genetic changes in natural populations following an evolutionary response to a fluctuation in climate. We analysed genome-wide differences between ancestors and descendants of natural populations of Brassica rapa plants from two locations that rapidly evolved changes in multiple phenotypic traits, including flowering time, following a multiyear late-season drought in California. These ancestor-descendant comparisons revealed evolutionary shifts in allele frequencies in many genes. Some genes showing evolutionary shifts have functions related to drought stress and flowering time, consistent with an adaptive response to selection. Loci differentiated between ancestors and descendants (FST outliers) were generally different from those showing signatures of selection based on site frequency spectrum analysis (Tajima's D), indicating that the loci that evolved in response to the recent drought and those under historical selection were generally distinct. Very few genes showed similar evolutionary responses between two geographically distinct populations, suggesting independent genetic trajectories of evolution yielding parallel phenotypic changes. The results show that selection can result in rapid genome-wide evolutionary shifts in allele frequencies in natural populations, and highlight the usefulness of combining resurrection experiments in natural populations with genomics for studying the genetic basis of adaptive evolution.
Keywords: Brassica rapa; adaptation; climate change; contemporary evolution; natural selection; population genomics; rapid evolution.
© 2016 The Authors. Molecular Ecology Published by John Wiley & Sons Ltd.
Figures
Comment in
-
Rapid adaptation to climate change.Mol Ecol. 2016 Aug;25(15):3525-6. doi: 10.1111/mec.13731. Mol Ecol. 2016. PMID: 27463237
References
-
- Balanyá J, Oller JM, Huey RB, Gilchrist GW, Serra L (2006) Global genetic change tracks global climate warming in Drosophila subobscura . Science, 313, 1773–1775. - PubMed
-
- Bierne N, Roze D, Welch JJ (2013) Pervasive selection or is it…? why are FST outliers sometimes so frequent? Molecular Ecology, 22, 2061–2064. - PubMed
-
- Biswas S, Akey JM (2006) Genomic insights into positive selection. Trends in Genetics, 22, 437–446. - PubMed
MeSH terms
Grants and funding
LinkOut - more resources
Full Text Sources
Other Literature Sources
Miscellaneous
