. 2016 Apr 13:6:24354.
doi: 10.1038/srep24354.

GPER signalling in both cancer-associated fibroblasts and breast cancer cells mediates a feedforward IL1β/IL1R1 response

Affiliations

GPER signalling in both cancer-associated fibroblasts and breast cancer cells mediates a feedforward IL1β/IL1R1 response

Paola De Marco et al. Sci Rep. .

Abstract

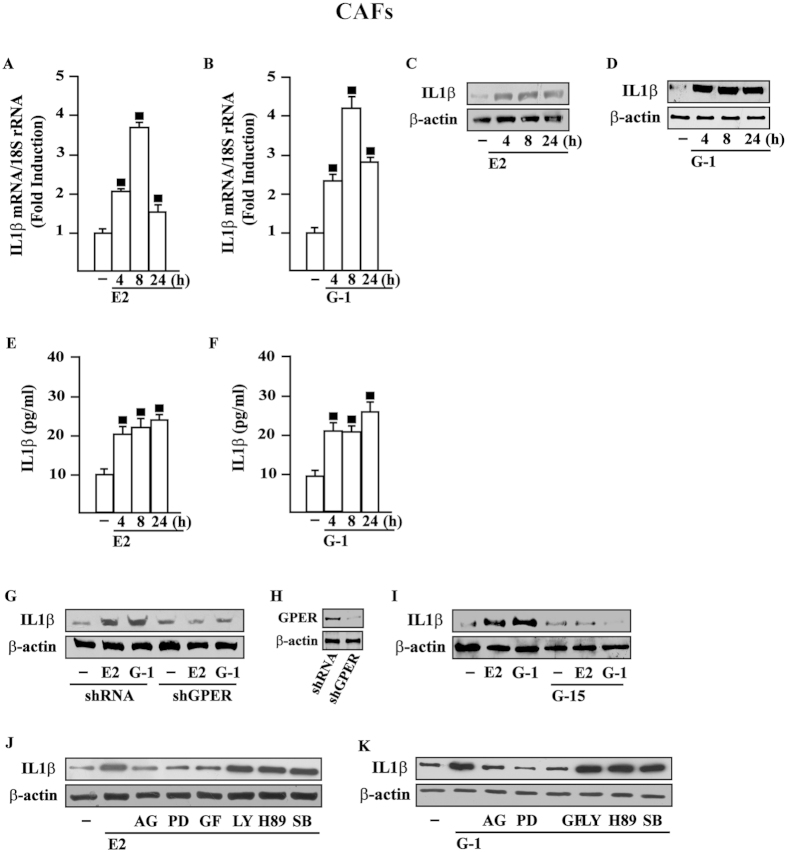
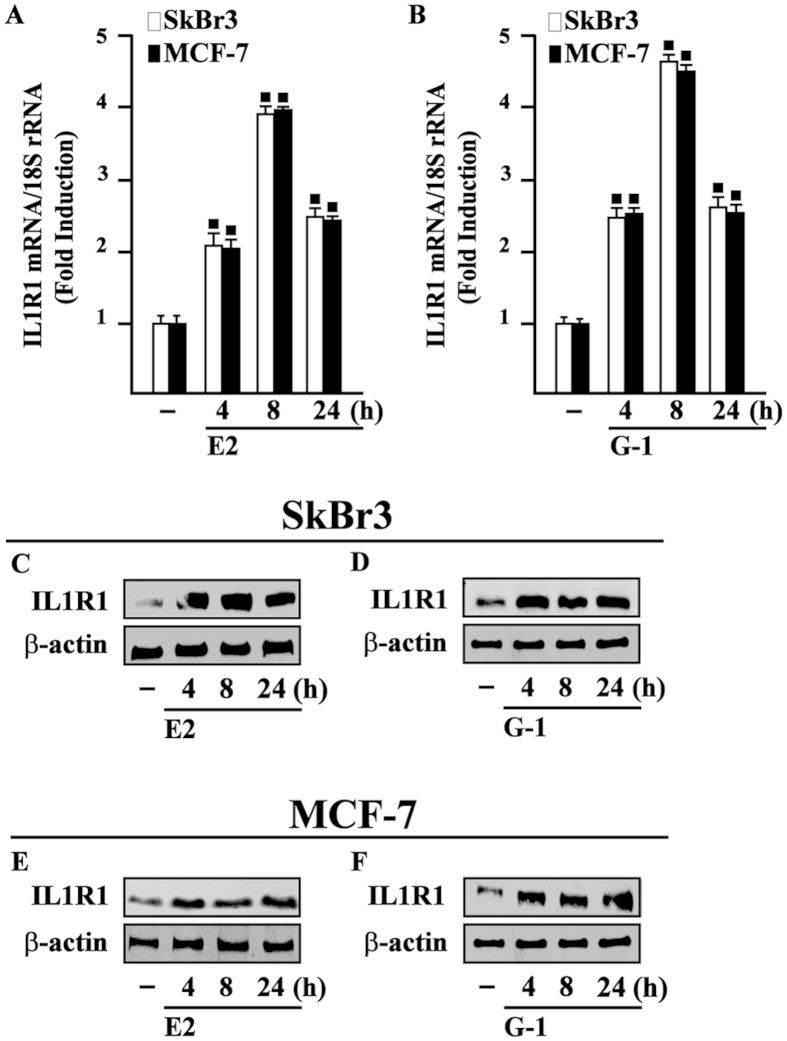
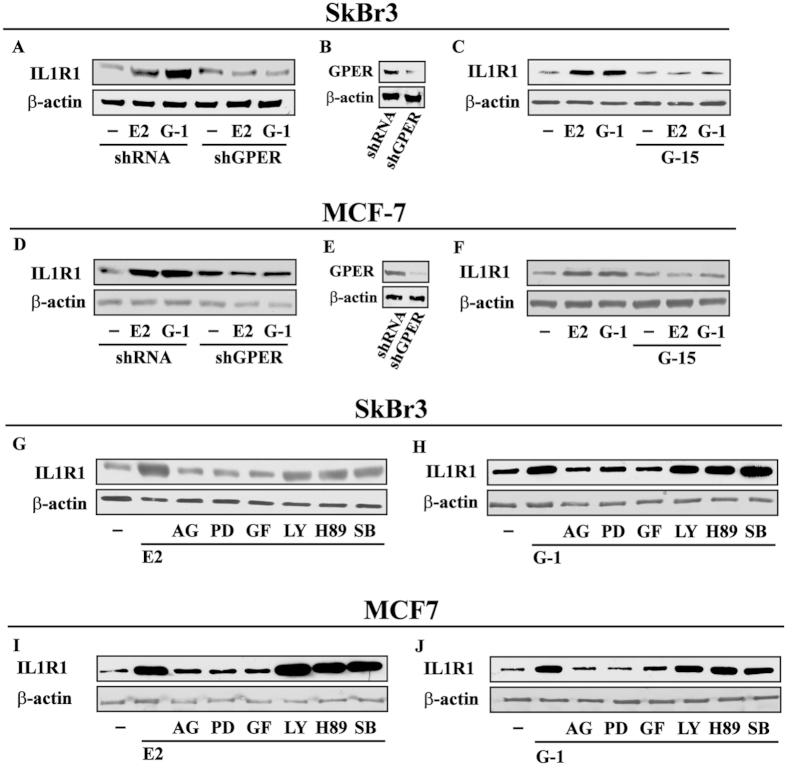
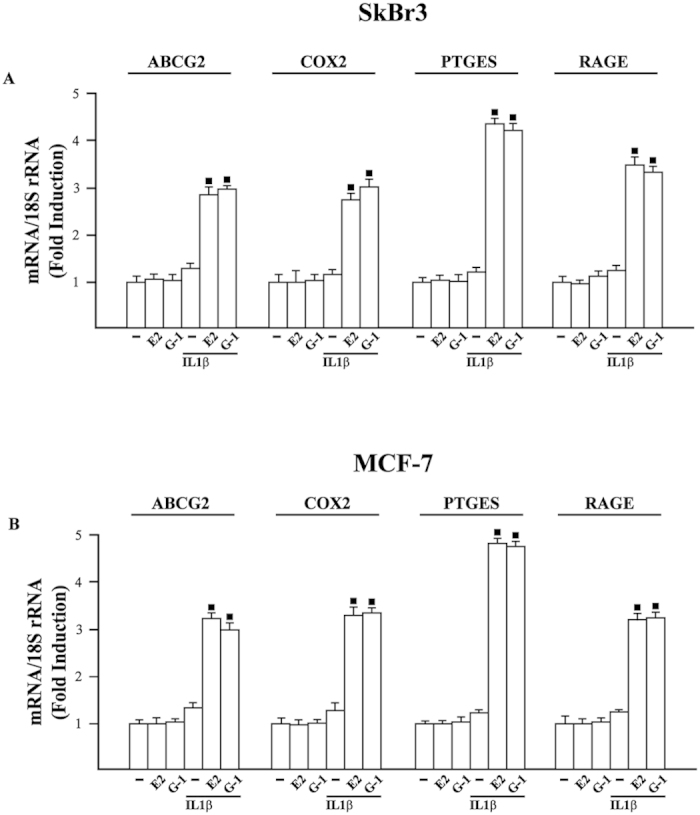
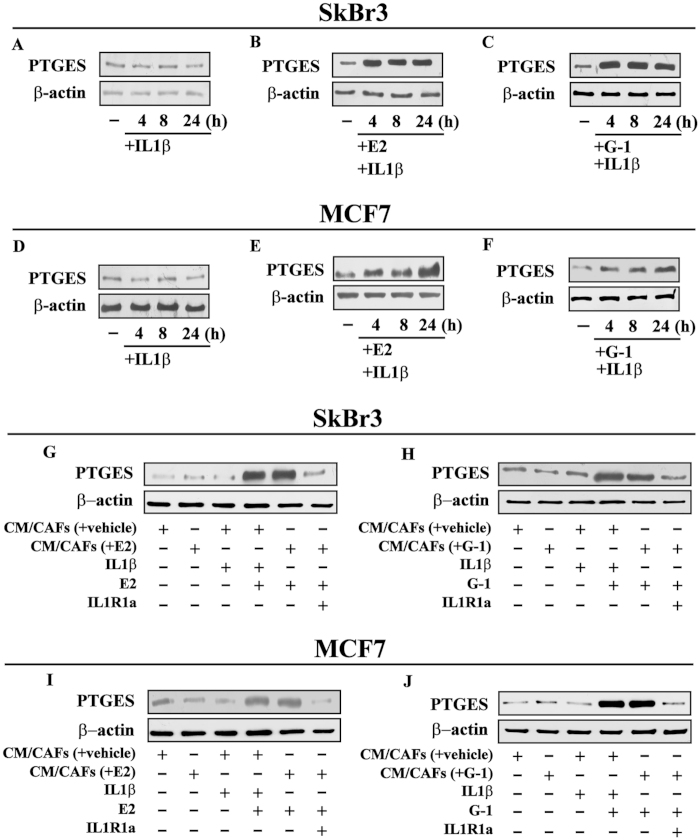
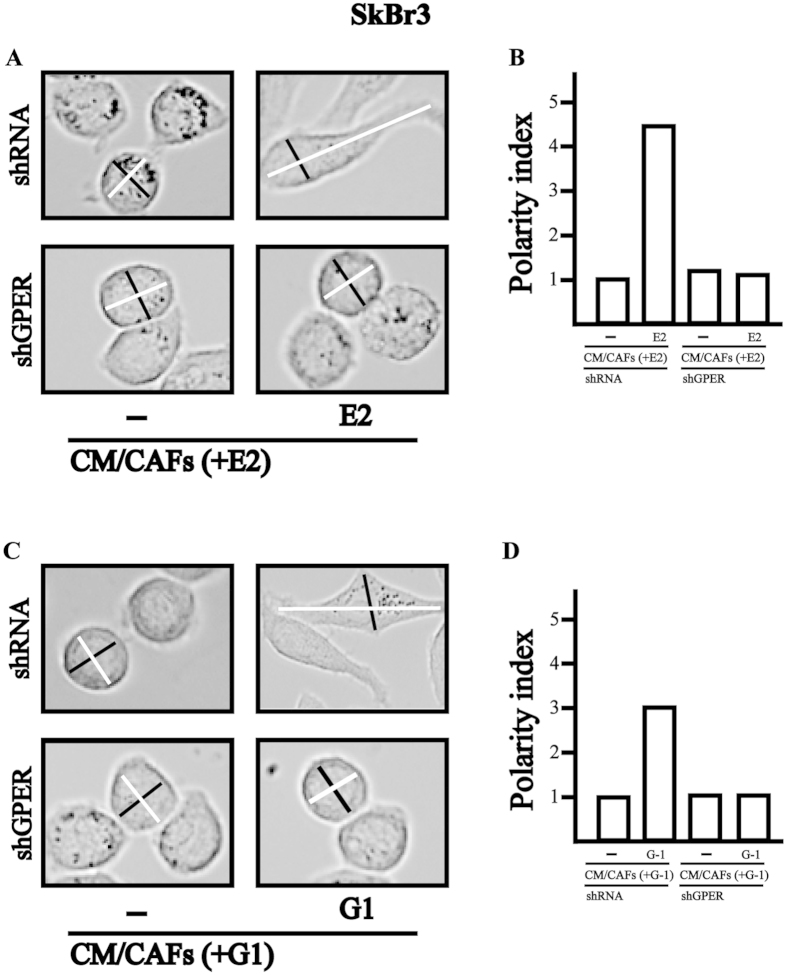
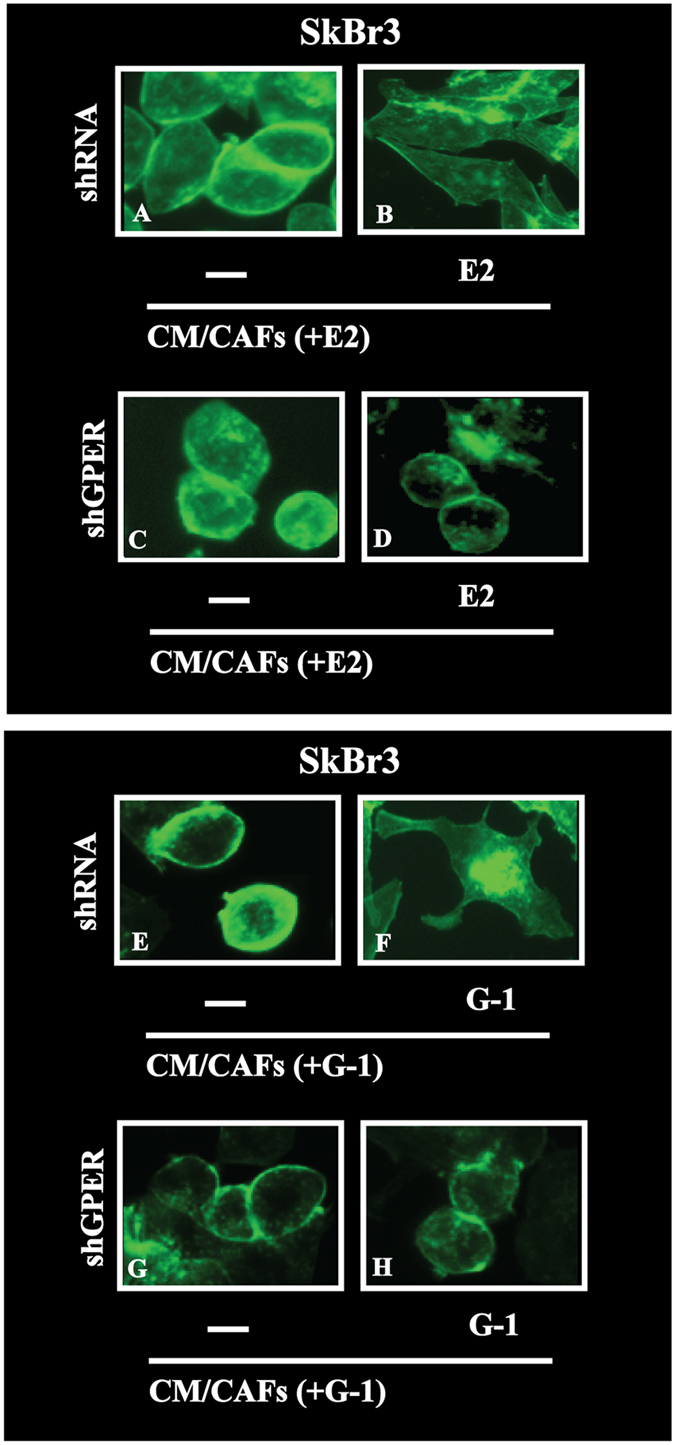
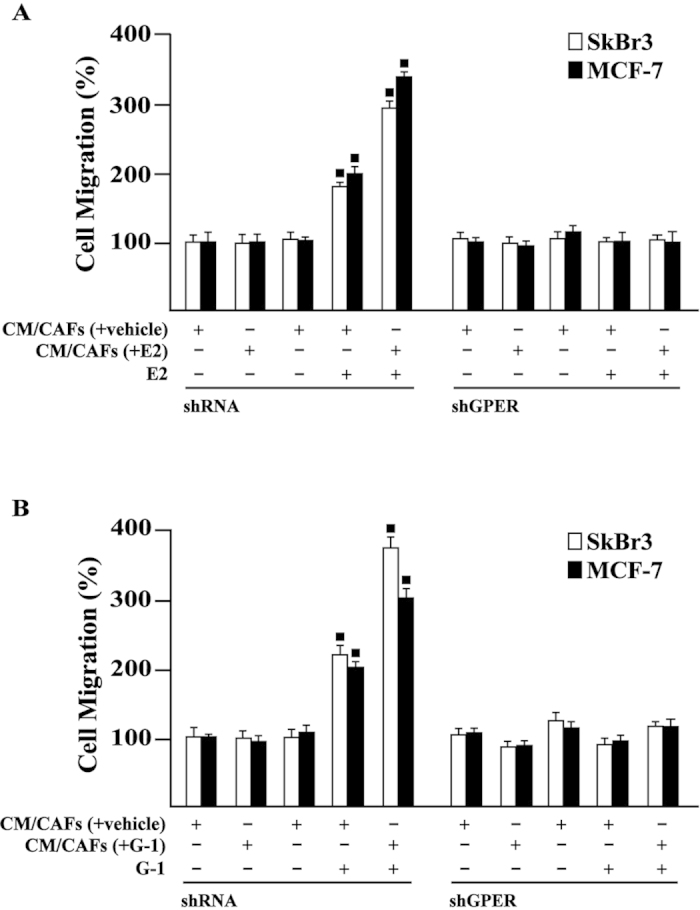
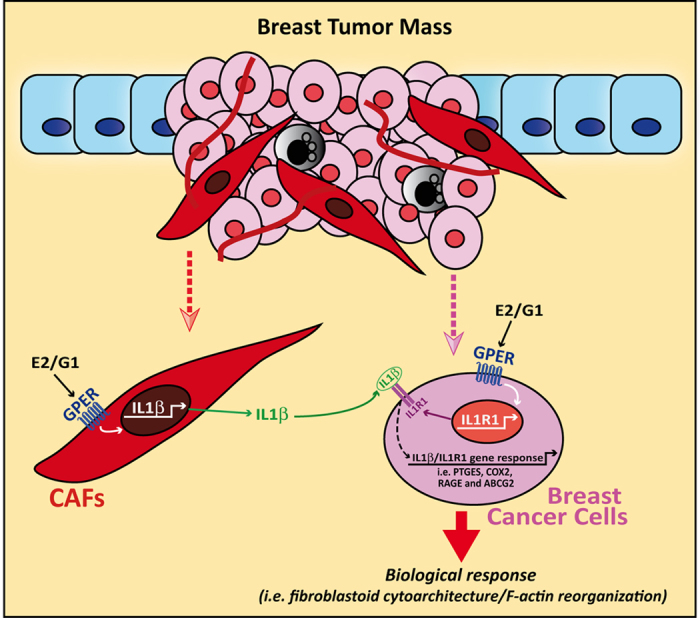
Cancer-associated fibroblasts (CAFs) contribute to the malignant aggressiveness through secreted factors like IL1β, which may drive pro-tumorigenic inflammatory phenotypes mainly acting via the cognate receptor named IL1R1. Here, we demonstrate that signalling mediated by the G protein estrogen receptor (GPER) triggers IL1β and IL1R1 expression in CAFs and breast cancer cells, respectively. Thereby, ligand-activation of GPER generates a feedforward loop coupling IL1β induction by CAFs to IL1R1 expression by cancer cells, promoting the up-regulation of IL1β/IL1R1 target genes such as PTGES, COX2, RAGE and ABCG2. This regulatory interaction between the two cell types induces migration and invasive features in breast cancer cells including fibroblastoid cytoarchitecture and F-actin reorganization. A better understanding of the mechanisms involved in the regulation of pro-inflammatory cytokines by GPER-integrated estrogen signals may be useful to target these stroma-cancer interactions.


Figures

Figure 1
Figure 1. GPER mediates the up-regulation of IL1β expression by E2 and G-1 in CAFs.
10 nM E2 (A) and 100 nM G-1 (B) induce IL1β mRNA expression, as evaluated by real-time PCR. Data obtained in three independent experiments performed in triplicate were normalized to 18S expression and shown as fold changes of IL1β expression upon E2 and G-1 treatments respect to cells exposed to vehicle (−). (◼) p < 0.05 for cells receiving treatments versus vehicle. 10 nM E2 (C) and 100 nM G-1 (D) up-regulate IL1β protein expression, as indicated. (E,F) ELISA of IL-1β in supernatants collected from E2 or G-1 treated CAFs. Data are representative of 5 independent experiments. (G) The up-regulation of IL1β protein levels induced by 10 nM E2 and 100 nM G-1 is abrogated in CAFs transfected for 24 h with shGPER and then treated for 8 h with vehicle (−), 10 nM E2 and 100 nM G-1. (H) Efficacy of GPER silencing. (I) The induction of IL1β protein expression observed upon treatments for 8 h with 10 nM E2 or 100 nM G-1 is abolished using 100 nM GPER antagonist G-15. (J,K) IL1β protein levels in CAFs treated for 8 h with vehicle (−), 10 nM E2 and 100 nM G-1 alone or in combination with 1 μM EGFR inhibitor AG1478 (AG), 1 μM MEK inhibitor PD98059 (PD), 1 μM PKC inhibitor GF109203X (GF), 1 μM PI3K inhibitor LY294,002 (LY), 1 μM PKA inhibitor H89 and 1 μM p38 MAPK inhibitor SB 203580 (SB). β-actin serves as a loading control. Results shown are representative of at least two independent experiments.
Figure 2
Figure 2. E2 and G-1 induce IL1R1 expression in SkBr3 and MCF-7 breast cancer cells.
10 nM E2 (A) and 100 nM G-1 (B) induce the mRNA expression of IL1R1, as evaluated by real-time PCR. Data obtained in three independent experiments performed in triplicate were normalized to 18S expression and shown as fold changes of IL1R1 expression upon E2 and G-1 treatments respect to cells exposed to vehicle (−). (◼) p < 0.05 for cells receiving treatments versus vehicle. Evaluation of IL1R1 protein expression in SkBr3 (C,D) and MCF-7 cells (E,F) treated with 10 nM E2 and 100 nM G-1, as indicated. β-actin serves as a loading control. Results shown are representative of at least two independent experiments.
Figure 3
Figure 3. GPER mediates the up-regulation of IL1R1 expression by E2 and G-1 in SkBr3 and MCF-7 breast cancer cells.
(A) The up-regulation of IL1R1 protein levels upon treatment for 8 h with 10 nM E2 and 100 nM G-1 is abrogated transfecting SkBr3 cells for 24 h with shGPER. (B) Efficacy of GPER silencing. (C) The induction of IL1R1 protein expression observed treating SkBr3 cells for 8 h with 10 nM E2 and 100 nM G-1 is abolished in the presence of 100 nM GPER antagonist G-15. (D) The up-regulation of IL1R1 protein levels upon treatment for 8 h with 10 nM E2 and 100 nM G-1 is abrogated transfecting MCF-7 cells for 24 h with shGPER. (E) Efficacy of GPER silencing. (F) The induction of IL1R1 protein expression observed treating MCF-7 cells for 8 h with 10 nM E2 and 100 nM G-1 is abolished in the presence of 100 nM GPER antagonist G-15. IL1R1 protein levels in SkBr3 cells treated for 8 h with 10 nM E2 (G) and 100 nM G-1 (H) alone or in combination with 1 μM EGFR inhibitor AG1478 (AG), 1 μM MEK inhibitor PD98059 (PD), 1 μM PKC inhibitor GF109203X (GF), 1  μM PI3K inhibitor LY294,002 (LY), 1 μM PKA inhibitor H89 and 1 μM p38 MAPK inhibitor SB 203580 (SB). IL1R1 protein levels in MCF-7 cells treated for 8 h with 10 nM E2 (I) and 100 nM G-1 (J) alone or in combination with 1 μM EGFR inhibitor AG, 1 μM MEK inhibitor PD, 1 μM PKC inhibitor GF, 1 μM PI3K inhibitor LY, 1 μM PKA inhibitor H89 and 1 μM p38 MAPK inhibitor SB. β-actin serves as a loading control. Results shown are representative of at least two independent experiments.
Figure 4
Figure 4
mRNA expression of ABCG2, COX2, PTGES and RAGE evaluated by real-time PCR in SkBr3 (A) and MCF-7 (B) cells treated for 8 h with vehicle (−), 10 nM E2, 100 nM G-1 and 10 ng/ml IL1β. Cells were also treated for 8 h with 10 nM E2 and 100 nM G-1 before the treatment for 8 h with 10 ng/ml IL1β, as indicated. Results obtained from three independent experiments performed in triplicate were normalized for 18S expression and shown as fold change of RNA expression respect to cells treated with vehicle. (◼) p < 0.05 for cells receiving treatments versus vehicle.
Figure 5
Figure 5
PTGES protein expression in SkBr3 (AC) and MCF-7 (DF) cells treated with 10 ng/ml IL1β alone or treated for 8 h with 10 nM E2 or 100 nM G-1 and then exposed to 10 ng/ml IL1β, as indicated. Protein levels of PTGES in SkBr3 (G,H) and MCF-7 (IJ) cells treated for 8 h with 10 nM E2 or 100 nM G-1 and then switched for additional 8 h to medium without serum in the presence of 10 ng/ml IL1β or conditioned medium collected from CAFs (CM/CAFs) treated for 8 h with vehicle [CM/CAFs (+vehicle)], 10 nM E2 [CM/CAFs (+E2)] and 100 nM G-1 [CM/CAFs (+G-1)]. SkBr3 and MCF-7 cells treated for 8 h with 10 nM E2 or 100 nM G-1 were also exposed to [CM/CAFs (+E2)] and [CM/CAFs (+G-1)] alone or in combination with 1 μM IL1R1 antagonist namely IL1R1a. β-actin serves as a loading control. Results shown are representative of at least two independent experiments.
Figure 6
Figure 6
(AD) SkBr3 cells were transfected for 24 h with shRNA or shGPER, treated for 8 h with vehicle (−), 10 nM E2 or 100 nM G-1 and then exposed for additional 8 h to conditioned medium collected from CAFs stimulated for 8 h with 10 nM E2 [CM/CAFs (+E2)] or 100 nM G-1 [CM/CAFs (+G-1)]. In panels (A,C) lines traced on cells were used to calculate the polarity index. White lines correspond to the migratory axis (MAx) and black lines to the transversal axis (TAx). In panels B and D, the polarity index (white migratory axis divided by black transversal axis) quantitatively defines the morphology of the migratory cell shown. Polarity Index =1.0 defines a polygonal shape, whereas a value >1.0 defines ranges of migratory shapes. Images shown are representative of 30 random fields obtained in three independent experiments.
Figure 7
Figure 7
Actin cytoskeleton reorganization in SkBr3 cells transfected for 24 h with shRNA or shGPER and then treated for 8 h with vehicle (−) and 10 nM E2 (AD) or vehicle (−) and 100 nM G-1 (EH) before to be exposed for additional 8 h to conditioned medium collected from CAFs treated for 8 h with 10 nM E2 [CM/CAFs (+E2)] or 100 nM G-1 [CM/CAFs (+G-1)]. Cells were stained with Phalloidin-Fluorescent Conjugate (Santa Cruz Biotechnology) to visualize F-actin and analyzed using the Cytation 3 Cell Imaging Multimode Reader (BioTek, Winooski, VT). Images shown are representative of 30 random fields obtained in three independent experiments.
Figure 8
Figure 8
Migration assays performed by Boyden Chamber assay in SkBr3 and MCF-7 cells transfected for 24 h with shRNA or shGPER and then treated for 8 h with vehicle (−) and 10 nM E2 (A) or vehicle (−) and 100 nM G-1 (B) before to be exposed for additional 8 h to conditioned medium collected from CAFs treated for 8 h with vehicle, 10 nM E2 [CM/CAFs (+E2)] or 100 nM G-1 [CM/CAFs (+G-1)]. Each data point is the average ± SD of three independent experiments performed in triplicate. (◼) p < 0.05 for cells receiving treatments versus vehicle.
Figure 9
Figure 9. Schematic representation of ligand-activated GPER that generates a feedforward loop coupling IL1β induction by CAFs to IL1R1 expression by cancer cells, toward the induction of IL1β/IL1R1 target genes and biological responses as well as invasive features in breast cancer cells as fibroblastoid cytoarchitecture and F-actin reorganization.

Similar articles

Cited by

References

    1. Erez N., Glanz S., Raz Y., Avivi C. & Barshack I. Cancer associated fibroblasts express pro-inflammatory factors in human breast and ovarian tumors. Biochem Biophys Res. Commun. 437, 397–402 (2013). - PubMed
    1. Han Y., Zhang Y., Jia T. & Sun Y. Molecular mechanism underlying the tumor-promoting functions of carcinoma-associated fibroblasts. Tumor Biol. 36, 1385–1394 (2015). - PubMed
    1. Kalluri R. & Zeisberg M. Fibroblasts in cancer. Nature Rev Cancer 6, 392–401 (2006). - PubMed
    1. Ma X. J., Dahiya S., Richardson E., Erlander M. & Sgroi D. C. Gene expression profiling of the tumor microenvironment during breast cancer progression. Breast Cancer Res. 11, R7 (2009). - PMC - PubMed
    1. Servais C. & Erez N. From sentinel cells to inflammatory culprits: cancer-associated fibroblasts in tumour-related inflammation. J. Pathol. 229, 198–207 (2013). - PubMed

Publication types