. 2016 Jul;5(7):1444-53.
doi: 10.1002/cam4.720. Epub 2016 Apr 12.

Organotypic slice cultures of human gastric and esophagogastric junction cancer

Affiliations

Organotypic slice cultures of human gastric and esophagogastric junction cancer

Justus Koerfer et al. Cancer Med. 2016 Jul.

Abstract

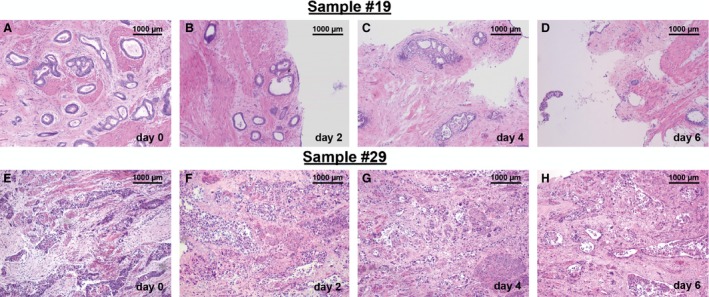
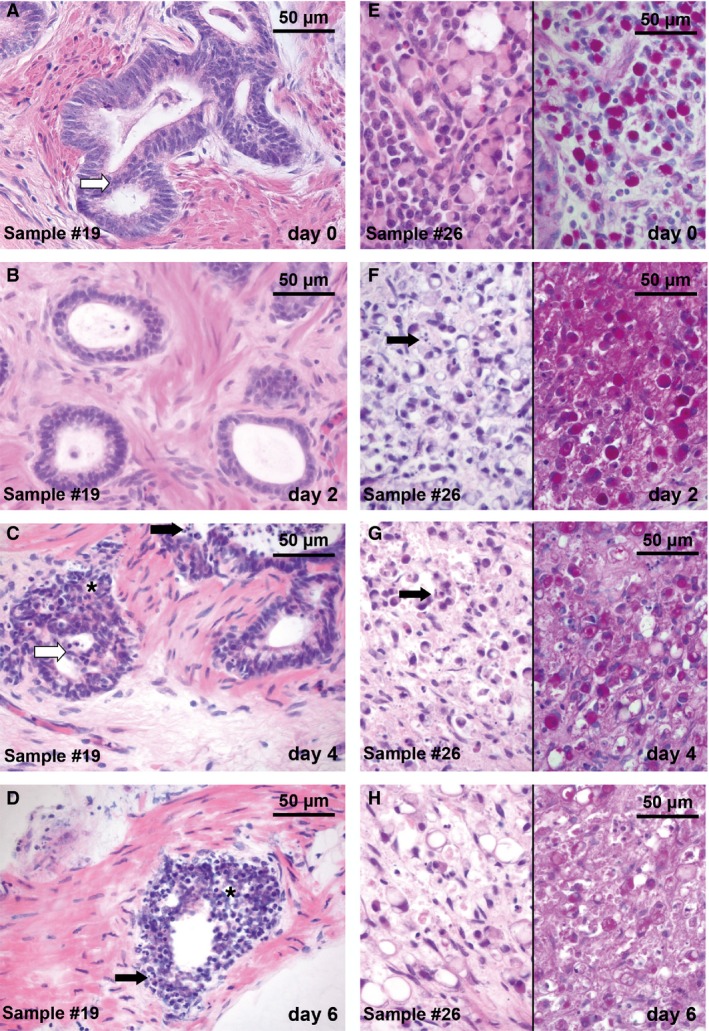
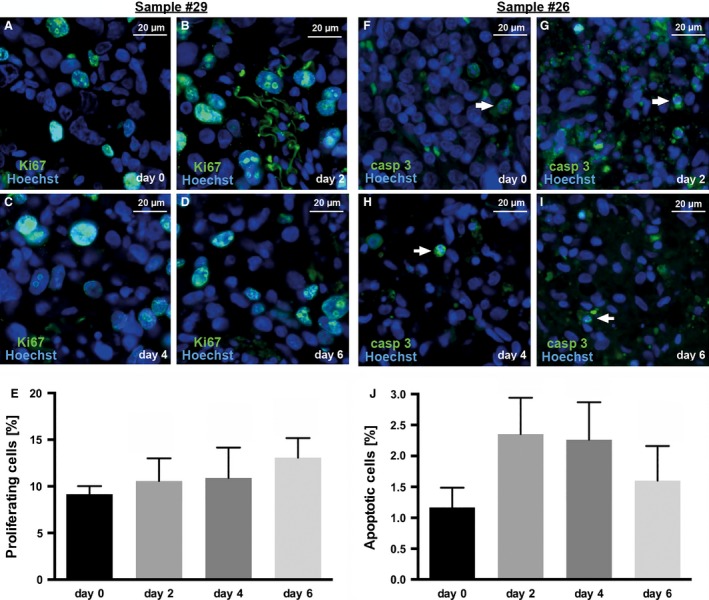
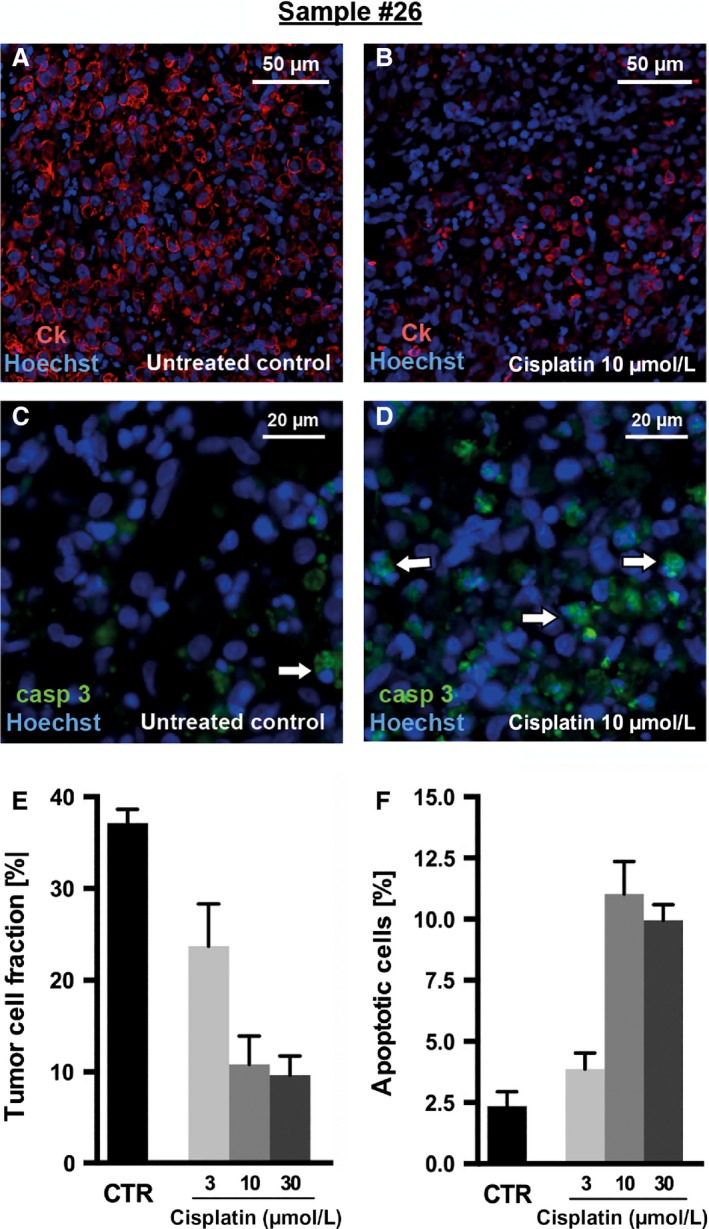
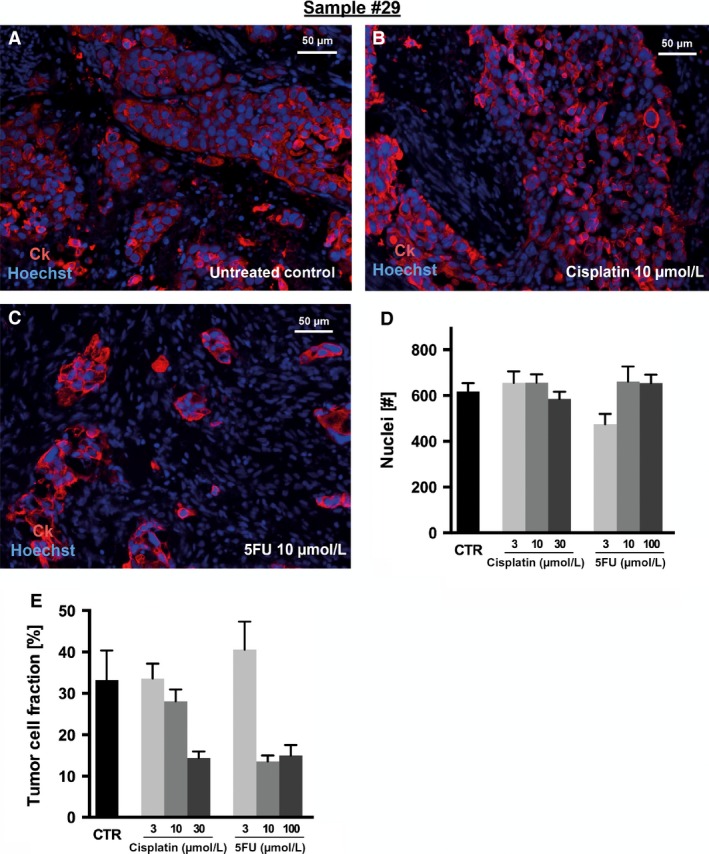
Gastric and esophagogastric junction cancers are heterogeneous and aggressive tumors with an unpredictable response to cytotoxic treatment. New methods allowing for the analysis of drug resistance are needed. Here, we describe a novel technique by which human tumor specimens can be cultured ex vivo, preserving parts of the natural cancer microenvironment. Using a tissue chopper, fresh surgical tissue samples were cut in 400 μm slices and cultivated in 6-well plates for up to 6 days. The slices were processed for routine histopathology and immunohistochemistry. Cytokeratin stains (CK8, AE1/3) were applied for determining tumor cellularity, Ki-67 for proliferation, and cleaved caspase-3 staining for apoptosis. The slices were analyzed under naive conditions and following 2-4 days in vitro exposure to 5-FU and cisplatin. The slice culture technology allowed for a good preservation of tissue morphology and tumor cell integrity during the culture period. After chemotherapy exposure, a loss of tumor cellularity and an increase in apoptosis were observed. Drug sensitivity of the tumors could be assessed. Organotypic slice cultures of gastric and esophagogastric junction cancers were successfully established. Cytotoxic drug effects could be monitored. They may be used to examine mechanisms of drug resistance in human tissue and may provide a unique and powerful ex vivo platform for the prediction of treatment response.

Keywords: Chemosensitivity; esophagogastric junction cancer; gastric cancer; organotypic slice cultures; personalized treatment.


Figures

Figure 1
Figure 1
Overview of histopathology of cultured tissue slices derived from GC and AEG surgical specimen. Tissue slices derived from GC (A–D) and AEG (E–H) surgical specimens were cut in 400 μm thick slices and kept ex vivo over 2, 4, and 6 days. Slices were processed to paraffin sections (7 μm) and stained with H&E. Low magnification pictures show an overview of cultured tissue. Initial gland structures and tissue morphology can be observed also at day 2, 4, and 6 in vitro (A–D). Density of glands is reduced at day 6 (D). Original magnification: 100× in (A–H).
Figure 2
Figure 2
Histopathology of cultured tissue slices derived from GC surgical specimen. Tissue was cut in 400 μm thick slices and kept ex vivo over 2, 4, and 6 days. Slices were processed to paraffin sections (7 μm) and stained with H&E (A–D and E–H, left column) and PAS (E–H, right column). Two different tumor samples derived from surgical specimens are shown: intestinal subtype (A–D) and diffuse subtype (E–H). Slice cultures revealed a good preservation of tissue morphology and tumor cell integrity compared with day 0. (A) Gland‐forming structures, pleomorphic nuclei, and a shifted nuclear/cytoplasmic ratio characterize the intestinal subtype. (B–D) These features persisted during the culture period up to day 4 in vitro. Intraluminal bridges (A; white arrow) and a change of gland formation structures (C, D; *) were observed. Apoptotic bodies (C, D, F, G; black arrow) were detectable during cultivation. (E–H) Mucin‐containing signet‐ring cells (pink stain in PAS) signify the diffuse subtype. Morphology of signet ring cells remained stable (G) until day 4 in vitro. Original magnification: 400× in (A–H).
Figure 3
Figure 3
Quantification of total cell number and tumor cellularity. Panels (A–B) show tumor cellularity of all analyzed cases, while panels (C–H) display observations in one selected case (sample #25). (A) Four patients had received neoadjuvant chemotherapy prior to the sampling of tumor for slice cultivation and (B) four patients had not received any neoadjuvant treatment. In five cases (13, 15, 17, 25, 29), a stable tumor cell fraction until day 6 was observed. Three cases (14, 19, 26) revealed a distinct decrease in tumor cellularity between day 2 and day 4. (C–F) Slice cultures of sample #25 revealed a good preservation of tissue morphology and tumor cell integrity over 2, 4, and 6 days compared with day 0. Stromal cells were dominant in this tumor and the diffuse tumor pattern was difficult to distinguish in H&E stains. Quantification was therefore carried out on the basis of immunohistochemistry (right side). Tumor cells were detected with cytokeratin (CK) antibodies (red) which was combined with nuclear counterstaining (Hoechst 33342, blue). (G) Total cell number remained stable at all culture time points compared with day 0. (H) The tumor cell fraction decreased significantly in this particular case within the first 2 days of cultivation, but remained stable for the further culture period. Fluorescent microscopy, original magnification: 200× in C–F. ±SEM,= 6.
Figure 4
Figure 4
Proliferation (A–E) and apoptosis (F–J) indices in slice cultures of one human AEG (A–E) and one GC (F–J) specimen over a 6‐day culture period without cytotoxic drug exposure. (A–D) Proliferating cells were visualized using Ki‐67 staining (green) and (F–I) apoptotic cells were visualized using caspase‐3 staining (green) and were combined with nuclear counterstaining (Hoechst 33342; blue). (E) The proliferation indices did not show a decrease during the culture period proving a stable cell viability of cultured slices. (F–I) Basal apoptosis (white arrows) was observed at day 0 and every culture time point. (J) No significant increase in apoptotic cells was detected during the culture period. Fluorescent microscopy, original magnification: 400× in A–I, ±SEM, n = 3.
Figure 5
Figure 5
Effects of cytotoxic drug exposure in GC slice cultures. Slices from sample #26 were incubated with cisplatin and 5‐FU over 2 days and were then fixed and processed to paraffin sections (7 μm). (A–B) Tumor cells were visualized using cytokeratin (CK) staining (red); (C–D) apoptotic cells were visualized using caspase‐3 staining (green). Both were combined with nuclear counterstaining (Hoechst 33342; blue) for quantitative analysis. (A) Untreated controls showed a dense and compact tumor cellularity, whereas (B) treated slices revealed a massive loss of tumor cells. (C) Compared to a minimal number of apoptotic cells (white arrows) in the untreated control, (D) treatment led to increased apoptosis. The loss of tumor cells after chemotherapy and the increase in apoptotic cells are illustrated in the bar graphs (E, F). Fluorescent microscopy, original magnification: 200× in A–B and 400× in C–D, ±SEM,= 6 (CK), n = 3 (caspase‐3).
Figure 6
Figure 6
Tumor cellularity after cytotoxic drug exposure of AEG slice cultures. Slices from sample #29 were incubated with cisplatin and 5‐FU over 2 days and were then fixed and processed to paraffin sections (7 μm). (A–C) Tumor cells were visualized using cytokeratin (CK) staining (red) and were combined with nuclear counterstaining (Hoechst 33,342; blue) for quantitative analysis. (A) Untreated controls revealed a dense and compact tumor cellularity which was not altered by exposure to (B) cisplatin 10 μmol/L, whereas (C) 5‐FU 10 μmol/L led to a massive loss of tumor cells. (D) The total number of nuclei was not reduced, neither by cisplatin nor by 5‐FU. (E) Tumor cellularity decreased upon treatment with higher concentrations of cisplatin (30 μmol/L), while 3 or 10 μmol/L cisplatin showed no effect on tumor cellularity. (E) A reduction in tumor cellularity after 5‐FU treatment was observed at a concentration of 10 μmol/L or higher but not at the lower concentration. Fluorescent microscopy, original magnification: 200× in A–C, ±SEM, n = 6.

References

    1. Lordick, F. , Lorenzen S., Yamada Y., and Ilson D.. 2014. Optimal chemotherapy for advanced gastric cancer: is there a global consensus? Gastric Cancer Off. J. Int. Gastric Cancer Assoc. Jpn. Gastric Cancer Assoc. 17:213–225. - PubMed
    1. Cunningham, D. , Allum W. H., Stenning S. P., Thompson J. N., Van de Velde C. J. H., Nicolson M., et al. 2006. Perioperative chemotherapy versus surgery alone for resectable gastroesophageal cancer. N. Engl. J. Med. 355:11–20. - PubMed
    1. Ychou, M. , Boige V., Pignon J.‐P., Conroy T., Bouché O., Lebreton G., et al. 2011. Perioperative chemotherapy compared with surgery alone for resectable gastroesophageal adenocarcinoma: an FNCLCC and FFCD multicenter phase III trial. J. Clin. Oncol. Off. J. Am. Soc. Clin. Oncol. 29:1715–1721. - PubMed
    1. Van Hagen, P. , Hulshof M. C. C. M., van Lanschot J. J. B., Steyerberg E. W., van Berge Henegouwen M. I., Wijnhoven B. P. L., et al. 2012. Preoperative chemoradiotherapy for esophageal or junctional cancer. N. Engl. J. Med. 366:2074–2084. - PubMed
    1. Smalley, S. R. , Benedetti J. K., Haller D. G., Hundahl S. A., Estes N. C., Ajani J. A., et al. 2012. Updated analysis of SWOG‐directed intergroup study 0116: a phase III trial of adjuvant radiochemotherapy versus observation after curative gastric cancer resection. J. Clin. Oncol. Off. J. Am. Soc. Clin. Oncol. 30:2327–2333. - PMC - PubMed

Publication types

MeSH terms