. 2016 Apr 12;7(2):e00020-16.
doi: 10.1128/mBio.00020-16.

Cytosolic Replication of Group A Streptococcus in Human Macrophages

Affiliations

Cytosolic Replication of Group A Streptococcus in Human Macrophages

Alan M O'Neill et al. mBio. .

Erratum in

Abstract

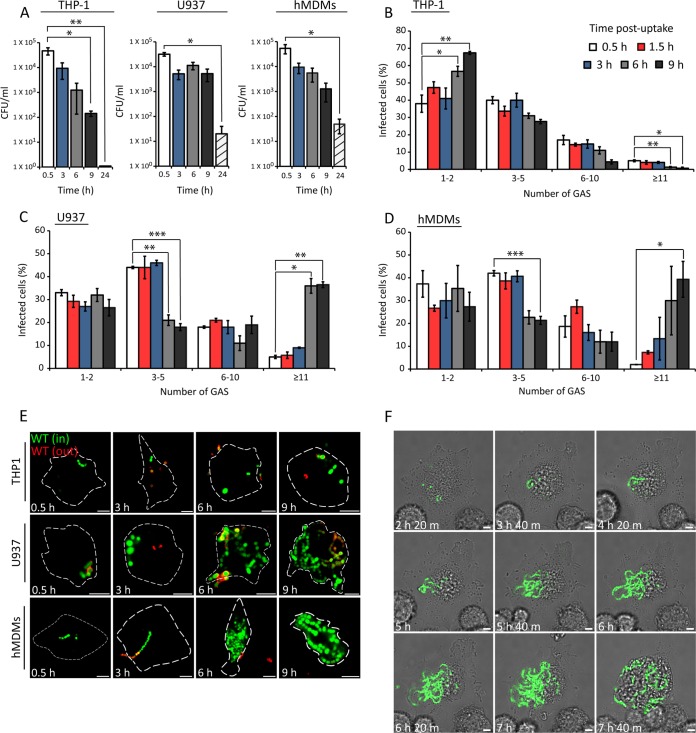
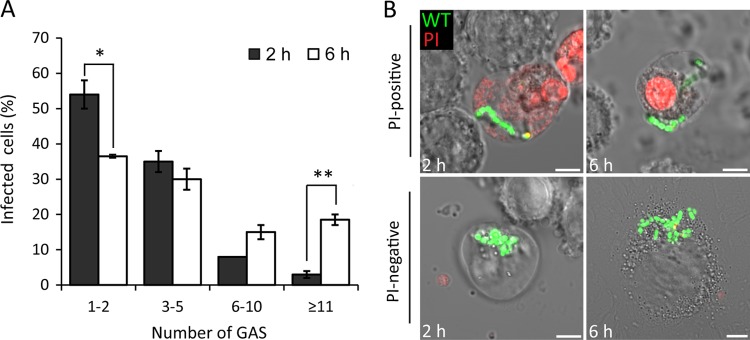
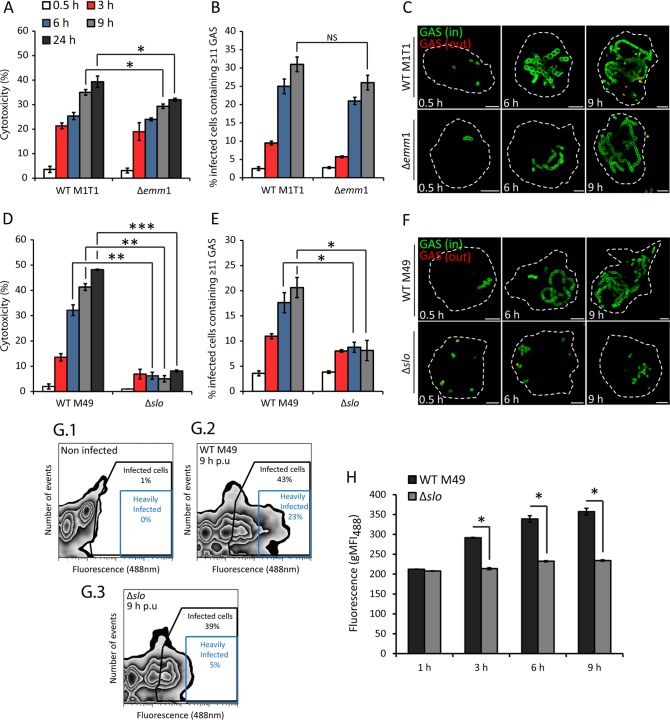
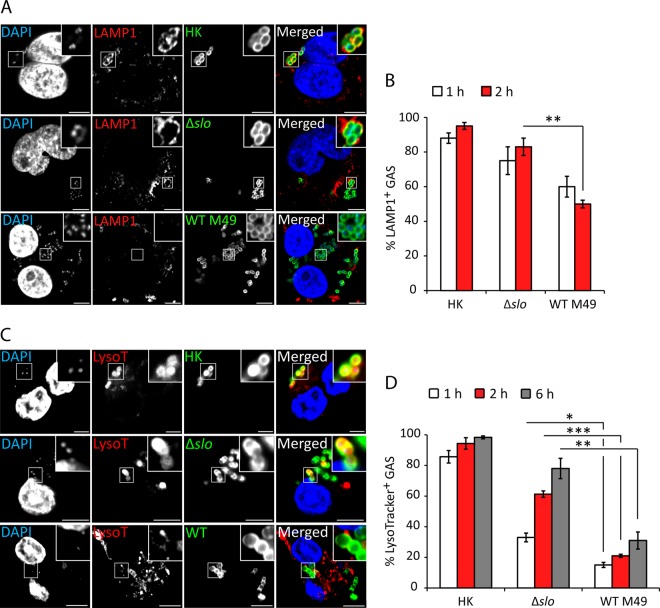
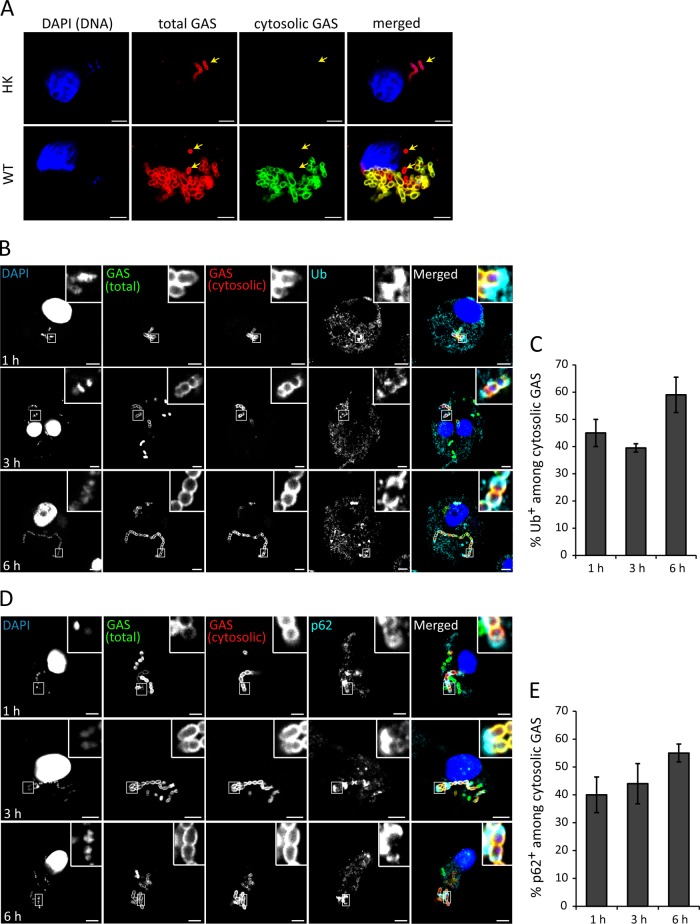
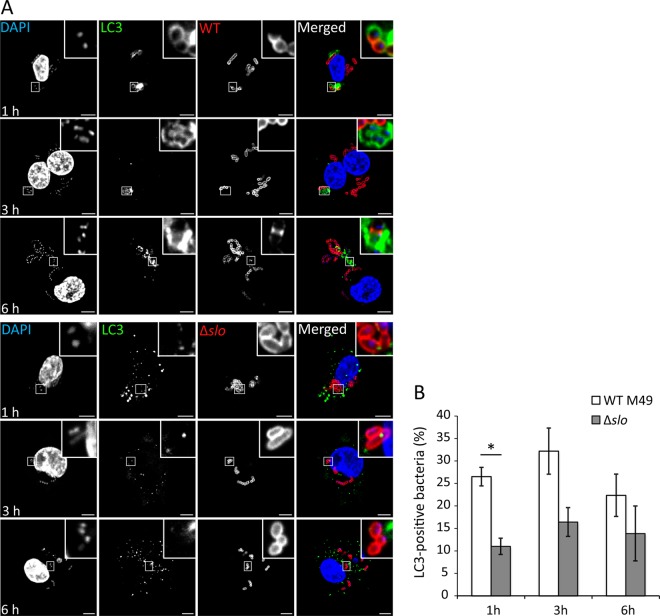
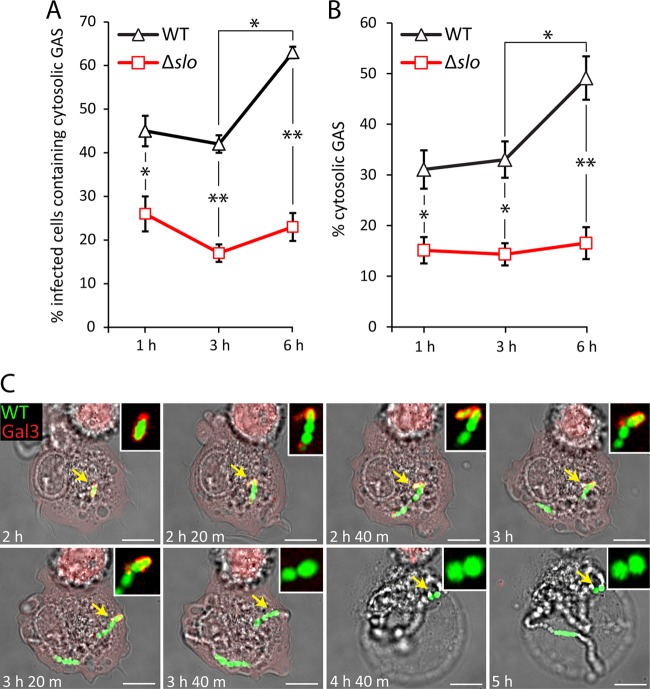
As key components of innate immune defense, macrophages are essential in controlling bacterial pathogens, including group A Streptococcus(GAS). Despite this, only a limited number of studies have analyzed the recovery of GAS from within human neutrophils and macrophages. Here, we determined the intracellular fate of GAS in human macrophages by using several quantitative approaches. In both U937 and primary human macrophages, the appearance over time of long GAS chains revealed that despite GAS-mediated cytotoxicity, replication occurred in viable, propidium iodide-negative macrophages. Whereas the major virulence factor M1 did not contribute to bacterial growth, a GAS mutant strain deficient in streptolysin O (SLO) was impaired for intracellular replication. SLO promoted bacterial escape from the GAS-containing vacuole (GCV) into the macrophage cytosol. Up to half of the cytosolic GAS colocalized with ubiquitin and p62, suggesting that the bacteria were targeted by the autophagy machinery. Despite this, live imaging of U937 macrophages revealed proficient replication of GAS after GCV rupture, indicating that escape from the GCV is important for growth of GAS in macrophages. Our results reveal that GAS can replicate within viable human macrophages, with SLO promoting GCV escape and cytosolic growth, despite the recruitment of autophagy receptors to bacteria.

Importance: Classically regarded as an extracellular pathogen, GAS can persist within human epithelial cells, as well as neutrophils and macrophages. Some studies suggest that GAS can modulate its intracellular vacuole to promote survival and perhaps replicate in macrophages. However, an in-depth single-cell analysis of the dynamics of survival and replication is lacking. We used macrophage-like cell lines and primary macrophages to measure the intracellular growth of GAS at both the population and single-cell levels. While CFU counts revealed no increase in overall bacterial growth, quantitative fluorescence microscopy, flow cytometry, and time-lapse imaging revealed bacterial replication in a proportion of infected macrophages. This study emphasizes the importance of single-cell analysis especially when studying the intracellular fate of a pathogen that is cytotoxic and displays heterogeneity in terms of intracellular killing and growth. To our knowledge, this study provides the first direct visualization of GAS replication inside human cells.


Figures

FIG 1
FIG 1
Quantification of intracellular M1T1 GAS in human macrophages. (A) Survival of M1T1 5448 GAS in the cell lines indicated. Cells were infected at an MOI of 5, and intracellular bacteria were measured by CFU counting at the time points indicated. The mean ± SEM of three independent experiments in triplicate wells and duplicate colony counts is shown. (B to D) Quantification of intracellular GFP-M1T1 5448 in the cell lines indicated. Cells were infected at an MOI of 0.5, and the percentage of cells containing 1 or 2, 3 to 5, 6 to 10, or ≥11 bacteria per infected cell was scored by fluorescence microscopy. The numbers of bacteria in at least 100 infected cells per experiment were determined. The mean ± SEM of at least three independent experiments is shown. *, P < 0.05; **, P < 0.01; ***, P < 0.001 (two-tailed paired t test). (E) Representative confocal microscopy images of macrophages infected with GFP-M1T1 5448 GAS at the time points indicated. Intracellular bacteria (in) were discriminated from extracellular bacteria (out) by differential labeling with an anti-GAS primary antibody and an Alexa Fluor 555-conjugated secondary antibody (red) without cell permeabilization (scale bars, 5 µm). Cell outlines are delineated by broken white lines. (F) Stills from live confocal imaging of U937 cells infected with GFP-M1T1 5448 at an MOI of 0.5. Imaging was initiated at 2 hpu, and the cells were imaged every 20 min until 10 hpu. The elapsed time is shown at the bottom left of each image (scale bars, 5 µm).
FIG 2
FIG 2
Growth of M1T1 GAS in PI-negative U937 cells. (A) Quantification of intracellular GFP-M1T1 5448 in PI-negative cells at 2 and 6 hpu. The number of bacteria in at least 50 infected cells per experiment was determined (mean ± SEM, n = 3). (B) Representative confocal microscopy images of PI-positive (red) or PI-negative cells infected with GFP-M1T1 5448 at the time points indicated (scale bars, 5 µm). *, P < 0.05; **, P < 0.01 (two-tailed paired t test).
FIG 3
FIG 3
SLO is required for intracellular replication of GAS. (A) Cytotoxicity of isogenic WT M1T1 5448 and the Δemm1 mutant presented as a percentage of the maximum LDH release. The means ± SEM of three independent experiments in triplicate wells are shown. (B) U937 macrophages were infected with WT M1T1 5448 or the Δemm1 mutant, and the percentage of infected cells containing ≥11 bacteria was determined. The bacteria in at least 100 infected cells per experiment were counted. NS, not significant. (C) Representative confocal microscopy images of U937 cells infected with WT M1T1 5448 or the Δemm1 mutant at the time points indicated. Intracellular bacteria (in) were discriminated from extracellular bacteria (out) by differential labeling with an anti-GAS primary antibody and an Alexa Fluor 555-conjugated secondary antibody (red) without permeabilization (scale bars, 5 µm). Cell outlines are delineated by broken white lines. (D) Cytotoxicity of isogenic WT M49 NZ131 and Δslo mutant strains presented as a percentage of the maximum LDH release. The means ± SEM of three independent experiments in triplicate wells are shown. (E) Cells were infected with WT M49 NZ131 or the Δslo mutant, and the number of infected cells containing ≥11 bacteria was determined. The bacteria in at least 100 infected cells per experiment were counted. (F) Representative confocal microscopy images of U937 cells infected with WT M49 and the Δslo mutant at the time points indicated (scale bars, 5 µm). (G.1 to G.3) Representative contour plots showing the fluorescence profile of antibody-labeled WT M49 NZ131 and the Δslo mutant in U937 cells, including uninfected cells, at 9 hpu. Black boxes indicate the gating for the infected-cell population, and blue boxes indicate the gating for infected cells containing high numbers of fluorescent bacteria. (H) Geometric mean fluorescence intensity at 488 nm (gMF488) of WT M49 NZ131 and the Δslo mutant in U937 cells across all of the time points examined. The mean ± SEM of at least three independent experiments is shown. *, P < 0.05; **, P < 0.01; ***, P < 0.001 (two-tailed paired t test).
FIG 4
FIG 4
SLO reduces association of LAMP1 with GAS. (A) U937 cells were infected with live or HK WT M49 NZ131 or the Δslo mutant at an MOI of 5. Bacteria were labeled with anti-GAS antibody (green) and anti-LAMP1 antibody (red), and DNA was stained with 4′,6-diamidino-2-phenylindole (DAPI; blue). Representative confocal microscopy images obtained at 2 hpu are shown with higher magnifications of boxed areas (scale bars, 5 µm). (B) Quantification of the colocalization of the GAS strains indicated and LAMP1. Data represent the results of at least 100 infected cells in each of three independent experiments (mean ± SEM). (C) U937 cells were infected with live or HK WT M49 NZ131 or the Δslo mutant at an MOI of 5. LysoTracker dye was added to infected cells 15 min prior to each time point. Bacteria were labeled with anti-GAS antibody (green). LysoTracker-positive acidic compartments are red, and DNA stained with DAPI is blue. Representative confocal microscopy images obtained at 2 hpu are shown with higher magnifications of boxed areas (scale bars, 5 µm). (D) Quantification of GAS colocalization with LysoTracker dye. Data shown represent the results of at least 100 infected cells in three independent experiments (mean ± SEM). *, P < 0.05; **, P < 0.01; ***, P < 0.001 (two-tailed paired t test).
FIG 5
FIG 5
GAS bacteria rupture the GCV and escape into the macrophage cytosol. (A) Representative confocal microscopy images of U937 cells infected with HK or WT M49 NZ131 GAS at an MOI of 0.5. Cytosolic bacteria were labeled following digitonin-mediated semipermeabilization of the plasma membrane (green), followed by labeling of total bacteria (red) with saponin at 6 hpu. Yellow arrows indicate vacuolar bacteria. DNA was stained with DAPI (blue) (scale bars, 5 µm). (B) Representative confocal microscopy images of cytosolic M49 NZ131 GAS immunolabeled with antiubiquitin antibodies in digitonin-treated U937 cells at the time points indicated. Ub, ubiquitin. (C) Quantification of ubiquitin colocalization among cytosolic GAS bacteria. At least 100 infected cells were scored in at least three independent experiments (mean ± SEM). (D) Representative confocal microscopy images of cytosolic M49 NZ131 GAS immunolabeled with anti-p62 antibodies in digitonin-treated U937 cells. (E) Quantification of p62 colocalization among cytosolic bacteria. At least 100 infected cells were scored in at least three independent experiments (mean ± SEM).
FIG 6
FIG 6
SLO stimulates targeted autophagy. (A) Representative confocal microscopy images of GFP-LC3 (green) U937 cells infected with WT M49 NZ131 GAS and the Δslo mutant. Bacteria were labeled with anti-GAS antibody (red) and DNA was stained with DAPI (blue) at the time points indicated. (B) Quantification of LC3 colocalization with WT and Δslo mutant bacteria. At least 100 infected cells were scored in at least three independent experiments (mean ± SEM). The region of colocalization is magnified (boxed areas) (scale bars, 5 µm). *, P < 0.05; two-tailed paired t test.
FIG 7
FIG 7
Replication of GAS after rupture of the GCV. U937 cells were infected with M49 NZ131 or Δslo GAS at an MOI of 0.5 and permeabilized with digitonin to quantify the infected cells containing at least one cytosolic bacterium (A) or the total cytosolic bacteria in infected cells (B) at 1, 3, and 6 hpu. The mean ± SEM of at least three independent experiments is shown (scale bars, 5 µm). *, P < 0.05; **, P < 0.01 (two-tailed paired t test). (C) Stills from live confocal imaging of mCherry-tagged galectin 3-expressing U937 cells infected with GFP-M1T1 5448 GAS at an MOI of 0.5. Imaging was initiated at 2 hpu, and the cells were imaged every 20 min until 10 hpu. The elapsed time is shown at the bottom left of each image. Each yellow arrow highlights a single coccus that replicates to form a long chain, as well as its association with mCherry galectin 3. This region is magnified and shown in the white box in the upper right of each image. The still images are representative of 22 infected cells in four independent live-imaging experiments (scale bars, 5 µm).

Comment in

References

    1. Ryan PA, Pancholi V, Fischetti VA. 2001. Group A streptococci bind to mucin and human pharyngeal cells through sialic acid-containing receptors. Infect Immun 69:7402–7412. doi:10.1128/IAI.69.12.7402-7412.2001. - DOI - PMC - PubMed
    1. Osterlund A, Engstrand L. 1995. Intracellular penetration and survival of Streptococcus pyogenes in respiratory epithelial cells in vitro. Acta Otolaryngol 115:685–688. doi:10.3109/00016489509139387. - DOI - PubMed
    1. Kaplan EL, Chhatwal GS, Rohde M. 2006. Reduced ability of penicillin to eradicate ingested group A streptococci from epithelial cells: clinical and pathogenetic implications. Clin Infect Dis 43:1398–1406. doi:10.1086/508773. - DOI - PubMed
    1. Håkansson A, Bentley CC, Shakhnovic EA, Wessels MR. 2005. Cytolysin-dependent evasion of lysosomal killing. Proc Natl Acad Sci U S A 102:5192–5197. doi:10.1073/pnas.0408721102. - DOI - PMC - PubMed
    1. Sakurai A, Maruyama F, Funao J, Nozawa T, Aikawa C, Okahashi N, Shintani S, Hamada S, Ooshima T, Nakagawa I. 2010. Specific behavior of intracellular Streptococcus pyogenes that has undergone autophagic degradation is associated with bacterial streptolysin O and host small G proteins Rab5 and Rab7. J Biol Chem 285:22666–22675. doi:10.1074/jbc.M109.100131. - DOI - PMC - PubMed

Publication types

MeSH terms