. 2016 Dec;15(12):3665-3684.
doi: 10.1074/mcp.M114.047514. Epub 2016 Apr 12.

Instant Integrated Ultradeep Quantitative-structural Membrane Proteomics Discovered Post-translational Modification Signatures for Human Cys-loop Receptor Subunit Bias

Affiliations

Instant Integrated Ultradeep Quantitative-structural Membrane Proteomics Discovered Post-translational Modification Signatures for Human Cys-loop Receptor Subunit Bias

Xi Zhang. Mol Cell Proteomics. 2016 Dec.

Abstract

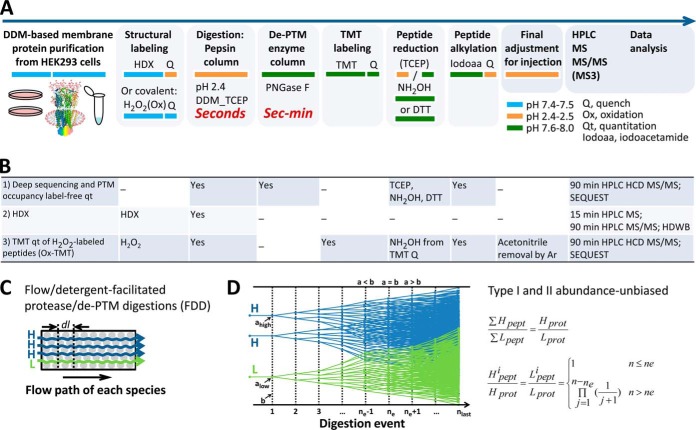
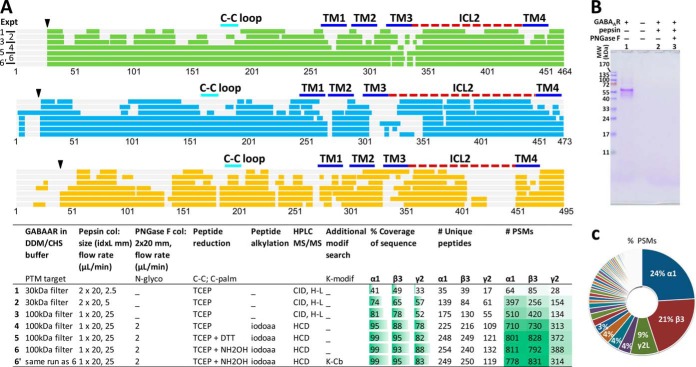
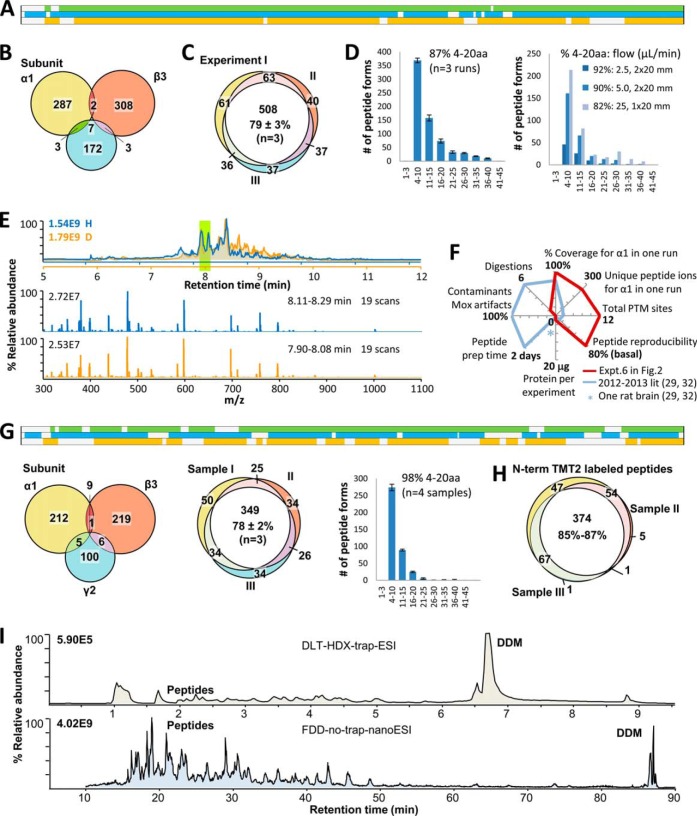
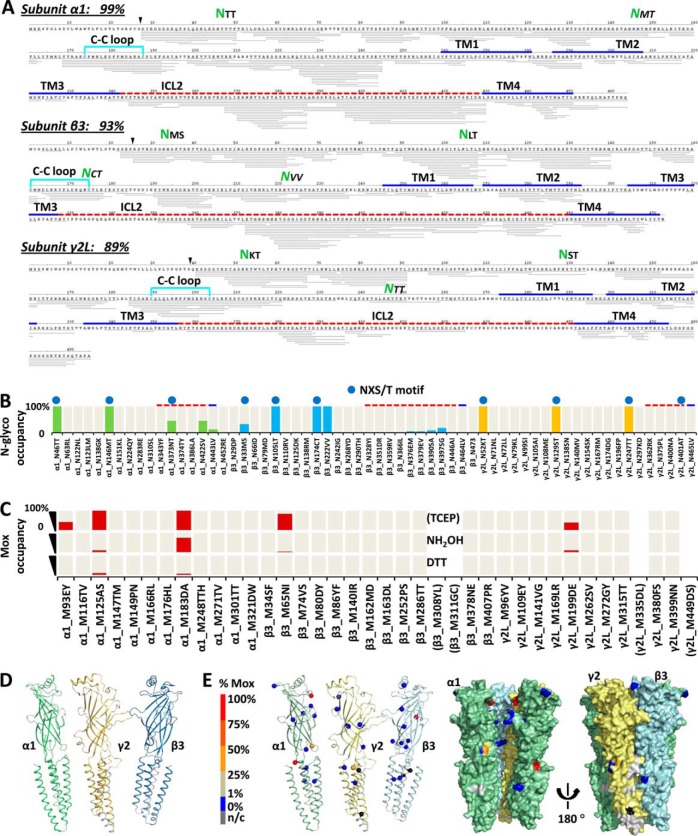
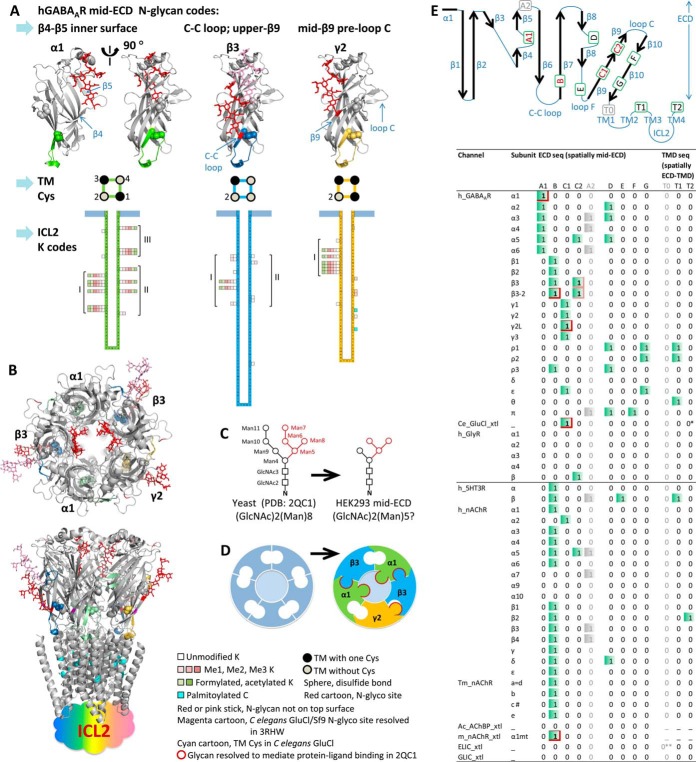
Neurotransmitter ligand-gated ion channels (LGICs) are widespread and pivotal in brain functions. Unveiling their structure-function mechanisms is crucial to drive drug discovery, and demands robust proteomic quantitation of expression, post-translational modifications (PTMs) and dynamic structures. Yet unbiased digestion of these modified transmembrane proteins-at high efficiency and peptide reproducibility-poses the obstacle. Targeting both enzyme-substrate contacts and PTMs for peptide formation and detection, we devised flow-and-detergent-facilitated protease and de-PTM digestions for deep sequencing (FDD) method that combined omni-compatible detergent, tandem immobilized protease/PNGase columns, and Cys-selective reduction/alkylation, to achieve streamlined ultradeep peptide preparation within minutes not days, at high peptide reproducibility and low abundance-bias. FDD transformed enzyme-protein contacts into equal catalytic travel paths through enzyme-excessive columns regardless of protein abundance, removed products instantly preventing inhibition, tackled intricate structures via sequential multiple micro-digestions along the flow, and precisely controlled peptide formation by flow rate. Peptide-stage reactions reduced steric bias; low contamination deepened MS/MS scan; distinguishing disulfide from M oxidation and avoiding gain/loss artifacts unmasked protein-endogenous oxidation states. Using a recent interactome of 285-kDa human GABA type A receptor, this pilot study validated FDD platform's applicability to deep sequencing (up to 99% coverage), H/D-exchange and TMT-based structural mapping. FDD discovered novel subunit-specific PTM signatures, including unusual nontop-surface N-glycosylations, that may drive subunit biases in human Cys-loop LGIC assembly and pharmacology, by redefining subunit/ligand interfaces and connecting function domains.


Figures

Fig. 1.
Fig. 1.
Modular proteomic streamline for instant ultradeep membrane protein analysis, supporting full automation. A, Modular method workflow featuring direct FDD digestion and HPLC MS. Boxes represent modules for selection; color band shifts indicate pH switching with volatile buffers (FA, NH4HCO3 or TEAB). B, Module selection in three applications for quantitation and structural mapping. C, Flow model for FDD's flow-and-detergent-facilitated immobilized enzyme column reactors. D, Digestion model for FDD based on effective catalytic site-occupancy (detailed in supplemental Note S2). n, theoretical number of digestion; a, accessible cleavage sites on all substrates: ahigh, alow, for high- and low- abundance species H and L, respectively; b, catalytic sites on enzymes available for each digestion event; ne, nequal, the digestion event when a = b.
Fig. 2.
Fig. 2.
Direct FDD achieved ultradeep coverage of GABAAR, using module 1 in Fig. 1B. A, Closing sequence coverage gaps by targeting PTMs: N-glycosylation (N-glyco) via PNGase F column, disulfide bond (C-C) and C-palmitoylation (C-palm) via differentiating reducing reagents (TCEP, DTT and NH2OH: Expt. 4, 5 and 6 respectively). K-modifications were checked for excessive alkylation (K-Cb, Expt. 6′). Color bands represent sequence covered for each subunit (green, α1; blue, β3; orange, γ2L) in each experiment (1 to 6′); gray bands in background, genomic sequences supplied for overexpression including signaling peptides (black triangle). Key parameters for each experiment are specified in the table. Expt.3 was partly presented in Ref. , and is included here for comparison. TM, transmembrane helix (blue solid line); ICL, intracellular loop (red dash line); C-C loop (cyan line), used throughout figures. B, SDS-PAGE of GABAAR before (lane 1) and after (lanes 2 and 3) enzyme columns showed complete digestion within 10 s of column residence, and no intact enzymes. Each well contained one–twofold of the equivalent amount of digest injected to one HPLC run. C, Searching Expt. 6 MS/MS spectra against human proteome revealed minimal contamination from environment or protease: α1, β3, and γ2L subunits of GABAAR were the predominant top 3 by PSMs and unique peptides. A few PSMs matched to pepsin were from porcine pepsin.
Fig. 3.
Fig. 3.
FDD demonstrated superior metrics for deep sequencing, quantitation and structural mapping. A, Robust 90–99% sequence coverage for all three subunits (combined search on spectra of Expt. 4, 5, and 6 in Fig. 2), using sub-2 μg GABAAR for each run. PSM distribution over sequence and HPLC-MS traces are shown in supplemental Fig. S1. B, Abundant and reasonable distribution of unique peptides for α1, β3, and γ2 subunits. C, Peptide reproducibility was 79 ± 3% between run 4, 5, and 6 (aliquots of the same deglycosylated digest treated with three different reducing regents), which served as a basal level of HPLC MS/MS run-to-run reproducibility. D, Peptide length fell mostly in the useful 4–20 residues range, and controllable by flow rate. Error bars represented standard deviations from runs 4, 5, and 6. E, HPLC and MS traces of two independent digestions under HDX conditions (module 2 in Fig. 1B), showed high reproducibility in both peptide form and abundance, suitable for HDX structural proteomics. F, Less is more: FDD metrics, critical for peptide-centric quantitative and structural proteomics, contrasting current literature. G, Superior metrics—high sequence coverage, abundant unique peptides, high peptide reproducibility (78 ± 2%) close to basal level, and desired peptide length distribution—were preserved in Ox-TMT quantitative structural mapping (module 3 in Fig. 1B), unaffected by DDM. Four aliquots of GABAAR were independently H2O2 oxidation-labeled, digested (24–30 °C), TMT2-labeled, and randomly paired as three TMT2plex samples for direct HPLC runs. PSM distribution over sequence and HPLC-MS traces are shown in supplemental Fig. S2. H, Streamlined TMT method effectively labeled over 98% of identified peptides in each sample, and 85–87% peptides were reproducibly formed, labeled, and detected between two samples. I, HPLC MS traces (total ion counts) contrasting peptide sensitivity in 2010 DLT-HDX-trap-ESI (upper, apo hGPCR β2AR) and in current FDD-no-trap-nanoESI pipeline (lower, hLGIC GABAAR), under similar concentrations of proteins and DDM.
Fig. 4.
Fig. 4.
Artifact/bias-minimal FDD enabled comprehensive profiling of GABAAR PTMs with % site occupancy: N-glycosylation and endogenous M-oxidation. A, Representative peptide sequence coverage map of GABAAR acquired from one run (Expt. 6 in Fig. 2A) at peptide FDR<1% by PD 1.3 SEQUEST. Each thin line represents one unique peptide ion (modified versions combined). % coverage excluded expected signaling sequences. Green NXX highlights identified ECD N-glyco sites. Key domains were located by sequence alignment with C. elegans GluCl (3RHW) (8) (Methods and supplemental Fig. S5). B, Complete inventory of N-glyco % site occupancy. Top blue dot designates canonical NX(!P)S/T motif. Green, blue, and yellow bars, N-glyco % occupancy for α1, β3, and γ2 subunits, respectively; cream bars in background, N sites covered in PD1.4 quantitation. C, Inventory of Mox % site occupancy (red bar) using TCEP, TCEP+NH2OH, or TCEP+DTT for peptide reduction (Expt. 4, 6, and 5 in Fig. 2A respectively). Cream bars in background, covered in PD1.4 quantitation; brackets, not covered. D, Sequence coverage used for quantitation mapped to 3RHW-based 3D structures (Expt. 4–6 combined search at peptide FDR<1% by PD1.4 SEQUEST-HT). Green, α1; blue, β3; orange, γ2; silver, n/c, not covered; ICD was not shown. E, Endogenous Mox % site occupancy (sphere) by FDD-TCEP mapped to 3D models of individual α1, γ2, and β3 subunit (cartoon), and whole complex (surface). One β3 subunit was removed from the pentamer to show inner surface. N-glyco and Mox % occupancies were quantified by summing MS isotopic peak areas extracted at 2 ppm mass precision of the unmodified and modified version of the same peptide sequences: %(D/(N+D)), and %(Mox/(M+Mox)), respectively (Methods).
Fig. 5.
Fig. 5.
Novel subunit-distinctive PTM signatures discovered herein likely underpin high subunit-biases in hGABAAR assembly and ligand interactions. A, Novel PTM signatures for GABAAR subunits include: high-occupancy N-glycosylations in nontop-surface mid-ECD, and tentative diverse partial-occupancy K-Me/Ac in ICL2, in nonstimulated cells. TM Cys also displayed subunit-specific distribution patterns (supplemental Fig. S4C). 3D locations of mid-ECD N-glycosylations in GABAAR subunits were proposed by sequence alignment with 3RHW and 2QC1. N-glycans were superimposed to mid-ECD sites identified with high occupancy. B, Top and side views of proposed physical form of functional (α1)2(β3)2(γ2L)1 GABAAR pentamer completed with mid-ECD N-glycosylations. Top-surface N-glycans were not shown. C, Glycans shown for mid-ECD sites in hGABAAR/HEK293 were deduced by trimming that resolved in 2QC1 to (GlcNAc)2(Man)5. Immediate ligand-interacting saccharides resolved in 2QC1 were shown in red. D, Subunit interfaces in classic representation of clockwise αβαβγ GABAAR (left) can be upgraded with mid-ECD N-glycans (right, red border) to illustrate concepts of heterogeneity. E, Screening Cys-loop LGICs for NX(!P)S/T motif pinpointed 8 human mid-ECD coding regions from ECD sequence, based on alignment to 3RHW (diagram). Four mains involving αβγ-hGABAAR (red) are: A1, β4-β5 loop on inner surface (α); B, C-C loop (β); C1, preloop C mid-β9 (γ); C2, upper-β9 (β3 s site NVV). Four minors: D, β8-β8 loop; E, β8-β9 lower-loop F; F, upper-β10; G, lower-β10. TMD-originated sites for ECD-TMD interface regions: TM2/TM3 linker (T1) and TM4 tail (T2) (supplemental Fig. S4B). Red box, high-occupancy sites identified herein or by 3RHW and 2QC1; pink box, NVV. Gray, A2 is likely back to top surface (β5-β6, supplemental Fig. S4A) and T0 (TM1 front) is yet unseen though a potential site (** 0, because one NPS in ELIC). * One NAS in C. elegans GluCl β subunit but not in the 3RHW crystallized α-based construct. # One NGT on tip of loop C in fish Tm nAChR chain C (2BG9), absent in human.

References

    1. Pieper U., Schlessinger A., Kloppmann E., Chang G. A., Chou J. J., Dumont M. E., Fox B. G., Fromme P., Hendrickson W. A., Malkowski M. G., Rees D. C., Stokes D. L., Stowell M. H., Wiener M. C., Rost B., Stroud R. M., Stevens R. C., and Sali A. (2013) Coordinating the impact of structural genomics on the human alpha-helical transmembrane proteome. Nat. Struct. Mol. Biol. 20, 135–138 - PMC - PubMed
    1. Olsen R. W., and Sieghart W. (2009) GABA A receptors: subtypes provide diversity of function and pharmacology. Neuropharmacology 56, 141–148 - PMC - PubMed
    1. Marini C., Harkin L. A., Wallace R. H., Mulley J. C., Scheffer I. E., and Berkovic S. F. (2003) Childhood absence epilepsy and febrile seizures: a family with a GABA(A) receptor mutation. Brain 126, 230–240 - PubMed
    1. Fowler C. D., Lu Q., Johnson P. M., Marks M. J., and Kenny P. J. (2011) Habenular alpha5 nicotinic receptor subunit signalling controls nicotine intake. Nature 471, 597–601 - PMC - PubMed
    1. Ebert D. H., and Greenberg M. E. (2013) Activity-dependent neuronal signalling and autism spectrum disorder. Nature 493, 327–337 - PMC - PubMed

Associated data

LinkOut - more resources