

Dual time-point imaging for post-dose binding potential estimation applied to a [11C]raclopride PET dose occupancy study
- PMID: 27073203
- PMCID: PMC5363466
- DOI: 10.1177/0271678X16644463
Dual time-point imaging for post-dose binding potential estimation applied to a [11C]raclopride PET dose occupancy study
Abstract
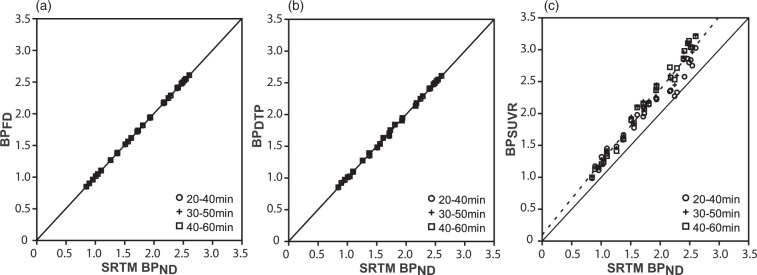
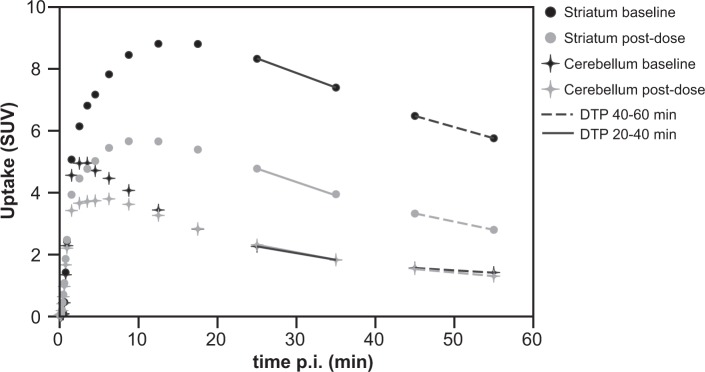
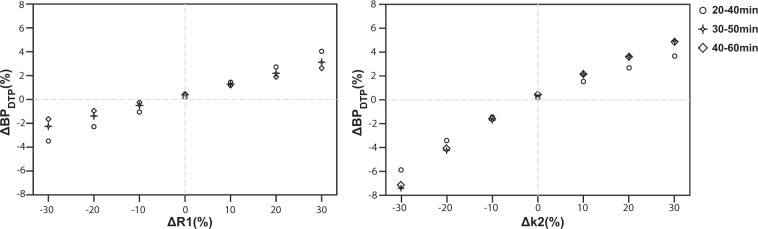
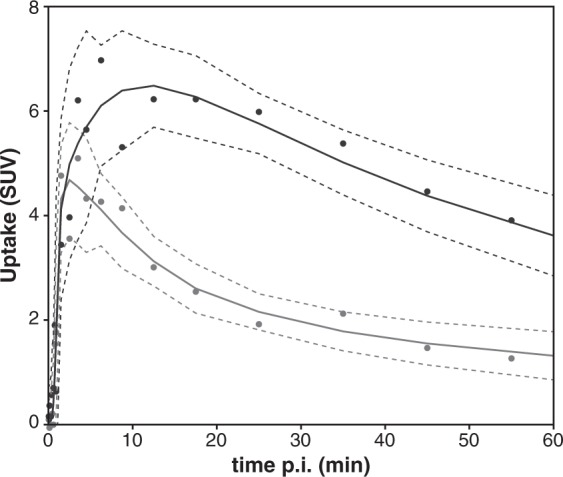
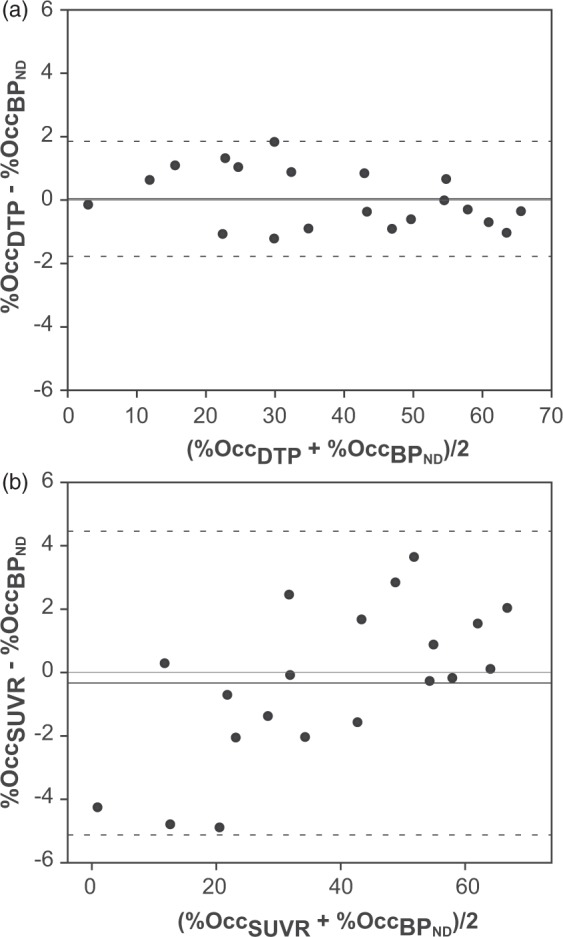
Receptor occupancy studies performed with PET often require time-consuming dynamic imaging for baseline and post-dose scans. Shorter protocol approximations based on standard uptake value ratios have been proposed. However, such methods depend on the time-point chosen for the quantification and often lead to overestimation and bias. The aim of this study was to develop a shorter protocol for the quantification of post-dose scans using a dual time-point approximation, which employs kinetic parameters from the baseline scan. Dual time-point was evaluated for a [11C]raclopride PET dose occupancy study with the D2 antagonist JNJ-37822681, obtaining estimates for binding potential and receptor occupancy. Results were compared to standard simplified reference tissue model and standard uptake value ratios-based estimates. Linear regression and Bland-Altman analysis demonstrated excellent correlation and agreement between dual time-point and the standard simplified reference tissue model approach. Moreover, the stability of dual time-point-based estimates is shown to be independent of the time-point chosen for quantification. Therefore, a dual time-point imaging protocol can be applied to post-dose [11C]raclopride PET scans, resulting in a significant reduction in total acquisition time while maintaining accuracy in the quantification of both the binding potential and the receptor occupancy.
Keywords: Dual time-point; [11C]raclopride; binding potential; positron emission tomography; quantification.
Figures
References
-
- Matthews PM, Rabiner I, Gunn R. Non-invasive imaging in experimental medicine for drug development. Curr Opin Pharmacol 2011; 11: 501–507. - PubMed
-
- Waarde AV. Measuring receptor occupancy with PET. Curr Pharm Des 2000; 6: 1593–1610. - PubMed
-
- Innis RB, Cunningham VJ, Delforge J, et al. Consensus nomenclature for in vivo imaging of reversibly binding radioligands. J Cereb Blood Flow & Metab 2007; 27: 1533–1539. - PubMed
-
- Willemsen ATMW and Paans AMJ. An introduction to kinetic modeling and quantification and its role in drug development. In: Trends on the role of PET in drug development. Singapore: World Scientific Publishing, 2012, pp.417–454.
-
- Logan J, Fowler JS, Volkow ND, et al. Distribution volume ratios without blood sampling from graphical analysis of PET data. J Cereb Blood Flow Metab 1996; 16: 834–840. - PubMed
MeSH terms
Substances
LinkOut - more resources
Full Text Sources
Other Literature Sources
