. 2016 Apr 21;532(7599):380-4.
doi: 10.1038/nature17638. Epub 2016 Apr 13.

Age-dependent modulation of vascular niches for haematopoietic stem cells

Affiliations

Age-dependent modulation of vascular niches for haematopoietic stem cells

Anjali P Kusumbe et al. Nature. .

Erratum in

Abstract

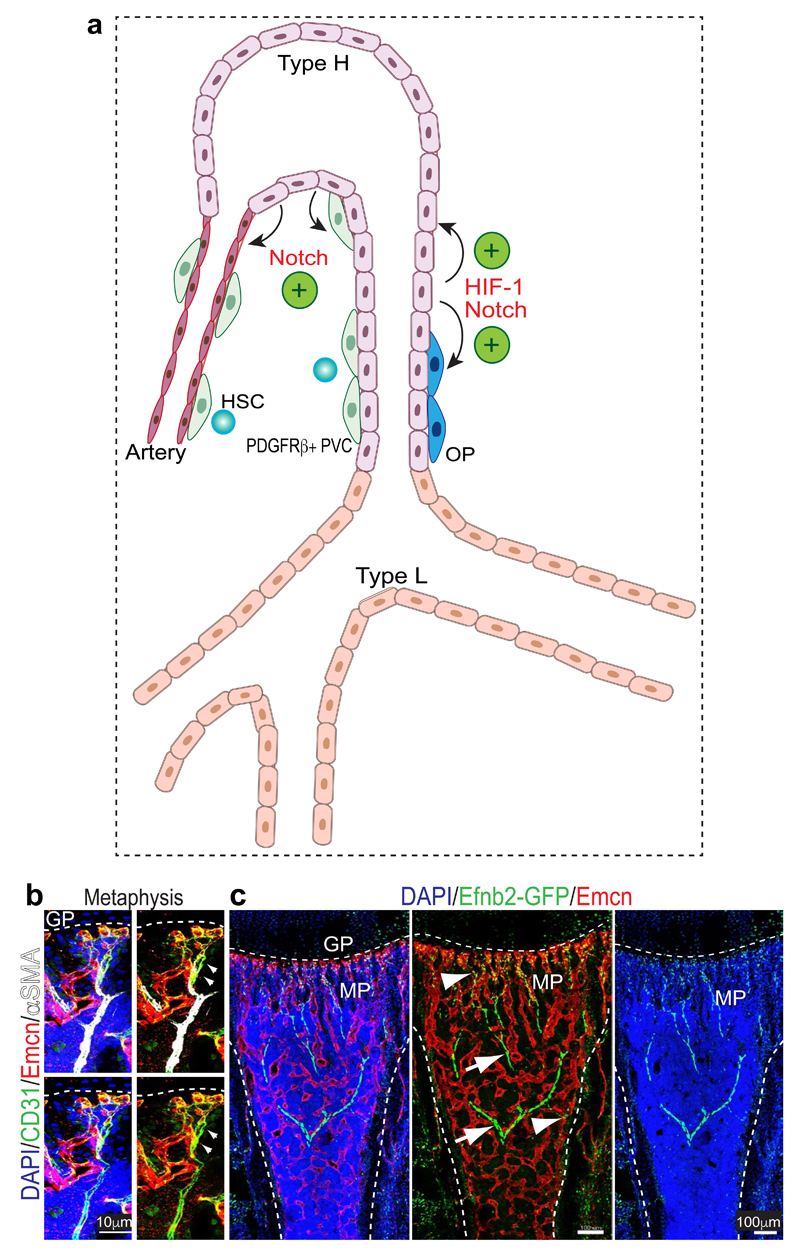
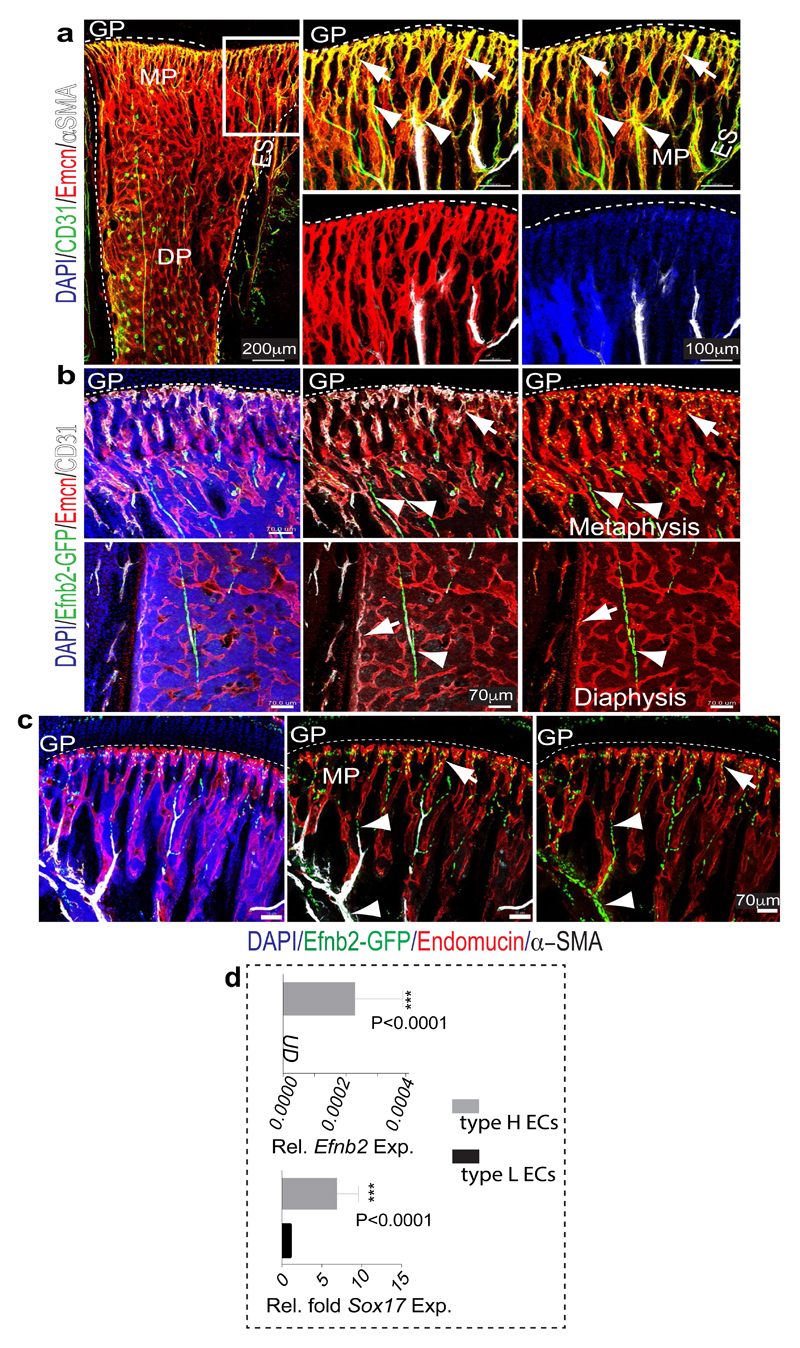
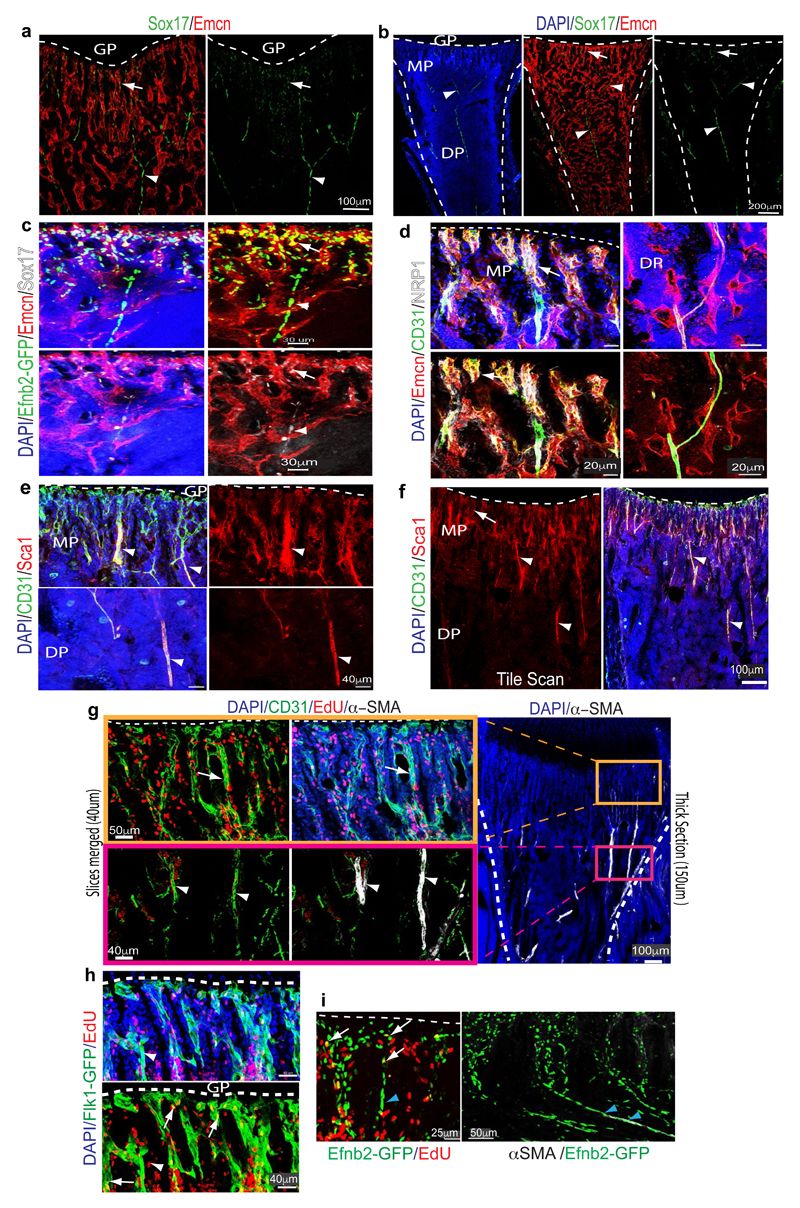
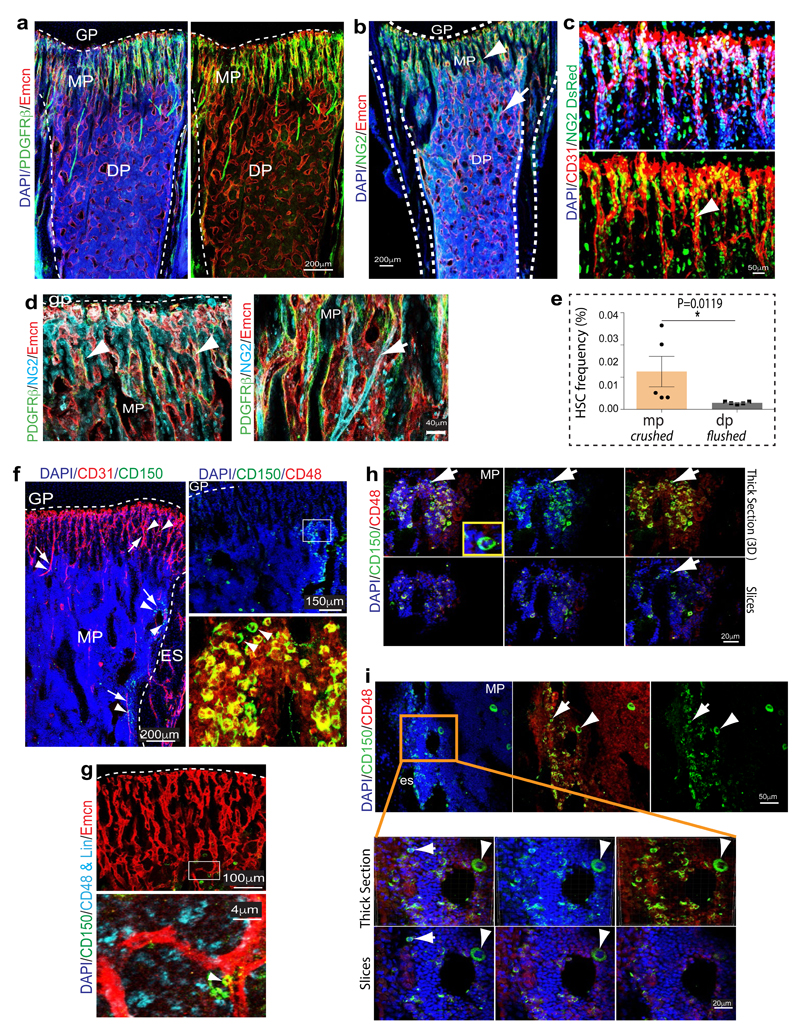
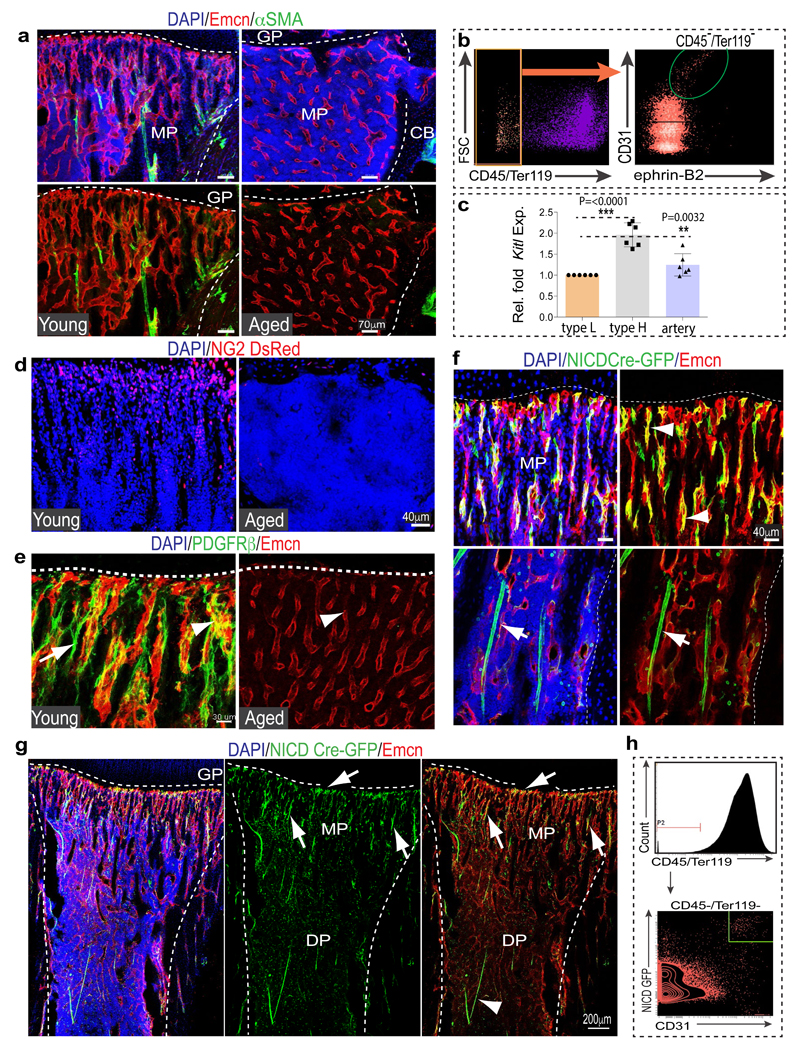
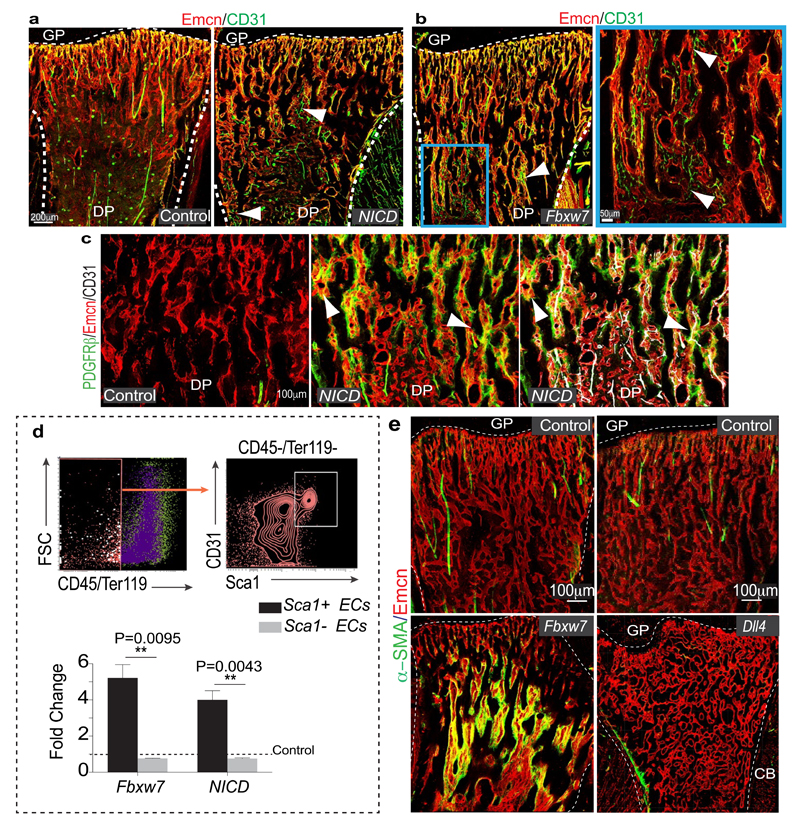
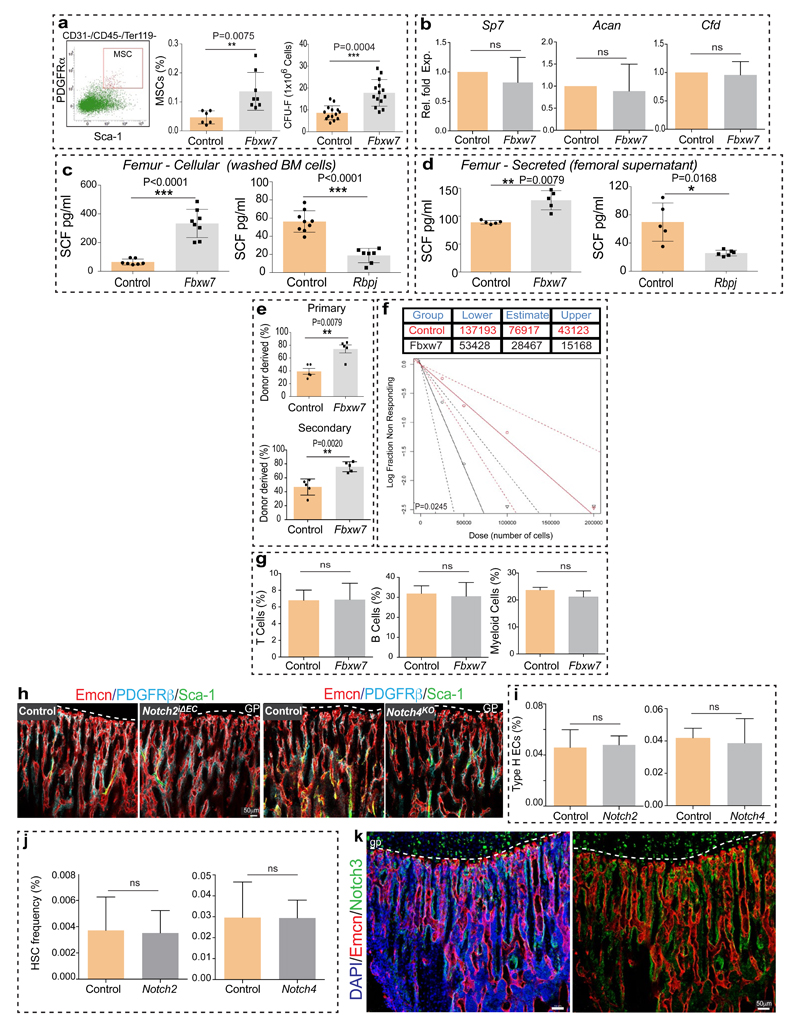
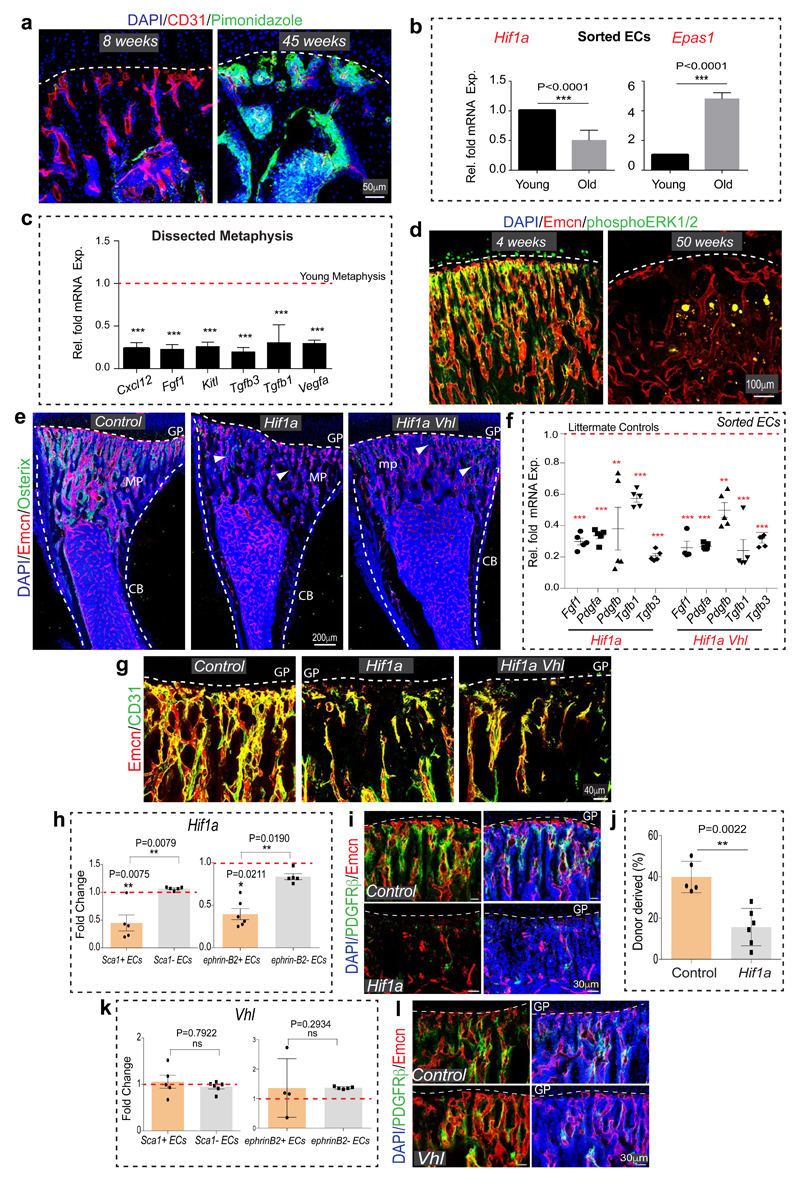
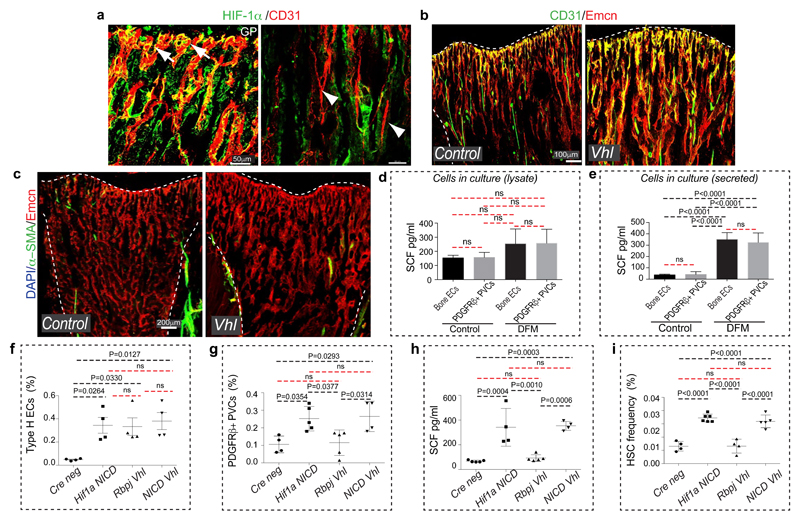
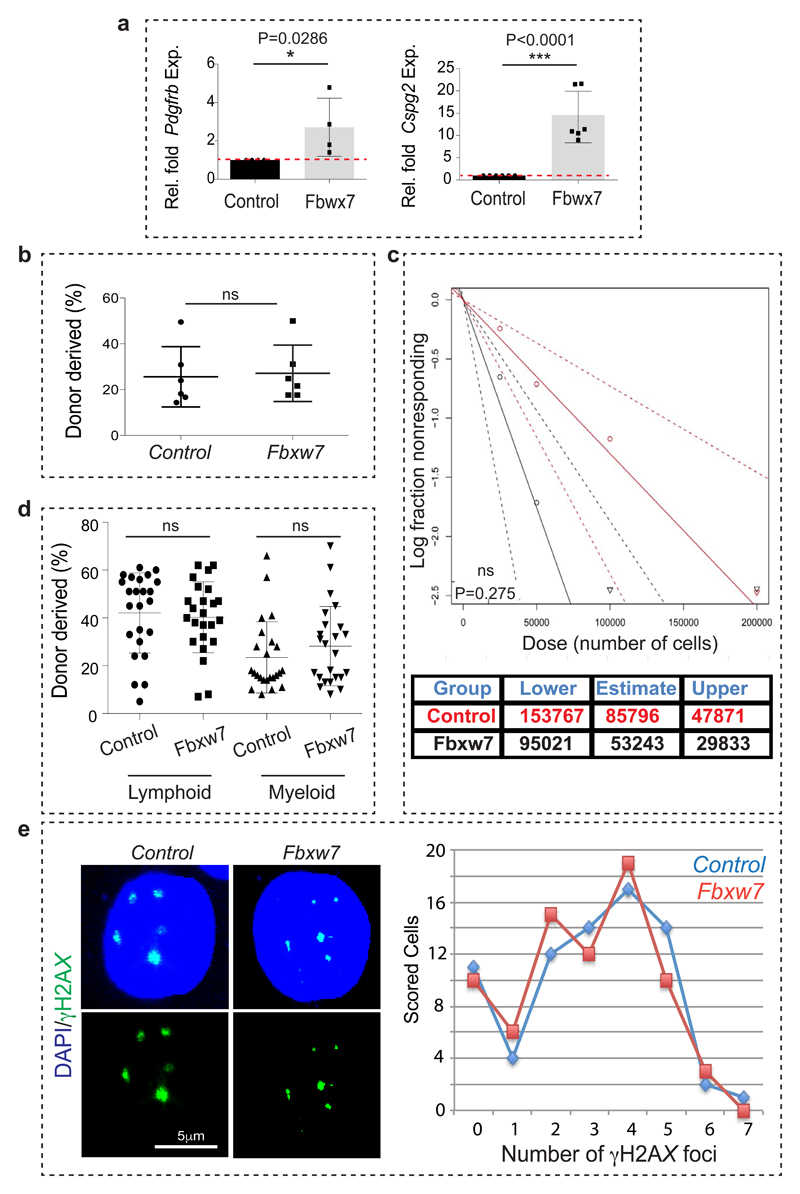
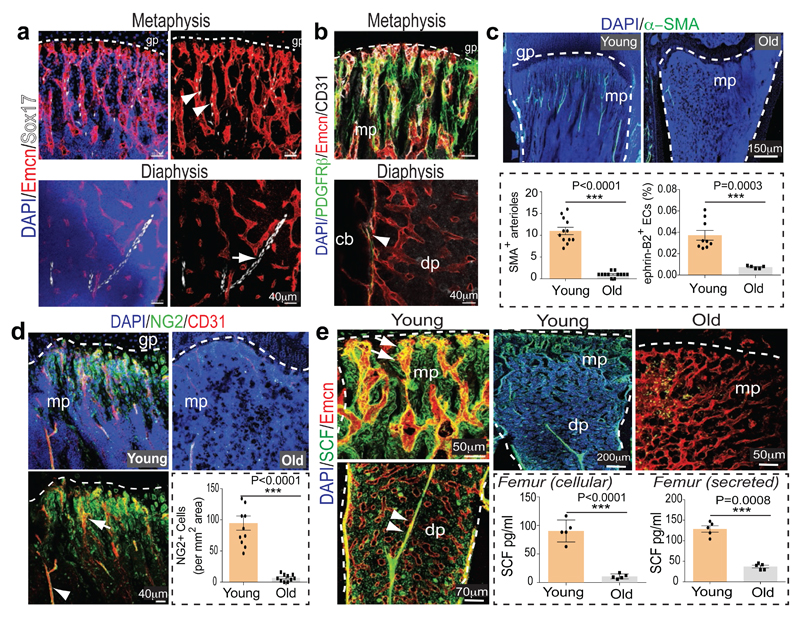
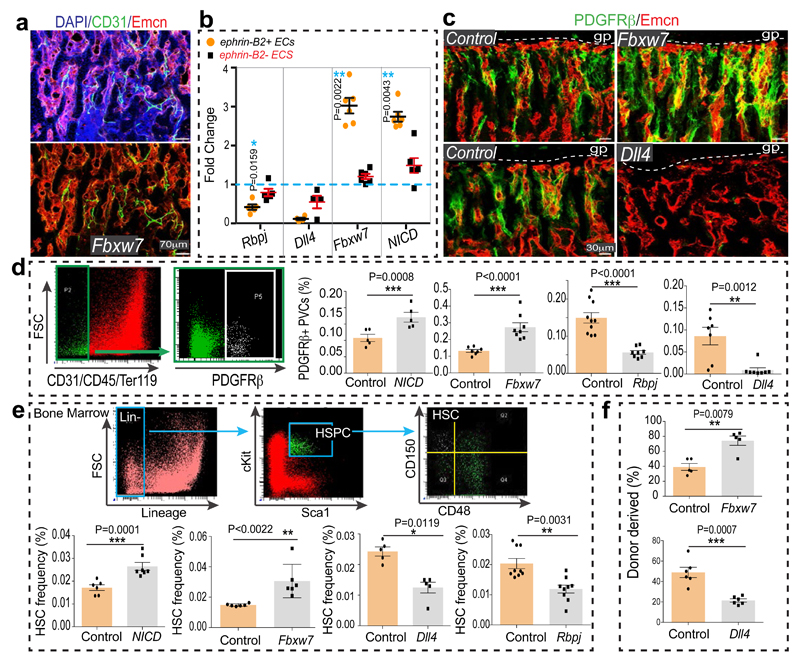
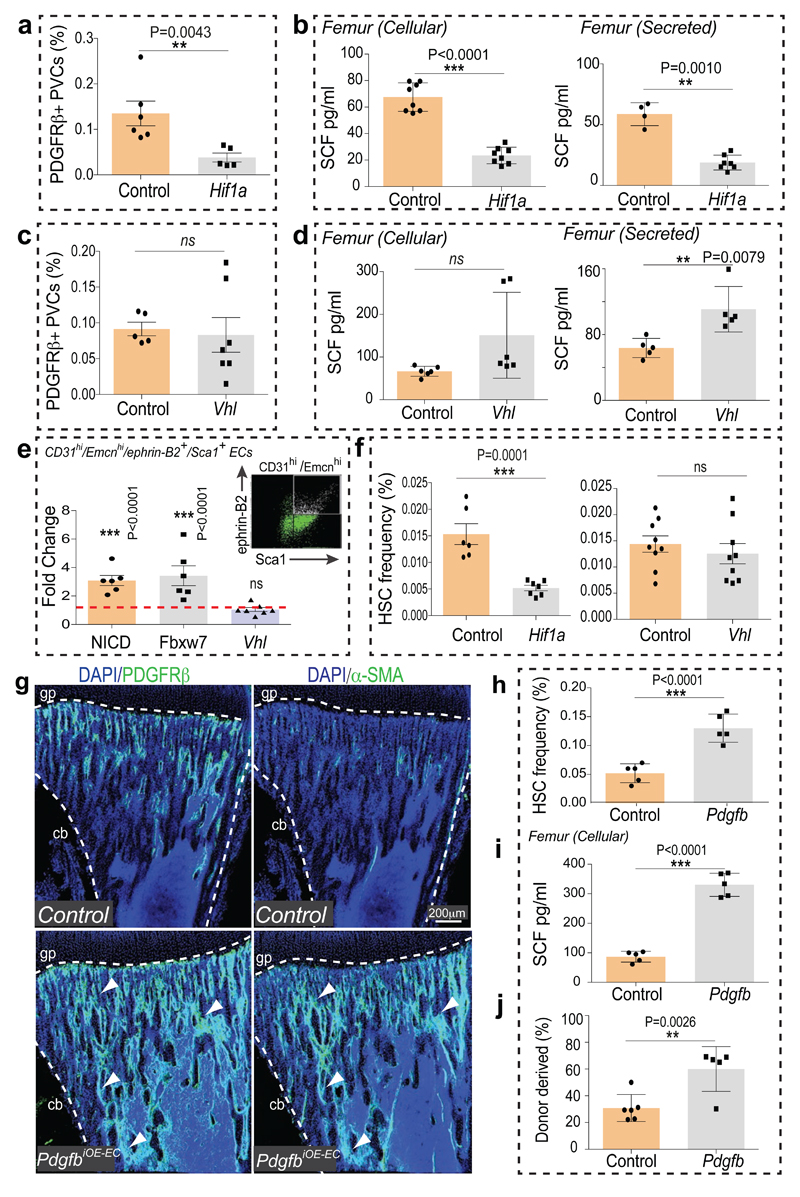
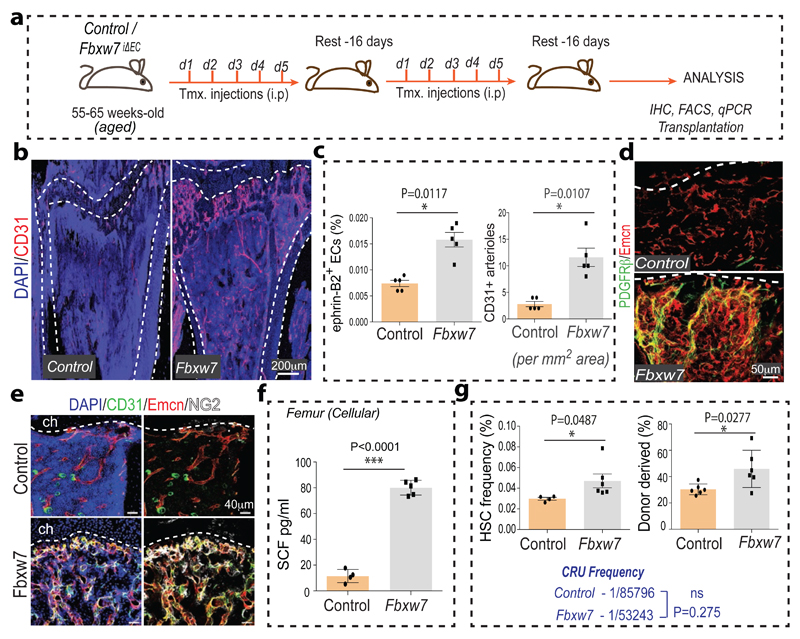
Blood vessels define local microenvironments in the skeletal system, play crucial roles in osteogenesis and provide niches for haematopoietic stem cells. The properties of niche-forming vessels and their changes in the ageing organism remain incompletely understood. Here we show that Notch signalling in endothelial cells leads to the expansion of haematopoietic stem cell niches in bone, which involves increases in CD31-positive capillaries and platelet-derived growth factor receptor-β (PDGFRβ)-positive perivascular cells, arteriole formation and elevated levels of cellular stem cell factor. Although endothelial hypoxia-inducible factor signalling promotes some of these changes, it fails to enhance vascular niche function because of a lack of arterialization and expansion of PDGFRβ-positive cells. In ageing mice, niche-forming vessels in the skeletal system are strongly reduced but can be restored by activation of endothelial Notch signalling. These findings indicate that vascular niches for haematopoietic stem cells are part of complex, age-dependent microenvironments involving multiple cell populations and vessel subtypes.


Conflict of interest statement

The authors do not declare competing financial interests.

Figures

Extended Data Figure 1
Extended Data Figure 1. Summary of key findings and analysis of vessel subtypes.
a, Type H vessels express arterial markers and, unlike type L (sinusoidal) vessels, make direct connections to distal arterioles. PDGFRβ+ perivascular cells (PVC) are selectively abundant around type H vessels and endosteal arteries. In addition, HSCs are frequently detected near the type H endothelium and arterioles in the endosteal region. Endothelial Notch signalling drives artery formation, expansion of type H ECs and PDGFRβ+ PVCs, production of cell-bound SCF and thereby enhances vascular HSC niche function. By contrast, endothelial HIF signalling fails to induce artery formation and expansion of PDGFRβ+ PVCs, which does not result in more HSC niches despite of increases in type H ECs and Osterix+ osteoprogenitor (OP) cells. b, Confocal images of 8 week-old tibial metaphysis showing the direct connection between a CD31hi (green) Endomucin- (Emcn, red) α-SMA+ artery (white) and CD31hi Emcnhi type H capillaries. Dashed line mark growth plate (gp). c, Representative confocal tile scan of 2 week-old Efnb2GFP/+ (green) tibia stained with Emcn (red). Note GFP signal in arteries (arrows) and type H vessels in metaphysis and endosteum (arrowhead), while type L vessels lack Efnb2GFP/+ expression.
Extended Data Figure 2
Extended Data Figure 2. Relationship between type H capillaries and arterioles.
a, Tile scan (left panel) and different representations (merged channels) of image data in inset. Shown is a 4 week-old tibial metaphysis (mp) immunostained for CD31 (green), Emcn (red) and α-SMA (white). CD31hi (green) Emcn- arteries with α-SMA+ coverage are directly connecting to type H ECs (arrowheads). Diaphysis (dp); endosteum (es); growth plate (gp). b, Maximum intensity projections of 4 week-old Efnb2GFP/+ (GFP, green) tibial metaphysis and diaphysis immunostained for CD31 (white) and Emcn (red). Panels in centre and on the right different representations (merged channels) of image data. Only Emcn- arterial ECs (arrowheads) and Emcnhi type H ECs in metaphysis and endosteum (arrows) are positive for GFP, while diaphyseal type L ECs lack Efnb2GFP expression. c, Confocal images of Efnb2GFP metaphysis showing GFP+ (green) Emcnhi (red) type H ECs (arrows) connecting to α-SMA+ (white) cell-covered, Emcn- artery (arrowheads). Dashed lines mark growth plate (gp) or compact bone next to endosteum (es). mp, metaphysis; dp, diaphysis. Nuclei, DAPI (blue). d, RT-qPCR analysis of Efnb2 and Sox17 expression (normalised to Actb) in sorted tibial CD31hi Emcnhi relative to CD31lo Emcnlo ECs. Data represent mean±s.d (n=6; three independent experiments). P values, two-tailed unpaired t-test. UD; undetectable.
Extended Data Figure 3
Extended Data Figure 3. Characterization of bone vessel populations.
a, b, Confocal (a) and tile scan confocal (b) images showing Emcn (red) and Sox17 (green) expression in 4 week-old tibia. Dashed line marks growth plate (gp) in the metaphysis (mp). Sox17 is expressed by type H ECs (arrows) and arteries (arrowheads), whereas signal is absent in type L vessels of the diaphysis (dp). c, Confocal images showing GFP (green), Emcn (red) and Sox17 (white) expression in the metaphysis region and diaphysis region of a Efnb2GFP/+ tibial section. Nuclei, DAPI (blue). Note Sox17 and GFP double positive cells in type H capillaries (arrow) connecting to Efnb2GFP+ Emcn- artery (arrowhead). d, Representative confocal images from metaphysis (left panel) and diaphysis (right panel) regions of 4 week-old murine long bone showing Emcn (red), CD31 (green) and NRP1 (white) immunostaining. Nuclei, DAPI (blue). NRP1 marks type H capillaries (arrow) and adjacent artery (arrowhead), while type L vessels lack detectable NRP1 expression. e, f, Representative confocal (e) and tile scan confocal (f) images showing Sca1 (red) and CD31 (green) immunostaining in metaphysis (mp) and diaphysis (dp) of 4 week-old tibia. Sca1 staining decorates CD31hi arteries (arrowheads) and type H ECs but not type L ECs. Dashed line marks border of the growth plate (gp). g, Maximum intensity projections of EdU (red) labelled 3 week-old tibia immunostained for CD31 (green) and α-SMA (white). Nuclei, DAPI (blue). Proliferating (EdU+) CD31hi type H ECs (arrow) were found near the growth plate (dashed line), whereas distal α-SMA+ cell-covered arteries (arrowheads) lack EC proliferation. h, Confocal images showing EdU labelling in 5 week-old Flk1-GFP long bone. Note EdU+ and GFP+ (arrows) in the endothelial columns close to the growth plate (gp). Straight, small calibre arterioles (arrowheads) lack proliferating ECs. i, Confocal images of 3 week-old Efnb2GFP/+ (green) tibia sections with α-SMA immunostaining (white). Ephrin-B2+ arteriolar ECs exhibit elongated nuclei (blue arrowheads), which are not typical for type H ECs. Overlap of GFP and EdU signals in type H capillaries (arrows) but not in arteries (blue arrowheads).
Extended Data Figure 4
Extended Data Figure 4. Distribution of perivascular cells and HSCs.
a, PDGFRβ (green) cell localization in 4 week-old tibia. PDGFRβ+ cells surround arteries and Emcn+ (red) CD31+ (white) type H vessels in metaphysis (mp) and endosteum (arrowhead), but not diaphyseal (dp) sinusoidal vessels. Growth plate (gp). b, Representative tile scan images of 4 week-old long bone immunostained for Emcn (red) and NG2 (green). Nuclei, DAPI (blue). Dashed lines mark growth plate (gp) and compact bone. Note abundance of NG2 signals around type H vessel columns (arrowheads) in metaphysis (mp). c, Confocal images of 4 week-old NG2-DsRed (DsRed shown as green) transgenic long bone after CD31 immunostaining (red). Nuclei, DAPI (blue). Note abundance of DsRed+ cells around CD31hi (type H) capillaries. d, Sections of 3 week-old tibia immunostained for Emcn (red), NG2 (light blue) and PDGFRβ (green) as indicated. PDGFRβ+ cells were abundant around arteries (arrow) and type H vessels (arrowheads) in metaphysis (mp). Growth plate (gp). e, Graph showing CD150+ CD48 Lin Sca1+ c-Kit+ HSC frequency in single cell suspension. Metaphysis (mp) region from long bones was dissected and, subsequently, these bone fragments were crushed and subjected to collagenase digestion. Simultaneously, CD150+ CD48 Lin Sca1+ c-Kit+ HSC frequency was also quantitated for BM flushed from diaphysis (dp). Data represent mean±s.e.m (n=5; three independent experiments). P values, two-tailed unpaired t-test. f, Maximum intensity projections showing CD31+ (red) arteries (arrows) and type H vessels. CD150+ cells (green) in proximity of metaphyseal (mp) and endosteal (es) endothelium (arrows) as well as CD31+ arterioles (arrowheads). Top right panel shows distribution of CD150+ and CD48+ cells in 4 week-old tibial metaphysis. Arrowheads in higher magnification of inset (bottom) mark CD150+ and CD48- HSCs. Dashed line marks growth plate (gp). g, Perivascular localization of CD150+ (green) CD48- Lineage- (blue) HSCs (arrowhead) near Emcn+ (red) endothelium. h, Representative confocal image showing CD150+ cells (green) in the 4 week-old tibial metaphysis. Arrow marks rare CD150+ CD48- cell, which is also shown at high magnification in inset. Top panels show 3D reconstruction of a thick section, while optical slices (mimicking thin sections) are shown at the bottom. Note that CD150+ CD48- cell (arrow) is only captured in one optical section and would therefore appear more isolated in thin tissue sections. i, Maximum intensity projections (top panels) showing CD150+ (green) cells in 4 week-old tibial metaphysis (mp). Arrow marks rare CD150+ CD48- cell, arrowhead indicates nearby CD150+ megakaryocyte. Higher magnifications of inset show 3D projection and thin optical slices, as indicated. General abundance of CD150+ cells appears strongly reduced in individual optical sections and the indicated CD150+ CD48- cell (arrow) is only captured in one slice. Endosteum (es). Notably, CD150+ cells were frequently found in clusters in thick cryosections (100µm), but appeared scattered in thin optical slices, which reflects the reported widespread distribution throughout the bone marrow.
Extended Data Figure 5
Extended Data Figure 5. Age-associated changes in bone vasculature.
a, Representative confocal images from the metaphysis of young (3 week-old) long bone and the corresponding region in aged (70 week-old) long bone after α-SMA (green) and Emcn (red) immunostaining. Note decline in α-SMA+ cell-covered arteries in aged samples. Growth plate (gp) and compact bone (cb). b, Dot plots showing ephrin-B2+ ECs sorted by flow cytometry from the single cell suspension isolated from long bone. Total ECs in the single cell suspension were identified as CD45-/Ter119-/CD31+ cells. c, qPCR analysis of Kitl expression (normalised to Actb) by CD31hi Emcnhi type H ECs and arterial ECs relative to CD31lo Emcnlo ECs sorted from murine tibia. Arterial ECs were identified and sorted as Emcn- CD31+ ephrin-B2+ cells. Data represent mean±s.d (n=6; in three independent experiments). P values, two-tailed unpaired t-test. Note significantly higher Kitl expression in type H and arterial ECs relative to type L ECs. d, Confocal images showing young (4 week-old) and aged (65 week-old) NG2-DsRed (red) long bone. Nuclei, DAPI (blue). e, Maximum intensity projections of sectioned metaphyseal regions from young (3 week-old) and aged (70 week-old) long bone immunostained for PDGFRβ (green) and Emcn (red). Nuclei, DAPI (blue). Dashed lines indicated the border to growth plate (gp). Arrows indicate the growth plate (gp) type H capillaries and arrowhead shows the artery. f, Representative confocal images showing NICD-Cre-induced GFP expression (green) in Emcn+ (red) type H capillaries (arrowheads) and Emcn- arteries (arrows) in 3 week-old tibia. Dashed lines mark growth plate (gp) or compact bone (cb). g, Representative tile scan confocal images of 3 week-old tibia sections from NICD-Cre knock-in transgenic mice in the in the Rosa26-mT/mG reporter background. Vessels have been visualised by Emcn (red) immunostaining. Nuclei, DAPI (blue). Note high GFP expression in type H endothelium (arrows) and arteries (arrowheads). Dashed lines mark growth plate (gp) and endosteum; metaphysis (mp) and diaphysis (dp) are indicated. h, Contour plot showing intensities of CD31 immunostaining and GFP in single cell suspension obtained from 3 week-old NICD-Cre Rosa26-mT/mG mice. ECs were demarcated as CD45- Ter119- CD31+. Note high GFP intensity in the CD31hi EC subset.
Extended Data Figure 6
Extended Data Figure 6. Effect of endothelial Notch on the BM stroma.
a, b, Confocal images showing CD31 (green) and Emcn (red) immunostained tibia sections of NICDiO-EC (NICD) mutant and littermate control (a) or Fbxw7iΔEC mutant (b). Small, interconnected arterioles (arrowheads) were abundant in Notch gain-of-function mutants. Growth plate (gp), metaphysis (mp) and diaphysis (dp) are indicated. c, Representative confocal images from NICDiO-EC mutant (NICD) and littermate control long bone after Emcn (red), CD31 (white) and PDGFRβ (green) immunostaining. Note strong accumulation of PDGFRβ+ cells in NICDiO-EC bone (arrowheads). d, Quantitative analysis of Sca1+ ECs and Sca1- ECs in Fbxw7iΔEC or NICDiOE-EC long bone relative to Cre- littermate controls. Data represents mean±s.e.m (n=6). P values, two-tailed unpaired t-test. Total ECs were identified as CD45- Ter119- CD31+ cells, as represented in the FACS plots. Note significant increase of Sca1+ ECs in mutants, whereas Sca1- ECs remain comparable to control. e, Confocal tile scans of 4 week-old Fbxw7iΔEC, Dll4iΔEC and littermate control tibiae immunostained with Emcn (red) and α-SMA (green). Growth plate (gp) and compact bone (cb). Unless otherwise mentioned data presented in figure panels is based on three independent experiments.
Extended Data Figure 7
Extended Data Figure 7. Endothelial Notch improves HSC niche function.
a, Representative dot plot showing the gating strategy used for defining the CD31- CD45- Ter119- Sca-1+ and PDGFRα+ MSCs. Graph in middle panel illustrates the flow cytometric quantification of CD31- CD45- Ter119- Sca-1+ PDGFRα+ MSCs in Fbxw7iΔEC and littermate control femurs. Note increase of Sca-1+ and PDGFRα+ MSCs in Fbxw7iΔEC mutants (n=8). Graph on right shows quantification of fibroblast colony-forming units (CFU-F) from Fbxw7iΔEC and control femurs (n=7). Data represents mean±s.e.m. P values, two-tailed unpaired t-test. Flow cytometric quantification of CD31- CD45- Ter119- Sca+ PDGFRα+ mesenchymal stem cells (MSCs) and CFU-F assays confirms a significant increase in MSC frequency. b, Transcripts associated with osteogenic (Sp7), chondrogenic (Acan) and adipogenic (Cfd) differentiation were quantified by qRT-PCR after 14 days of differentiation culture of mesenchymal stromal cells isolated from femur. Data represents mean±s.d (n=6). P values, two-tailed unpaired t-test. No significant differences were seen for Fbxw7iΔEC and control cells in vitro. The differentiation potential of Fbxw7iΔEC cultured MSCs ex vivo was not altered. c, ELISA analysis of cellular SCF (lysate prepared from washed cells) in Fbxw7iΔEC (n=8 and 7) and RbpjiΔEC (n=7 and 9) long bone. Data represents mean±s.d. P values, two-tailed unpaired t-test. d, Graphs showing ELISA analysis of extracellular SCF in Fbxw7iΔEC (n=5) and RbpjiΔEC (n=6 and 5) long bone. Data represents mean±s.d. P values, two-tailed unpaired t-test. e, Increased chimerism of Fbxw7iΔEC mutant (also shown as Fig. 4e; upper panel) relative to littermate control BM is shown after primary and secondary transplantation (at 4 months post-transplantation). Donor-derived chimerism was analysed by transplanting BM cells harvested from Fbxw7iΔEC mutant mice or littermate controls together with recipient CD45.1 recipient-derived BM cells into lethally irradiated recipients. For the secondary transplantation, 1x10⁶ BM cells from CD45.1 mice that had previously undergone transplantation at 1:1 ratio at seven months post-transplantation were injected into lethally irradiated recipients. Data represents mean±s.e.m. (n=5 donors), P values, two-tailed unpaired t-test. f, Levels of donor-derived multi-lineage contribution were determined for Fbwx7iΔEC and control BM cells at 18 weeks post transplantation by flow cytometry. HSC-CRU frequency and statistical significance was determined using ELDA software (n=3 mice per dilution). Note significant increase in the HSC frequency in the Fbxw7iΔEC mutant BM compared to littermate controls. g, Flow cytometric quantification of hematopoietic lineages in the Fbxw7iΔEC and control BM. Data represents mean±s.e.m. (n=14), P values, two-tailed unpaired t-test. Frequency of cells belonging to different hematopoietic lineages was not significantly altered in Fbxw7iΔEC mutants. h, Representative confocal images of EC-specific Notch2iΔEC or global Notch4 mutants (Notch4KO) and corresponding littermate control tibial bones after Emcn (red), PDGFRβ (blue) and Sca-1 (green) immunostaining. i, Flow cytometric quantitation of type H ECs in Notch2iΔEC and Notch4 knockout bones relative to controls. Data represent mean±s.e.m. (n=5 in two independent experiments), P values, two-tailed unpaired t-test. j. Flow cytometric quantitation of HSCs in Notch2iΔEC and Notch4 knockout BM relative to controls. Data represent mean±s.e.m. (n=5 in two independent experiments), P values, two-tailed unpaired t-test. k. Representative confocal images of 4 week-old wild-type tibia showing Notch3 (green) and Emcn (red) immunostaining. Note absence of Notch3 expression in bone ECs. Nuclei, DAPI (blue). Unless otherwise mentioned data presented in figure panels is based on three independent experiments.
Extended Data Figure 8
Extended Data Figure 8. HIF signaling in bone endothelium.
a. Maximum intensity projections of Pimonidazole (green) stained young 8-week old and aged 45-week old tibia sections. Nuclei, DAPI (blue); CD31 immunostaining is shown in red. Dashed lines indicate the border of the growth plate (gp). While pimonidazole staining was largely absent from 8 week-old metaphysis, hypoxic cells were readily detectable in the equivalent region in 45 week-old animals. b. Quantifications of Hif1a and Epas1 transcripts in sorted ECs from young (4 week-old) and old (60 week-old) bone. Data represent mean±s.d. (n=11). P values, two-tailed unpaired t-test. Endothelial expression of Hif1a transcripts was strongly reduced in aged animals, whereas expression of the related Epas1 (Hif2a) gene was significantly increased. c, Quantitative analysis of Cxcl12, Fgf1, Kitl, Tgfb3, Tgfb1 and Vegfa transcripts in dissected 60 week-old metaphysis relative to samples from young mice. Data represent mean±s.d. (n=5). P values, two-tailed unpaired t-test. d, Phospho-MAPK (phosphoERK1/2; green) and Emcn (red) immunostaining in young 4 week-old and aged 50 week-old metaphysis. Nuclei, DAPI (blue). Dashed lines mark growth plate. e, Representative tile scan confocal images obtained from control, Hif1aiΔEC and double mutant Hif1aiΔEC VhliΔEC tibial sections. Immunostaining for Emcn (red) and Osterix (green) is shown. Nuclei, DAPI (blue). The decline of type H ECs and Osterix+ cells in Hif1aiΔEC bone was not recovered in Hif1aiΔEC VhliΔEC double mutants. f, Graph showing Fgf1, Pdgfa, Pdgfb, Tgfb1 and Tgfb3 transcript levels in sorted ECs from Hif1aiΔEC and Hif1aiΔEC VhliΔEC double mutant bones normalized to littermate control. Data represent mean±s.d.; (n=4-7). P values, two-tailed unpaired t-test. g, Representative confocal images showing immunostaining for CD31 (green) and Emcn (red) in Hif1aiΔEC mutant, Hif1aiΔEC VhliΔEC double mutant and control bones. h, Flow cytometric analysis of Sca1+/- (n=5) and Ephrin-B2+/- ECs (n=5 and 6) among total CD45- Ter119- CD31+ ECs in Hif1aiΔEC long bones relative to Cre- littermates. Data represent mean±s.e.m. P values, two-tailed unpaired t-test. i, Representative confocal images of Hif1aiΔEC or control tibial metaphysis after Emcn (red) and PDGFRβ (green) immunostaining. Nuclei, DAPI (blue). Dashed lines mark the growth plate (gp). Note decline in Emcnhi ECs and PDGFRβ+ perivascular cells in Hif1aiΔEC mutant. j, Analysis of donor derived cells indicating LTR-HSC contribution, as determined seven months after transplantation by flow cytometry. Bone marrow cells harvested from Hif1aiΔEC mutant mice or littermate controls were transplanted together with recipient CD45.1 recipient derived bone marrow cells into lethally irradiated recipient mice. Data represents mean±s.e.m. (n=6 donors). P values, two-tailed unpaired t-test. k, Quantitative analysis of Sca1+/- ECs (n=6 and 5) and Ephrin-B2+/- ECs (n=5 and 4) among total CD45- Ter119- CD31+ ECs in VhliΔEC long bone relative to Cre-littermates. Data represent mean±s.e.m (n=4-6). P values, two-tailed unpaired t-test. l, Representative confocal images of VhliΔEC and control tibial metaphysis with Emcn (red) and PDGFRβ (green) immunostaining. Nuclei, DAPI (blue). Dashed lines mark growth plate (gp). Unless otherwise mentioned data presented in figure panels is based on three independent experiments.
Extended Data Figure 9
Extended Data Figure 9. Relation between Notch and HIF in bone ECs.
a, Metaphysis region of 2 week-old tibia after CD31 (red) and HIF-1α (green) immunostaining. Dashed line marks the growth plate; arrows indicate type H endothelium. Note absence of HIF-1α signal in CD31+ arteries (arrowheads in right panel). b, Confocal images showing CD31 (green) and Emcn (red) immunostaining of VhliΔEC mutant and littermate control tibia sections. Dashed lines mark growth plate. Note increase in type H capillaries. c, Tile scan confocal images showing α-SMA (green) and Emcn (red) immunostained tibia. Similar amounts of α-SMA+ cell-covered vessels (arteries) were visible in VhliΔEC and control samples. d, e, ELISA analysis of cellular (cell lysates, d) and secreted SCF levels (cell culture supernatant, e) in cell lysates of cultured BM-derived ECs and PDGFRβ+ perivascular cells (PVCs; n=5 replicates) after treatment with vehicle control or DFM. Data represents mean±s.d. P values, one-way ANOVA with Tukey’s multiple comparison post-hoc test. f, g, Frequency (%) of type H ECs (f, n=4) and PDGFRβ+ PVCs (g, n=5 mutants and 6 controls) among total BM cells in Hif1a iΔEC NICDiOEC, RbpjiΔEC VhliΔEC and NICDiOEC Vhl iΔEC double mutants relative to Cre- controls. Data represent mean±s.e.m. P values, one-way ANOVA with Tukey’s multiple comparison post-hoc test. The combination of enhanced Notch and HIF activity in NICDiOE-EC VhliΔEC double mutants, failed to induce a bigger expansion of type H ECs. h, ELISA analysis of the cellular SCF levels in lysates of femur cells from Hif1a iΔEC NICDiOEC, Rbpj iΔEC Vhl iΔEC and NICDiOEC Vhl iΔEC double mutants relative to Cre- controls. Data represent mean±s.e.m. (n=4 or 5 mutants and 5 controls). P values, one-way ANOVA with Tukey’s multiple comparison post-hoc test. i, HSC frequency (%) in Hif1a iΔEC NICDiOEC, Rbpj iΔEC Vhl iΔEC and NICDiOEC Vhl iΔEC double mutants relative to Cre- controls. Data represent mean±s.e.m. (n=4 or 5 mutants and 4 controls). P values, one-way ANOVA with Tukey’s multiple comparison post-hoc test. Unless otherwise mentioned data presented in figure panels is based on three independent experiments.
Extended Data Figure 10
Extended Data Figure 10. Properties of vascular niches and HSCs in aged mice.
a, qPCR analysis of Pdgfrb and Cspg4 expression (normalised to Actb) in long bone of Fbxw7iΔEC mutants relative to littermate controls. Data represents mean±s.d (n=4 left panel; n=6 right panel). P values, two-tailed unpaired t-test. b, Analysis of LTR-HSC contribution of BM cells from aged Fbxw7iΔEC and control donors, as determined by flow cytometry at 16 weeks after competitive transplantation together with young CD45.1 BM cells (from 12-14 week-old mice) into lethally irradiated recipients. Data represents mean±s.e.m. (n=6 donors). c, Levels of donor derived multi-lineage contribution of aged Fbwx7iΔEC and age-matched control BM cells as determined 18 weeks post transplantation by flow cytometry analysis. HSC-CRU frequency and statistical significance was determined using ELDA software (n=3 mice per dilution). d, Donor-derived lymphoid and myeloid contributions of aged Fbxw7iΔEC and control BM cells determined 18 weeks post-transplantation by flow cytometry analysis with B220 and CD11b antibodies. Data represents mean±s.d (n=24). P values, two-tailed unpaired t-test. e, Representative images and quantification of γH2AX foci in Lineage-/cKit+/Sca-1+ HSPCs sorted from Fbwx7iΔEC mice and littermate controls (110 HSPCs were scored for each group). Note persistence of γH2AX foci in the aged Fbxw7iΔEC HSPCs. Unless otherwise mentioned data presented in figure panels is based on three independent experiments.
Figure 1
Figure 1. Bone vessel subtypes and properties.
a, Confocal images showing Emcn (red) and Sox17 (white) in tibial metaphysis or diaphysis. Nuclei, DAPI (blue). Arrowhead marks artery, arrow type H capillaries. b, PDGFRβ+ cells (green) surround arteries and Emcn+ (red) CD31+ (white) vessels in metaphysis (mp) and endosteum (arrowhead) but not diaphyseal (dp) sinusoidal vessels in 4 week-old tibia. c, α-SMA+ arterioles in 5 (young) and 65 week-old (old) tibial metaphysis. Nuclei, DAPI (blue). Dashed lines mark growth plate (gp) and compact bone. Graphs show quantitative analysis of α-SMA+ metaphyseal arteries (n=12, 2 independent experiments) and flow cytometric analysis of ephrin-B2+ ECs (n=9 young and 5 old mice). Data represent mean±s.e.m. P values, two-tailed unpaired t-test. d, NG2+ (green) cells and CD31+ (red) vessels in sections from 5 (Young, left) and 65 week-old (Old) tibial metaphysis. Graph shows quantitation of NG2+ mesenchymal cells excluding NG2+ bone cells. Data represents mean±s.e.m (2 tibias from 5 mice). P values, two-tailed unpaired t-test. e, Confocal images showing SCF (green) staining in arteries (arrowheads) and Emcn+ (red) metaphyseal (mp) type H vessels (arrow) of young (3 week-old) but not old (65 week-old) tibiae. Quantitative analysis of cellular (lysate of washed total BM cells) and extracellular SCF (bone supernatant) in young/old long bone by ELISA. Data represents mean±s.d (n=5). P values, two-tailed unpaired t-test.
Figure 2
Figure 2. Endothelial Notch regulates BM HSC numbers.
a, Formation of numerous CD31+ (green) Emcn- (red) arterioles in 4 week-old Fbxw7iΔEC tibial diaphysis. Nuclei, DAPI (blue). b, Quantitative analysis of ephrin-B2+ and ephrin-B2- ECs in NICDiOE-EC (n=6 mutants and 5 controls), Fbxw7iΔEC (n=6 and 5), RbpjiΔEC (n=5) and Dll4iΔEC (n=4 and 5) long bone relative to Cre-negative controls (dotted line). Data represents mean±s.e.m. P values, two-tailed unpaired t-test. Total ECs were identified as CD45- Ter119- CD31+ cells. c, Representative images of Fbxw7iΔEC, Dll4iΔEC or control tibial metaphysis showing PDGFRβ+ (green) cells around Emcn+ (red) capillaries. d, Flow cytometric quantitation of CD31- CD45- Ter119- PDGFRβ+ cells, as shown in representative dot plots. Note increase of PDGFRβ+ cells in Notch gain-of-function bone (NICD n=5; Fbxw7 n=8 and 7) but decrease in RbpjiΔEC (n=8 and 10) and Dll4iΔEC (n=7) mutants. Data represent mean±s.e.m. P values, two-tailed unpaired t-test. e, Flow cytometric quantitation (as shown in dot plots) of HSCs in NICDiOE-EC (n=7 and 6), Fbxw7iΔEC (n=7 and 6), RbpjiΔEC (n=8 and 10), and Dll4iΔEC (n=7) long bones relative to Cre- littermates. Data represents mean±s.e.m. P values, two-tailed unpaired t-test. f, Analysis of LTR-HSC contribution of Fbxw7iΔEC and Dll4iΔEC donor-derived BM cells, as determined by flow cytometry at 7 months after competitive transplantation together with recipient-derived CD45.1 BM cells into lethally irradiated mice. Data represents mean±s.e.m. (n=5 donors for Fbxw7iΔEC and n=6 donors for Dll4iΔEC).
Figure 3
Figure 3. Endothelial HIF signalling and vascular niches.
a, Flow cytometric analysis of CD31- CD45- Ter119- PDGFRβ+ cells in Hif1aiΔEC and control long bone. Data represents mean±s.e.m (n=5 mutants and 6 controls). P values, two-tailed unpaired t-test. b, ELISA analysis of cellular (n=8) and secreted (n=7 and 4) SCF levels in Hif1aiΔEC and control long bone. Data represents mean±s.d. P values, two-tailed unpaired t-test. c, Flow cytometric quantitation of CD31- CD45- Ter119- PDGFRβ+ cells from VhliΔEC and control long bone. Data represents mean±s.e.m (n=7 and 5). d, Graphs showing ELISA analysis of cellular (n=6) and secreted (n=5) SCF levels in VhliΔEC long bone relative to controls. Data represents mean±s.d. P values, two-tailed unpaired t-test. e, Fold change in frequency of ephrin-B2+ Sca1+ ECs in NICDiOE-EC (n=6) and Fbxw7iΔEC (n=6) but not in VhliΔEC (n=7) long bone relative to littermate controls, as determined by flow cytometric analysis (see representative dot plot). Data represent mean±s.e.m. P values, two-tailed unpaired t-test. f, Flow cytometric analysis of HSCs in Hif1aiΔEC (n=7 and 6) and VhliΔEC (n=9) long bone relative to Cre- littermates. Data represents mean±s.e.m. P values, two-tailed unpaired t-test. g, Representative tile scan confocal images showing PDGFRβ (green, left panels) or α-SMA (green, right) in PdgfbiOE-EC and control tibia sections. Nuclei, DAPI (blue). Dashed lines mark growth plate (gp) or cortical bone (cb). h, Flow cytometric quantitation of HSCs in PdgfbiOE-EC long bone relative to Cre- littermates (n=5). Data represents mean±s.e.m. P values, two-tailed unpaired t-test. i, ELISA analysis of cellular SCF levels in PdgfbiOE-EC (n=5) long bone. Data represents mean±s.d. P values, two-tailed unpaired t-test. j, Analysis of LTR-HSC contribution of PdgfbiOE-EC donor-derived BM cells, as determined by flow cytometry at 14 weeks after competitive transplantation together with recipient-derived CD45.1 BM cells into lethally irradiated mice. Data represents mean±s.e.m. (n=5 and 6 donors).
Figure 4
Figure 4. Endothelial Notch reactivates HSC niches in aged mice.
a, Tamoxifen (Tmx) administration strategy for aged Fbxw7iΔEC mutants. Injection days (d1-d5) and rest periods are indicated. b, Increase of CD31 (red) immunostained vessels in aged Fbxw7iΔEC tibia. Nuclei, DAPI (blue). c, Quantitation of CD45- Ter119- CD31+ ephrin-B2+ ECs (by flow cytometry) and of CD31+ arterioles (by morphology) in Fbxw7iΔEC and control long bone. Data represents mean±s.e.m (n=5). P values, two-tailed unpaired t-test. d, Increase of PDGFRβ+ (green) cells associated with Emcn+ (red) vessels in Fbwx7iΔEC tibia relative to control. Nuclei, DAPI (blue). e, Increase in NG2+ (white) cells and abundance of CD31+ (green) and Emcn+ (red) vessels in Fbxw7iΔEC tibia. Dashed lines mark the chondrocyte zone (ch). f, ELISA analysis of cellular SCF in Fbxw7iΔEC and control long bone. Data represent mean±s.d. (n=5 and 4), P values, two-tailed unpaired t-test. g, Flow cytometric quantitation (left) of HSCs in aged Fbxw7iΔEC (n=6 and 4). Data represents mean±s.e.m. P values, two-tailed unpaired t-test. Analysis of LTR-HSC contribution of BM cells from aged Fbxw7iΔEC and control donors, as determined by flow cytometry at 16 weeks after competitive transplantation with age-matched CD45.1 BM cells into lethally irradiated recipients. Data represents mean±s.e.m. (n=6).

References

    1. Ding L, Saunders TL, Enikolopov G, Morrison SJ. Endothelial and perivascular cells maintain haematopoietic stem cells. Nature. 2012;481:457–462. - PMC - PubMed
    1. Hooper AT, et al. Engraftment and reconstitution of hematopoiesis is dependent on VEGFR2-mediated regeneration of sinusoidal endothelial cells. Cell Stem Cell. 2009;4:263–274. - PMC - PubMed
    1. Kiel MJ, et al. SLAM family receptors distinguish hematopoietic stem and progenitor cells and reveal endothelial niches for stem cells. Cell. 2005;121:1109–1121. - PubMed
    1. Kusumbe AP, Ramasamy SK, Adams RH. Coupling of angiogenesis and osteogenesis by a specific vessel subtype in bone. Nature. 2014;507:323–328. - PMC - PubMed
    1. Acar M, et al. Deep imaging of bone marrow shows non-dividing stem cells are mainly perisinusoidal. Nature. 2015;526:126–130. - PMC - PubMed

Publication types

MeSH terms

Substances