. 2016 Apr 12;110(7):1538-1550.
doi: 10.1016/j.bpj.2016.02.019.

Cholesterol Increases the Openness of SNARE-Mediated Flickering Fusion Pores

Affiliations

Cholesterol Increases the Openness of SNARE-Mediated Flickering Fusion Pores

Benjamin S Stratton et al. Biophys J. .

Abstract

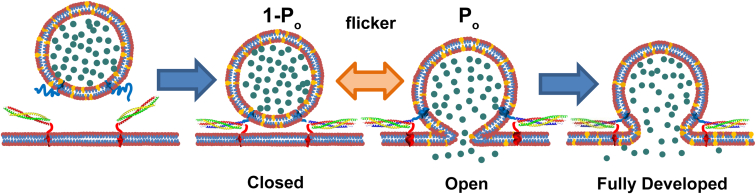
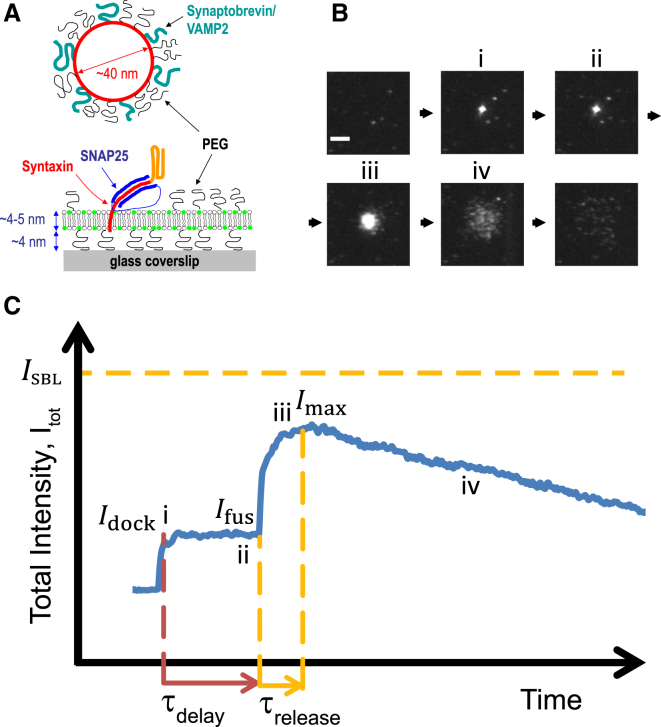
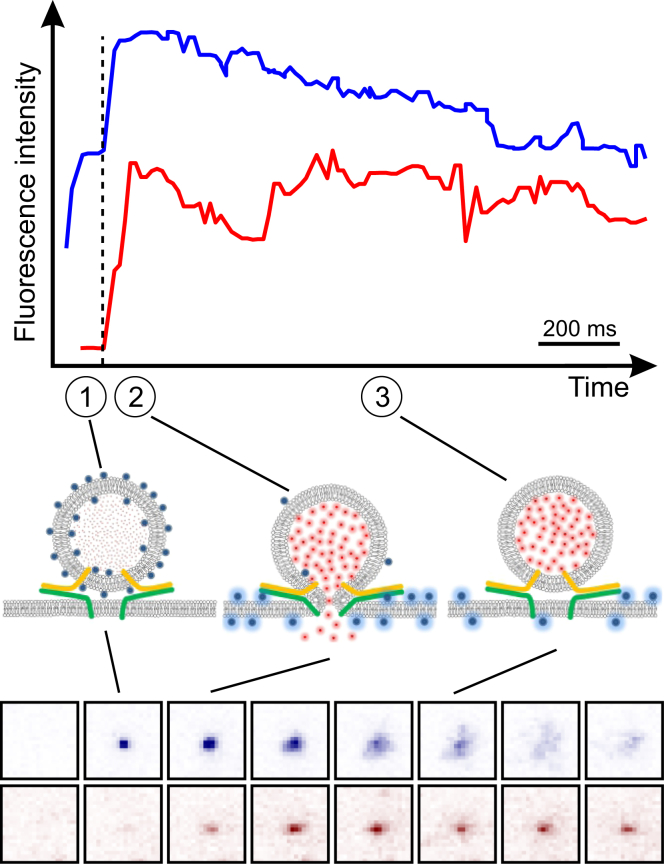
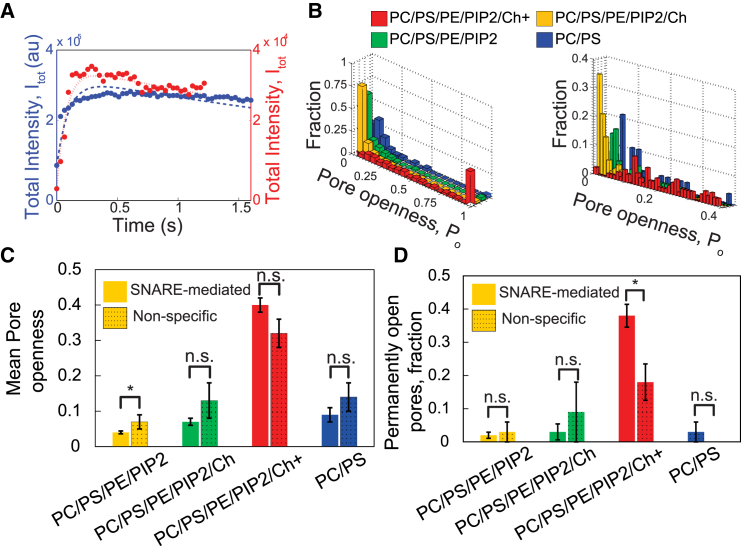
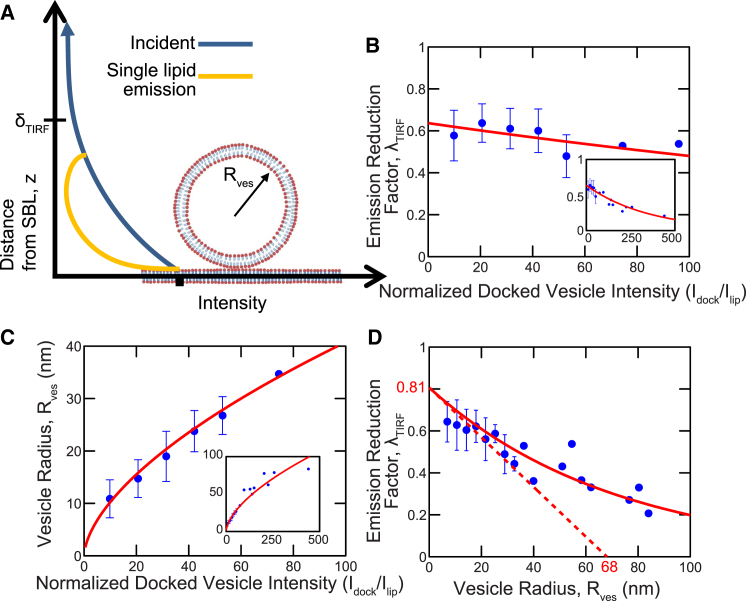
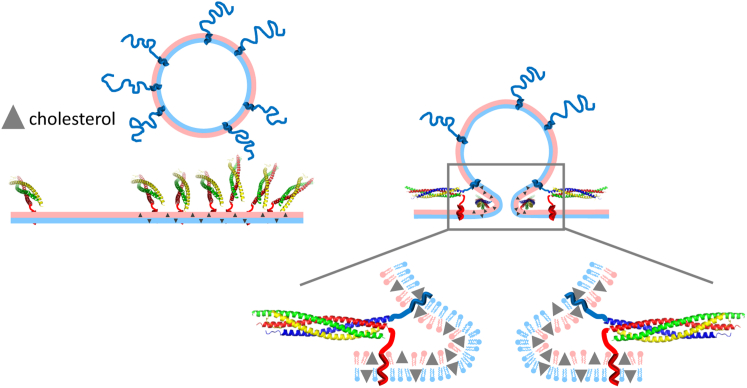
Flickering of fusion pores during exocytotic release of hormones and neurotransmitters is well documented, but without assays that use biochemically defined components and measure single-pore dynamics, the mechanisms remain poorly understood. We used total internal reflection fluorescence microscopy to quantify fusion-pore dynamics in vitro and to separate the roles of soluble N-ethylmaleimide-sensitive factor attachment protein receptor (SNARE) proteins and lipid bilayer properties. When small unilamellar vesicles bearing neuronal v-SNAREs fused with planar bilayers reconstituted with cognate t-SNARES, lipid and soluble cargo transfer rates were severely reduced, suggesting that pores flickered. From the lipid release times we computed pore openness, the fraction of time the pore is open, which increased dramatically with cholesterol. For most lipid compositions tested, SNARE-mediated and nonspecifically nucleated pores had similar openness, suggesting that pore flickering was controlled by lipid bilayer properties. However, with physiological cholesterol levels, SNAREs substantially increased the fraction of fully open pores and fusion was so accelerated that there was insufficient time to recruit t-SNAREs to the fusion site, consistent with t-SNAREs being preclustered by cholesterol into functional docking and fusion platforms. Our results suggest that cholesterol opens pores directly by reducing the fusion-pore bending energy, and indirectly by concentrating several SNAREs into individual fusion events.


Figures

Figure 1
Figure 1
Schematic of the flickering dynamics of membrane fusion pores. A vesicle docks onto a planar membrane by complexation of vesicle v-SNAREs (blue on vesicle) with t-SNAREs (red, yellow, and green on SBL). Fusion of the membranes creates an open pore through which contents are released. Live-cell electrophysiological studies show that fusion pores may flicker rapidly and repeatedly between closed and open states, then dilate to become fully developed pores or permanently close. In this study, we track flickering of fusion pores by monitoring release of labeled vesicle membrane lipids (yellow) into the planar membrane (Fig. 2). Simultaneous observations of lipid and content release are also made (Fig. 3). Release is retarded because the pore is open only a fraction, Po, of the time. To see this figure in color, go online.
Figure 2
Figure 2
Using TIRFM to measure lipid mixing and fusion-pore flickering dynamics. (A) Vesicles reconstituted with v-SNAREs (synaptobrevin/VAMP2) fuse with a target SBL reconstituted with cognate t-SNAREs (syntaxin and SNAP25). Membranes are PEGylated to prevent nonspecific interactions, and 0.6–1% of lipids are fluorescently labeled. (B) TIRF sequence during a typical fusion event, viewed from beneath the coverslip in (A). When the vesicle docks onto the SBL, a spot appears (i). At a later time, τdelay, fusion occurs (ii) and the spot brightens as labeled lipids diffuse into the SBL (iiiii). Individual lipids are discernible by stage iv. The box size is 22 μm × 22 μm, 82 × 82 pixels, and the scale bar represents 5 μm. (C) Typical time course of total fluorescence intensity, Itot, integrated over the box in (B), from which we extracted the lipid release time, τrelease. After lipid release into the SBL, Itot would increase to the value ISBL were it not for bleaching (iiiiv) (Imax<ISBL). To see this figure in color, go online.
Figure 3
Figure 3
Simultaneous content and lipid release using TIRFM. v-SUVs contained 1 mol % DiD lipid dye and encapsulated 10 or 50 mM soluble content marker SRB. DiD and SRB were excited simultaneously using 638 nm and 561 nm laser lines, respectively. The emission was split and filtered to observe DiD (top, blue trace) and SRB (lower, red trace) fluorescence signals simultaneously projected onto an EMCCD detector. Total intensities from a region 20 pixels × 20 pixels (5.3 μm × 5.3 μm) is plotted for both the lipid (upper, blue trace) and content (lower, red trace) signals for a representative event. Snapshots from the lipid (top sequence, blue) and content (bottom sequence, red) signals are shown in inverted false color. When docking was clearly visible in the lipid channel, the content channel was still dim, because SRB was encapsulated at self-quenching concentrations (1). In the same frame where the lipid signals start to increase, announcing lipid mixing, the content signals also increase (dashed vertical line) due to dilution and dequenching of encapsulated SRB as some molecules escape through the pore. Once lipid transfer is complete (shortly after the maximum in the upper blue trace), the intensity in the lipid channel decreases due to photobleaching, as in Fig. 2. The SRB signals remain stable after lipid release (but bleach slowly (3)), indicating that the pore resealed after partial release of contents. In this example, initial lipid and content release occurred with comparable kinetics (2) within a few frames (each 18.3 ms apart). In other cases, release was markedly slower (see Fig. S7). To see this figure in color, go online.
Figure 4
Figure 4
Openness statistics of SNARE-mediated flickering fusion pores. (A) TIRF intensity versus time after fusion for two typical SNARE-mediated fusion events. The time course of the red trace (short-dashed curve fit, PC/PS) is well fit by Eq. 3 for a flickering pore, with openness Po=0.09 (short-dashed curve). The fit from Eq. 3 is poor for the blue trace (long-dashed curve fit, PC/PS/PE/PIP2/Ch+, 45% cholesterol), with nominal Po=3.48 (long-dashed curve), flagging a permanently open pore (Eq. 4). (B) SNARE-mediated fusion pores flicker and are dramatically opened by increasing cholesterol content. (Left) Flickering-pore openness, Po, and the fraction of pores that are permanently open ( Po=1 column) for each of the four lipid compositions studied (Table 1). The bin size is 0.05. (Right) Blowup of Po0.4 data (bin size, 0.01). (C and D) SNAREs play little or no role in fusion-pore flickering unless cholesterol content is high. Mean pore openness (C) and fraction of pores that are permanently open (D) versus composition for SNARE-mediated and SNARE-independent fusion-pore dynamics. Error bars in (C) and (D) indicate the mean ± SE; p < 0.05 using Student’s t-test. To see this figure in color, go online.
Figure 5
Figure 5
Physiological amounts of cholesterol accelerate fusion by clustering t-SNAREs. (A) Delay times to SNARE-mediated fusion after vesicle docking versus membrane lipid composition (solid bars) and calculated number of t-SNAREs assumed recruited by diffusion to the fusion site during the delay time (striped bars). Lower amounts of cholesterol (yellow (PC/PS/PE/PIP2) and green (PC/PS/PE/PIP2/Ch)) increase delay times, consistent with the reduced lipid diffusivities, but the number of t-SNAREs recruited for fusion is unchanged. At physiological cholesterol (PC/PS/PE/PIP2/Ch+), fusion is so accelerated that there is insufficient time to recruit any additional t-SNAREs after docking, suggesting that t-SNAREs are preclustered. (B) Physiological cholesterol levels increase the probability ∼3-fold that a docked vesicle undergoes SNARE-mediated fusion (as opposed to nonspecific fusion or no fusion) before complete bleaching (∼20 s). To see this figure in color, go online.
Figure 6
Figure 6
In TIRFM, the vesicle size and fluorescence reduction factor are unique functions of the docked-vesicle intensity. (A) The fluorescence intensity of a labeled lipid at a distance z from the SBL in a vesicle of radius Rves (lighter, yellow curve) is the product of the decaying incident evanescent wave intensity (darker, blue curve) and a polarization factor due to lipid orientation. The net fluorescence reduction factor for the vesicle, λTIRF, is the average of the lighter yellow curve weighted by the number of lipids at each height. (B and C) λTIRF and Rves are uniquely determined by the docked-vesicle intensity (139 fusion events; see the Supporting Material). (B) Values of λTIRF versus docked-vesicle intensity, Idock, from this study follow a best-fit exponential 0.64exp(Idock/350Ilip) (p < 0.05) (solid, red curve). The bin size is 10.7. (C) Values of Rves versus Idock are well described by the best-fit power law Rves=2.6(Idock/Ilip)0.61 nm (p < 0.05). The bin size is 10.7. (D) Values of λTIRF versus Rves from this study. The tangent at the origin (red dashed line) is a linear fit to Rves<35 nm points, constraining the intercept on the Rves axis to be the TIRF decay length, δTIRF= 68 nm (Supporting Material and Eq. S18) (p < 0.05). This yielded λTIRF0= 0.81 for the limiting value of λTIRF for small vesicles, a pure polarization effect. The bin size 3.6 nm. In (B)–(D), values are shown as the mean (dark, blue symbols) ± SD. To see this figure in color, go online.
Figure 7
Figure 7
Model of promotion of SNARE-mediated fusion by cholesterol. Cholesterol (triangles) clusters t-SNAREs in target membranes (left), increasing vesicle docking rates and providing multiple t-SNAREs that are instantly available for accelerated fusion (right). Once initiated, the openness of the flickering pore is increased by cholesterol 1) directly, by lowering the bending energy of the pore (Fig. S5), whose negative curvature is compatible with cholesterol’s large, negative spontaneous curvature, ∼−0.4 nm1 (55) (blow up, right); or 2) indirectly, by increasing the number of SNAREpins at the fusion pore. Increased openness stabilizes the pore and may increase content release rates and accelerate pore dilation (Fig. 1). To see this figure in color, go online.

References

    1. Lindau M., Alvarez de Toledo G. The fusion pore. Biochim. Biophys. Acta. 2003;1641:167–173. - PubMed
    1. Südhof T.C., Rothman J.E. Membrane fusion: grappling with SNARE and SM proteins. Science. 2009;323:474–477. - PMC - PubMed
    1. Zhou Z., Misler S., Chow R.H. Rapid fluctuations in transmitter release from single vesicles in bovine adrenal chromaffin cells. Biophys. J. 1996;70:1543–1552. - PMC - PubMed
    1. Staal R.G.W., Mosharov E.V., Sulzer D. Dopamine neurons release transmitter via a flickering fusion pore. Nat. Neurosci. 2004;7:341–346. - PubMed
    1. Bai J., Wang C.T., Chapman E.R. Fusion pore dynamics are regulated by synaptotagmin∗t-SNARE interactions. Neuron. 2004;41:929–942. - PubMed

Publication types