. 2016 Apr 12;110(7):1574-1581.
doi: 10.1016/j.bpj.2016.02.035.

Revealing Assembly of a Pore-Forming Complex Using Single-Cell Kinetic Analysis and Modeling

Affiliations

Revealing Assembly of a Pore-Forming Complex Using Single-Cell Kinetic Analysis and Modeling

Mirko Bischofberger et al. Biophys J. .

Abstract

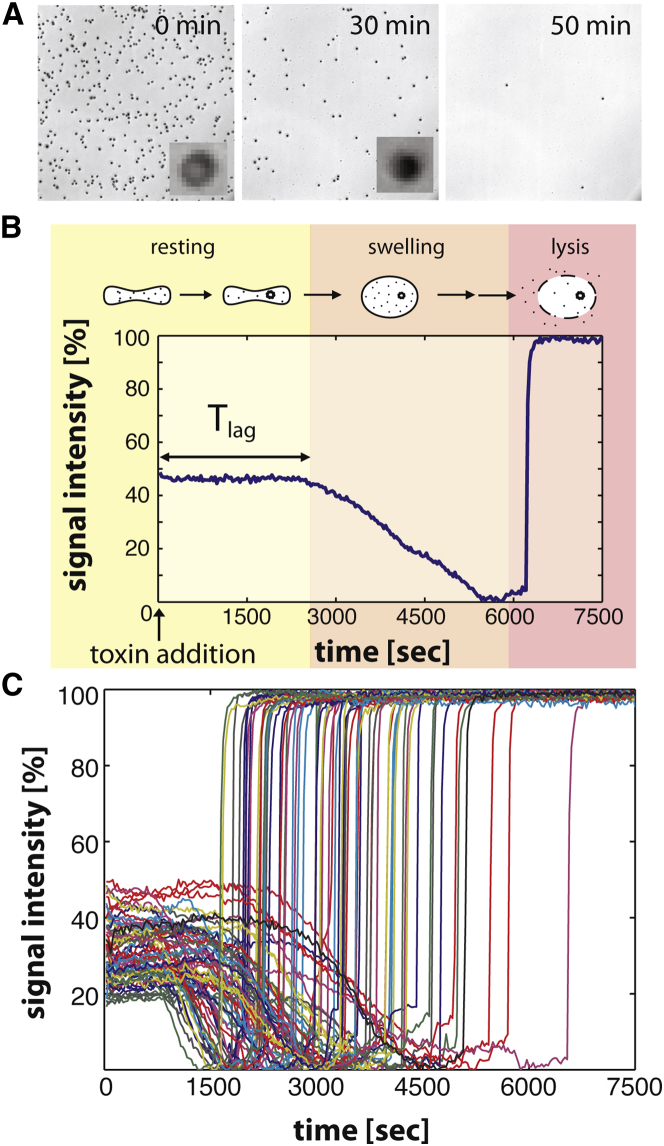
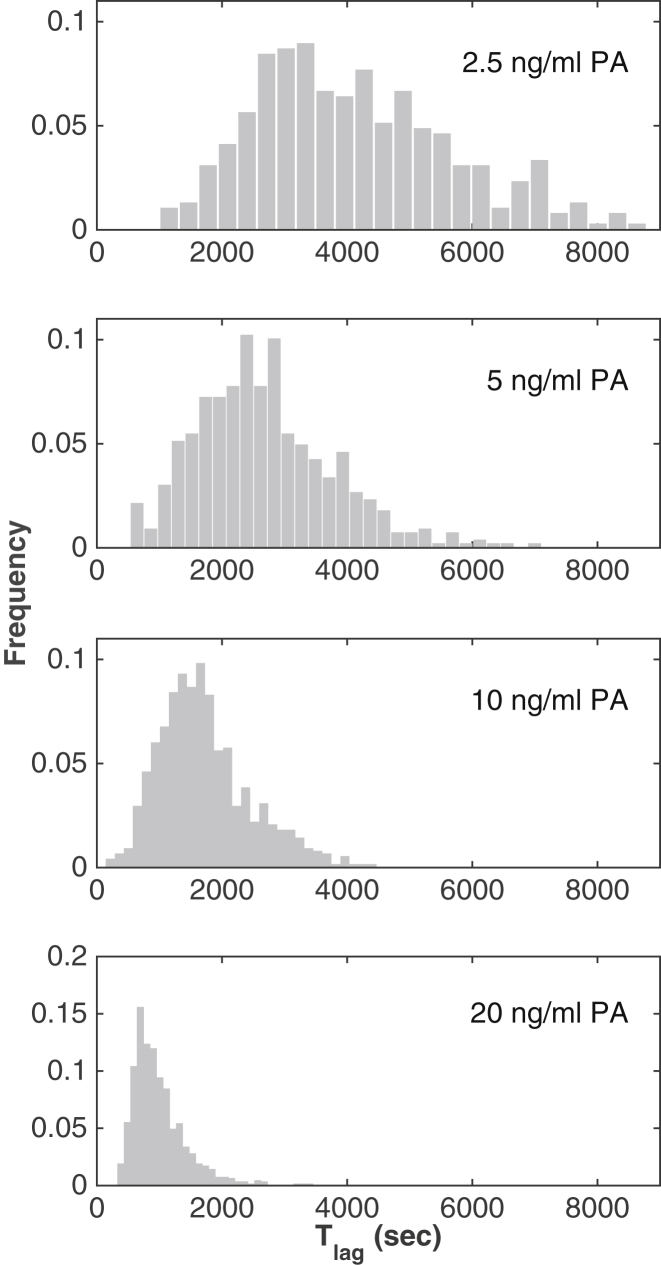
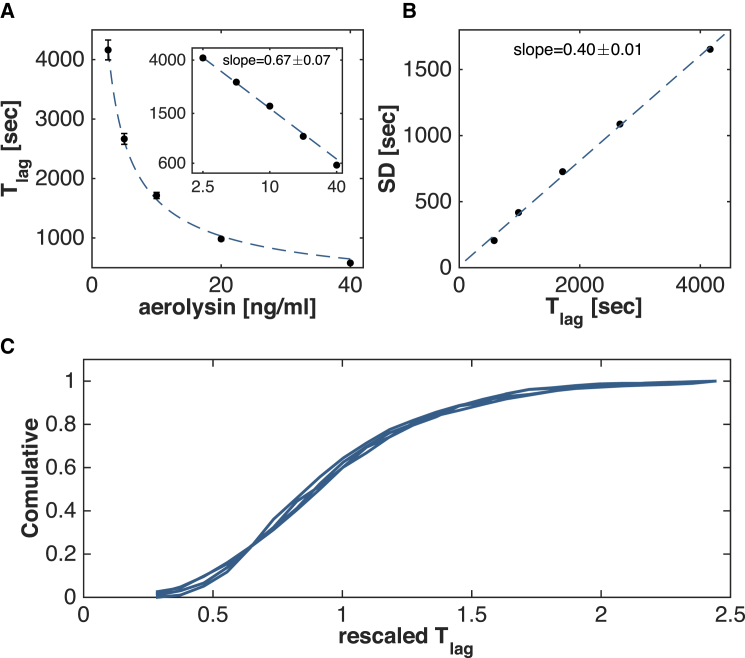
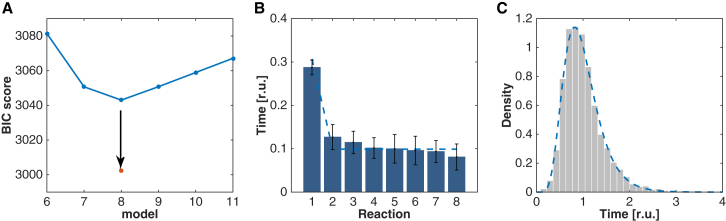
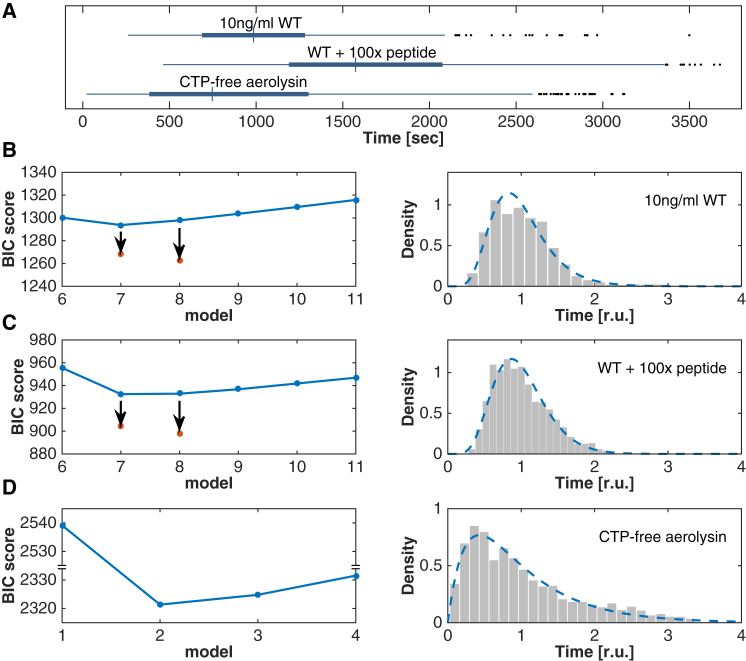
Many biological processes depend on the sequential assembly of protein complexes. However, studying the kinetics of such processes by direct methods is often not feasible. As an important class of such protein complexes, pore-forming toxins start their journey as soluble monomeric proteins, and oligomerize into transmembrane complexes to eventually form pores in the target cell membrane. Here, we monitored pore formation kinetics for the well-characterized bacterial pore-forming toxin aerolysin in single cells in real time to determine the lag times leading to the formation of the first functional pores per cell. Probabilistic modeling of these lag times revealed that one slow and seven equally fast rate-limiting reactions best explain the overall pore formation kinetics. The model predicted that monomer activation is the rate-limiting step for the entire pore formation process. We hypothesized that this could be through release of a propeptide and indeed found that peptide removal abolished these steps. This study illustrates how stochasticity in the kinetics of a complex process can be exploited to identify rate-limiting mechanisms underlying multistep biomolecular assembly pathways.


Figures

Figure 1
Figure 1
Single-cell hemolysis upon treatment with aerolysin. (A) Phase contrast images of single red blood cells subjected to 10 ng/mL of aerolysin. (Inset) Magnification of a single cell showing change in intensity upon pore formation. (B) Representative trace illustrating the typical morphological changes that occur upon toxin treatment. During the lag time, Tlag, the toxins bind, aggregate, and form the first pores (yellow). Then the cells osmotically swell (orange) and finally lyse when the pressure becomes too big (red). (C) Signal intensities of a selection of single-cell traces from the recording in (A) at 10 ng/mL aerolysin.
Figure 2
Figure 2
Distributions of pore formation lag times. Histograms of lag times Tlag for different initial concentrations of aerolysin. The distribution of lag times shifts to shorter times and gets narrowed with higher concentrations of aerolysin.
Figure 3
Figure 3
Scaling properties of lag times with monomer concentration. (A) Scaling of the average pore formation time 〈Tlag〉 as a power law in function of the initial aerolysin concentration. (Inset) Double logarithmic plot. The fitted slope is a = 0.67 ± 0.07. (B) Linear scaling of the SD of Tlag in function of the average of 〈Tlag〉. The fitted slope b = 0.4 ± 0.01 represents the coefficient of variation (CV = SD/〈Tlag〉) of the lag times Tlag and is independent of the concentration. (C) Cumulative distributions for different aerolysin concentrations collapse after being rescaled with a concentration-dependent power law.
Figure 4
Figure 4
(A) 7eq+1 reaction model is selected as the most parsimonious model. (A) BIC scores of models with reactions of different rates (blue) or with n reactions of equal rates plus an additional reaction (red dots). (B) Posterior mean reaction times (bars) and posterior standard deviation (error bars) of a model with N = 8 different reactions computed via MCMC sampling. (Dashed line) Fitted reaction times of a 7eq+1 reaction model. (C) Fit of a 7eq+1 reaction model (dashed line) to the rescaled pore formation lag times.
Figure 5
Figure 5
Influence of the aerolysin CTP on Tlag distributions. (A) Box plots for single erythrocytes treated with 10 ng/mL of aerolysin in the absence (top), presence of 100× excess free CTP (middle), or with the CTP-free aerolysin mutant (bottom). (BD) For the same conditions as in (A), BIC scores of models (left panels) with reactions of different rates (blue) or with n reactions of equal rates plus an additional reaction (red dots). Rescaled pore formation lag times Tlag (right panels) with fits to a 7eq+1 model or a model with N = 2 different reactions (dashed lines).

Similar articles

Cited by

References

    1. Minton A.P. Implications of macromolecular crowding for protein assembly. Curr. Opin. Struct. Biol. 2000;10:34–39. - PubMed
    1. Morris A.M., Watzky M.A., Finke R.G. Protein aggregation kinetics, mechanism, and curve-fitting: a review of the literature. Biochim. Biophys. Acta. 2009;1794:375–397. - PubMed
    1. Karsenti E., Nédélec F., Surrey T. Modelling microtubule patterns. Nat. Cell Biol. 2006;8:1204–1211. - PubMed
    1. Bischofberger M., Gonzalez M.R., van der Goot F.G. Membrane injury by pore-forming proteins. Curr. Opin. Cell Biol. 2009;21:589–595. - PubMed
    1. Iacovache I., van der Goot F.G., Pernot L. Pore formation: an ancient yet complex form of attack. Biochim. Biophys. Acta. 2008;1778:1611–1623. - PubMed

Publication types

MeSH terms