Review
. 2016 Aug;57(8):1339-59.
doi: 10.1194/jlr.R067314. Epub 2016 Apr 13.

Structure, function, and genetics of lipoprotein (a)

Affiliations
Review

Structure, function, and genetics of lipoprotein (a)

Konrad Schmidt et al. J Lipid Res. 2016 Aug.

Abstract

Lipoprotein (a) [Lp(a)] has attracted the interest of researchers and physicians due to its intriguing properties, including an intragenic multiallelic copy number variation in the LPA gene and the strong association with coronary heart disease (CHD). This review summarizes present knowledge of the structure, function, and genetics of Lp(a) with emphasis on the molecular and population genetics of the Lp(a)/LPA trait, as well as aspects of genetic epidemiology. It highlights the role of genetics in establishing Lp(a) as a risk factor for CHD, but also discusses uncertainties, controversies, and lack of knowledge on several aspects of the genetic Lp(a) trait, not least its function.

Keywords: Mendelian randomization; cardiovascular risk factor; copy number variation; lipoprotein metabolism.


Figures

Fig. 1.
Fig. 1.
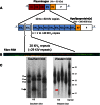
A: Schematic illustration of the structural homology between PLG and apo(a). PLG contains five different kringle structures (KI–KV) and a PD. The apo(a) is missing KI to KIII, but has a variable number of KIV copies. The minimum number is 10 (KIV-1 to KIV-10, including one copy of KIV-2). An individual can have more than 40 KIV-2 copies, which is the variable part of apo(a). Adapted and reprinted with permission of (2). B: Illustration of a two-color fiber-FISH image of the LPA KIV-2 domain from a 20-repeat allele using 4 kb (red) and 1.2 kb (green) intron probes, which enable the KIV-2 repeat number to be counted [for details see (139)]. C: Analysis of four samples from one family by PFGE/Southern blotting and Western blotting. This analysis demonstrates a null allele by simultaneous analysis of DNA by PFGE/Southern blotting (left) and plasma by Western blotting (right) from the same individuals. The arrow marks the absence of a signal corresponding to the allele with 15 KIV-2 repeats on the Western blot of the individual marked as K5. Figure adapted and reprinted with permission from (200).
Fig. 2.
Fig. 2.
A: Exon-intron structure of different domains of the human LPA gene. Each KIV domain (KIV-2 in red, KIV-1 and KIV-3 to KIV-10 shown in black) and KV (green) consists of two exons, while the PD (purple) has six exons. The location of the KpnI cutting sites and the nonsynonymous SNP, rs3798220, is shown (137, 157). Modified from (201). B: Exon-intron structure of the KIV-2 domain and directly flanking KIV-1 and KIV-3 domains. The KIV-2 CNV is shown according to the LPA reference sequence (ENSG00000198670; GRCh38), which contains six KIV-2 copies. Each KIV-2 copy has a size of 5.5 kb and consists of two exons separated by a long intron of 4 kb. A short intron of 1.2 kb separates the two KIV-2 copies. Exon 2 (182 bp) of each KIV-2 copy is identical (red). Exon 1 (160 bp) is of three different types: type A (shown in blue), type B (shown in green), and type C (not depicted here). Types A, B, and C of exon 1 are differentiated by synonymous mutations. The third KIV-2 copy in the LPA reference sequence (ENSG00000198670; GRCh38) contains exon 1 of type B and is shown here accordingly. Note that the type B exon 1 of KIV-2 is 100% identical in its nucleotide sequence to KIV-3 exon 1 (both shown in green), and KIV-2 exon 2 has 100% identical nucleotide sequence as KIV-1 exon 2 (shown in red). This figure is not drawn to the scale.
Fig. 3.
Fig. 3.
Frequency distribution of KIV CNV alleles in three continental groups. Short repeats are more frequent in Africans and long repeats in Asians. Data are from (24, 32, 36) and unpublished observations.
Fig. 4.
Fig. 4.
Inverse correlation of KIV-2 repeat length with Lp(a) plasma concentration. The apo(a) allele-associated Lp(a) concentrations were determined in individuals from an African population (Gabonese Bantu) by measuring total Lp(a) concentrations by ELISA and assigning the appropriate fraction to each of the 194 alleles by densitometric evaluation of immunoblots. Allele-associated levels are plotted against the number of KIV repeats. The figure demonstrates large differences in Lp(a) levels for KIV alleles of the same size and presence of short alleles with low Lp(a) concentrations. Data are from (24).
Fig. 5.
Fig. 5.
Possible distributions of sequence variations in the KIV-2 CNV. Different scenarios for the distributions of sequence variants (shown as filled circles) in KIV-2 copies of different sizes are illustrated. Low and high intra-allelic frequencies of a variant on short alleles (A) and longer alleles (B). C: The same number of KIV-2 copies harbors the variant on a short and a longer allele, i.e., the intra-allelic frequency of the variant is higher on the short allele. Thus detection of the variant is more likely if present on the short allele. D: Both alleles have the same intra-allelic frequency (20%), though the number of copies carrying the variant is different. Hence the probability of detection is the same. The order of variants carrying KIV-2 copies within the allele might vary, as shown in (E). These scenarios cannot be distinguished by present methods. Different variants can be allocated in cis (F) (shown for a genotype with one short and one longer allele) or in trans (G). While scenarios (F) and (G) cannot be distinguished in analyses based on diploid samples, this is possible if analysis is based on separated alleles. Panels H and I depict possible spreads of variants across the KIV-2 CNV (H) and between KIV-2 copies and the neighboring nonrepetitive KIV-3 (I) by gene conversion. Figure used and modified with permission from (200).
Fig. 6.
Fig. 6.
Scheme illustrating the determination of Lp(a) plasma levels by LPA gene variation and other factors. Major determinant is the KIV-2 CNV, which codes for isoform size in plasma. Because roughly 70–90% of all subjects express two apo(a) isoforms in plasma, a mixture of Lp(a) particles can be found in plasma. On average, small apo(a) alleles result in high Lp(a) concentrations and large apo(a) alleles result in low Lp(a) concentrations, as shown as isoform-specific Lp(a) concentration in this example. Therefore the total measured Lp(a) concentration in this individual is a mixture of particles consisting, to a major extent, of Lp(a) of small size. Besides the KIV-2 CNV, other genetic variants within the LPA gene region, as well as nongenetic factors, have an influence on Lp(a) concentrations.
Fig. 7.
Fig. 7.
Mendelian randomization approach to demonstrate a causal association between Lp(a) concentration and CHD. Because a low number of KIV copies (11–22 copies) is associated with high Lp(a) levels and high Lp(a) levels are associated with CHD, it follows that a low number of KIV copies will be associated with CHD if the association between Lp(a) and CHD is causal. As the latter is indeed the case, reverse causation [i.e., that CHD is secondarily causing an increase in Lp(a) levels] can be excluded. Figure reprinted with permission of (2).
Fig. 8.
Fig. 8.
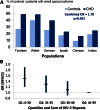
KIV-2 CNV and risk for CHD. A: The apo(a) isoforms and risk for myocardial infarction. The percentage of short apo(a) isoforms (≤22 KIV-2 repeats) in 1,570 controls and 1,013 patients with myocardial infarction from six ethnic groups is shown. Note that short isoforms differ in frequency between populations, but are more frequent in patients in each ethnic group. Data are taken from (163). Figure adapted and reprinted with permission from (213). B: Risk of myocardial infarction by quartiles of genomic KIV-2 repeats in the Copenhagen City Heart Study. KIV-2 copies are determined by qPCR and therefore reflect the sum of KIV-2 repeats of both apo(a) alleles. The data are multivariable adjusted and show a stepwise increase in risk with decrease of KIV-2 copy number. Figure is created based on the data from (138).

References

    1. Berg K. 1963. A new serum type system in man–the Lp system. Acta Pathol. Microbiol. Scand. 59: 369–382. - PubMed
    1. Kronenberg F., and Utermann G.. 2013. Lipoprotein(a): resurrected by genetics. J. Intern. Med. 273: 6–30. - PubMed
    1. Ehnholm C., Garoff H., Renkonen O., and Simons K.. 1972. Protein and carbohydrate composition of Lp(a)lipoprotein from human plasma. Biochemistry. 11: 3229–3232. - PubMed
    1. Gaubatz J. W., Heideman C., Gotto A. M. Jr., Morrisett J. D., and Dahlen G. H.. 1983. Human plasma lipoprotein(a): structural properties. J. Biol. Chem. 258: 4582–4589. - PubMed
    1. Utermann G., and Weber W.. 1983. Protein composition of Lp(a) lipoprotein from human plasma. FEBS Lett. 154: 357–361. - PubMed