

Does subchondral bone of the equine proximal phalanx adapt to race training?
- PMID: 27075139
- PMCID: PMC5341590
- DOI: 10.1111/joa.12478
Does subchondral bone of the equine proximal phalanx adapt to race training?
Abstract
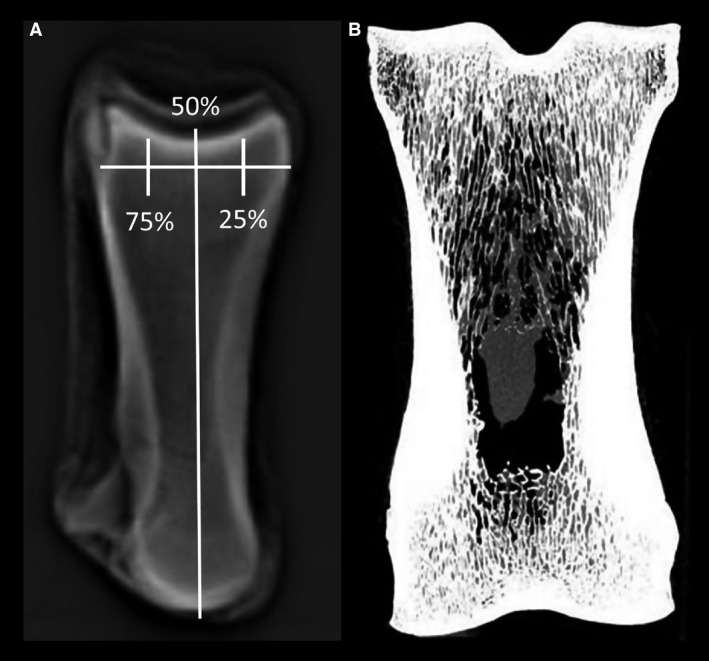
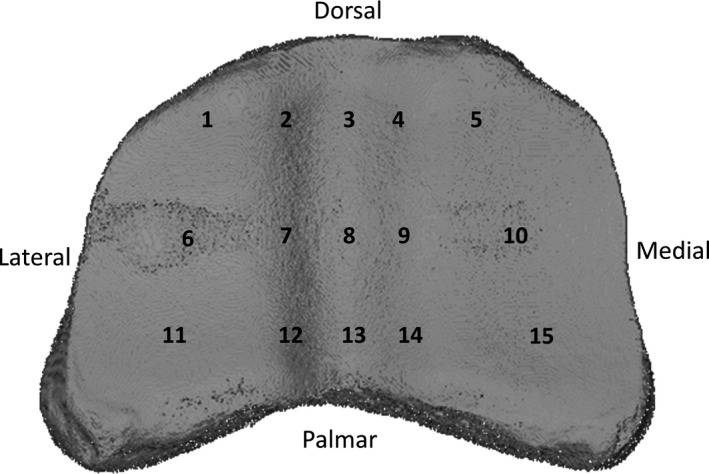
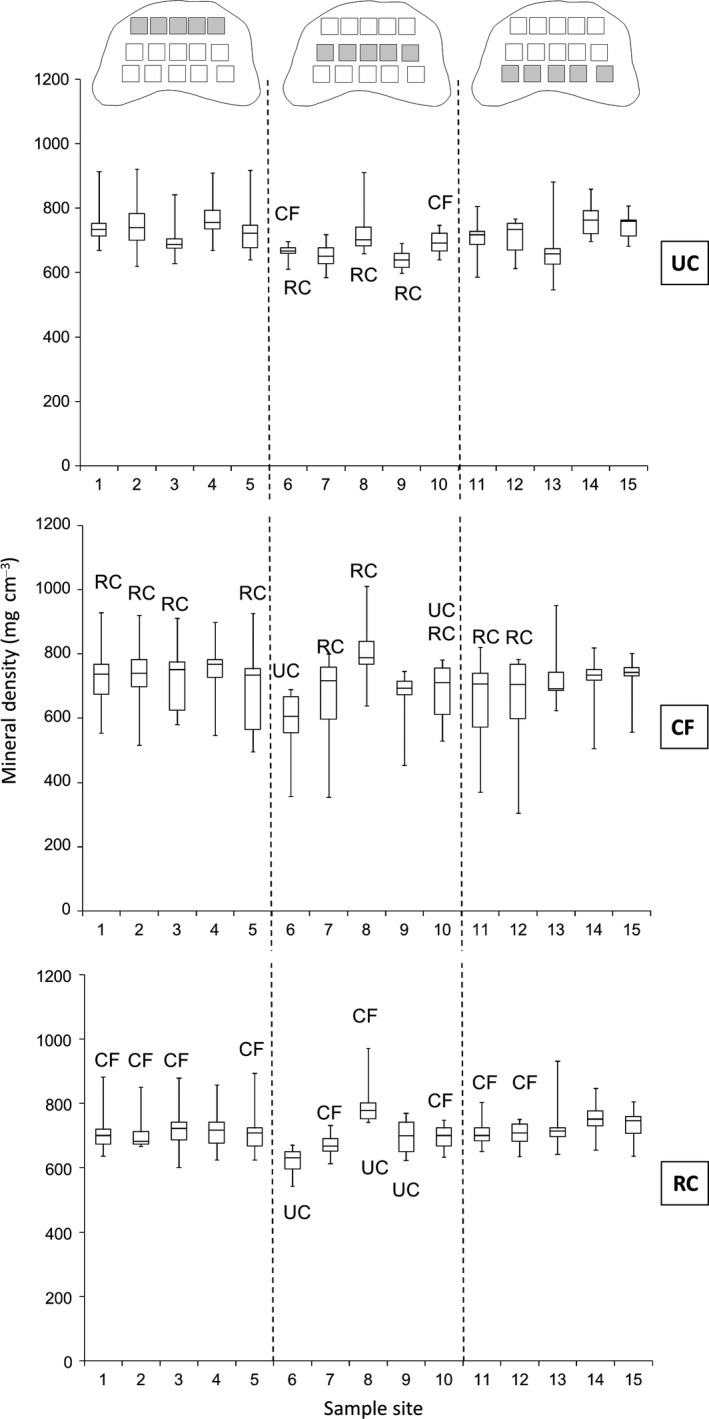
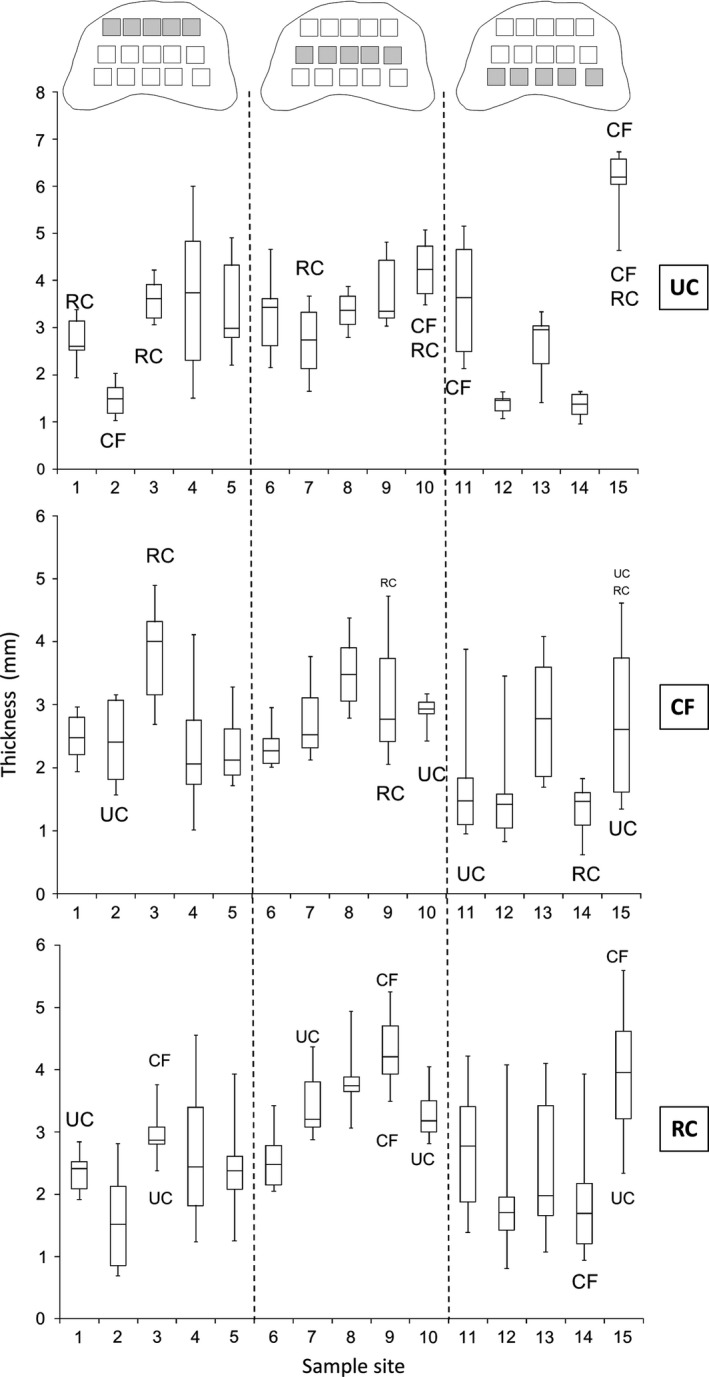
Sagittal fractures of the first phalanx are a common, potentially catastrophic injury in racehorses. These fractures are often linked to an acute, one time, biomechanical event; however, recent evidence implies that chronic exposure to stress can lead to the accumulation of bony changes that affect the structural integrity of the bone and increase the likelihood of fracture. The aim of the study was to compare variations of two common metrics of bone adaptation - subchondral bone density and thickness across the proximal articular surface of the first phalanx in Thoroughbred horses that (1) raced but never experienced a first phalanx fracture (Raced Control); (2) raced and had experienced fracture of the contralateral first phalanx (Contralateral to Fracture); (3) had never raced or experienced a first phalanx fracture (Unraced Control). A total of 22 first phalangeal bones were sampled post-mortem and imaged using micro-computed tomography calibrated for mineral density measures. Measurements of volumetric subchondral bone mineral density and thickness were taken from images at five sites from medial to lateral, in three coronal planes (25, 50 and 75% dorsal-palmar). At each of the 15 sites, measurements were repeated and averaged across 10 adjacent micro-computed tomography slices of bone, spanning 0.75 mm. The magnitude and variance of these measurements were compared between sites and between cohorts with non-parametric statistical tests. Across the proximal osteochondral surface of the first phalanx, the pattern of subchondral bone volumetric bone mineral density and thickness varied with each coronal section studied. The subchondral bone thickness was greater for the central and dorsal coronal sections, compared with the palmar section. For the race-fit groups (Raced Control and Contralateral to Fracture), the highest volumetric bone mineral density was in the central sagittal groove. The volumetric bone mineral density was significantly greater in the sagittal groove in the central coronal section in the raced than the unraced group. The Contralateral to Fracture group demonstrated significantly greater variance of volumetric bone mineral density compared with the Raced Control and Unraced Control (P < 0.0001), with no difference in variance noted between the Raced Control and Unraced Control groups. There was a small (R rank = 0.3) but significant correlation between subchondral bone volumetric bone mineral density and thickness in the Contralateral to Fracture group (P = 0.005). The findings demonstrate that differences exist in subchondral bone volumetric bone mineral density and thickness across the proximal osteochondral surface of the equine first phalanx in horses with different training histories. The findings also demonstrate that the subchondral bone of the sagittal groove of the equine first phalanx adapts to race-training in the race-fit groups (Raced Control and Contralateral to Fracture) with an increase in volumetric bone mineral density relative to unraced controls. Within the race-trained groups, the Contralateral to Fracture bones had a greater variance of volumetric bone mineral density, suggesting that stress-induced bone adaptation had become more erratic, potentially contributing to the aetiology of sagittal fractures of the first phalanx in the Thoroughbred racehorse.
Keywords: bone adaptation; equine; subchondral bone density.
© 2016 Anatomical Society.
Figures
Similar articles
-
High-intensity exercise induces structural, compositional and metabolic changes in cuboidal bones--findings from an equine athlete model.Bone. 2008 Oct;43(4):724-33. doi: 10.1016/j.bone.2008.06.003. Epub 2008 Jun 19. Bone. 2008. PMID: 18619567
-
Radiographic evaluation of changes in the proximal phalanx of Thoroughbreds in race training.Am J Vet Res. 2011 Nov;72(11):1482-8. doi: 10.2460/ajvr.72.11.1482. Am J Vet Res. 2011. PMID: 22023126
-
Subchondral focal osteopenia associated with proximal sesamoid bone fracture in Thoroughbred racehorses.Equine Vet J. 2021 Mar;53(2):294-305. doi: 10.1111/evj.13291. Epub 2020 Jul 23. Equine Vet J. 2021. PMID: 32474944
-
Bone fatigue and its implications for injuries in racehorses.Equine Vet J. 2014 Jul;46(4):408-15. doi: 10.1111/evj.12241. Epub 2014 Apr 1. Equine Vet J. 2014. PMID: 24528139 Review.
-
Advancements in Subchondral Bone Biomechanics: Insights from Computed Tomography and Micro-Computed Tomography Imaging in Equine Models.Curr Osteoporos Rep. 2024 Dec;22(6):544-552. doi: 10.1007/s11914-024-00886-y. Epub 2024 Sep 14. Curr Osteoporos Rep. 2024. PMID: 39276168 Free PMC article. Review.
Cited by
-
Lesion Distribution in the Metacarpophalangeal and Metatarsophalangeal Region of 341 Horses Using Standing Magnetic Resonance Imaging.Animals (Basel). 2024 Jun 25;14(13):1866. doi: 10.3390/ani14131866. Animals (Basel). 2024. PMID: 38997978 Free PMC article.
-
Bone marrow oedema-type signal in the proximal phalanx of Thoroughbred racehorses.J Vet Med Sci. 2019 Apr 16;81(4):593-597. doi: 10.1292/jvms.18-0530. Epub 2019 Mar 4. J Vet Med Sci. 2019. PMID: 30828037 Free PMC article.
-
Histological and Histopathological Features of the Third Metacarpal/Tarsal Parasagittal Groove and Proximal Phalanx Sagittal Groove in Thoroughbred Horses with Racing History.Animals (Basel). 2024 Jun 30;14(13):1942. doi: 10.3390/ani14131942. Animals (Basel). 2024. PMID: 38998057 Free PMC article.
-
Conservative versus surgical treatment of 21 sports horses with osseous trauma in the proximal phalangeal sagittal groove diagnosed by low-field MRI.Vet Surg. 2018 Oct;47(7):908-915. doi: 10.1111/vsu.12936. Epub 2018 Sep 14. Vet Surg. 2018. PMID: 30216476 Free PMC article.
-
Metacarpophalangeal Joint Pathology and Bone Mineral Density Increase with Exercise but Not with Incidence of Proximal Sesamoid Bone Fracture in Thoroughbred Racehorses.Animals (Basel). 2023 Feb 24;13(5):827. doi: 10.3390/ani13050827. Animals (Basel). 2023. PMID: 36899684 Free PMC article.
References
-
- Anthenill LA, Gardner IA, Pool RR, et al. (2010) Comparison of macrostructural and microstructural bone features in Thoroughbred racehorses with and without midbody fracture of the proximal sesamoid bone. Am J Vet Res 71, 755–765. - PubMed
-
- Barr E, Pinchbeck G, Clegg P, et al. (2009) Post mortem evaluation of palmar osteochondral disease (traumatic osteochondrosis) of the metacarpo/metatarsophalangeal joint in Thoroughbred racehorses. Equine Vet J 41, 366–371. - PubMed
-
- Beccati F, Pepe M, di Meo A, et al. (2011) Radiographic evaluation of changes in the proximal phalanx of Thoroughbreds in race training. Am J Vet Res 72, 1482–1488. - PubMed
-
- Brama PAJ, Karssenberg D, Barneveld A, et al. (2001) Contact areas and pressure distribution on the proximal articular surface of the proximal phalanx under sagittal plane loading. Equine Vet J 33, 26–32. - PubMed
-
- Brama PAJ, Tekoppele JM, Bank RA, et al. (2002) Biochemical development of subchondral bone from birth until age eleven months and the influence of physical activity. Equine Vet J 34, 143–149. - PubMed
Publication types
MeSH terms
Grants and funding
LinkOut - more resources
Full Text Sources
Other Literature Sources
