. 2016 Jun 1;27(11):1712-27.
doi: 10.1091/mbc.E15-12-0835. Epub 2016 Apr 13.

NFκB is a central regulator of protein quality control in response to protein aggregation stresses via autophagy modulation

Affiliations

NFκB is a central regulator of protein quality control in response to protein aggregation stresses via autophagy modulation

Mathieu Nivon et al. Mol Biol Cell. .

Abstract

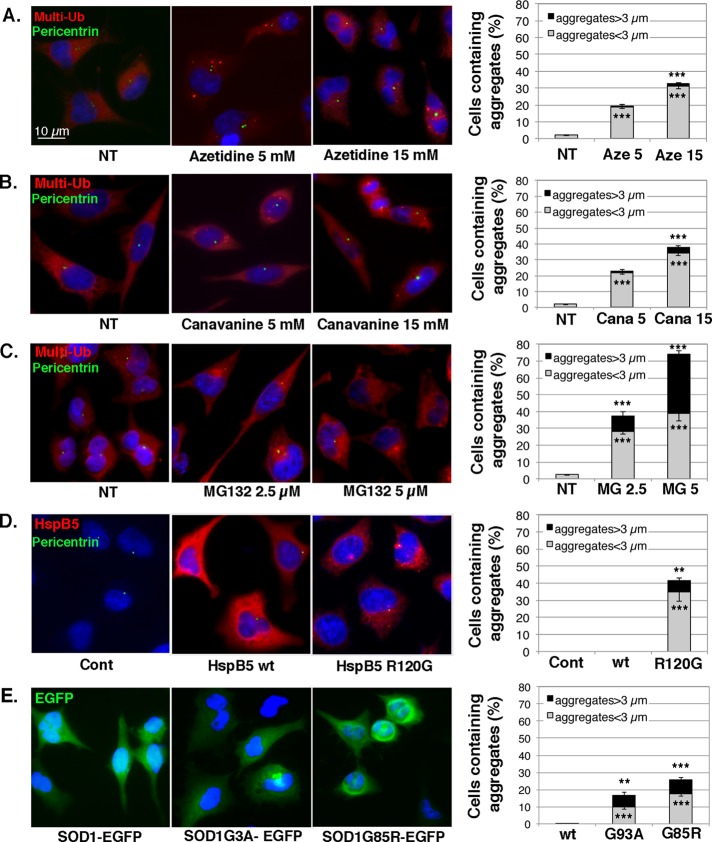
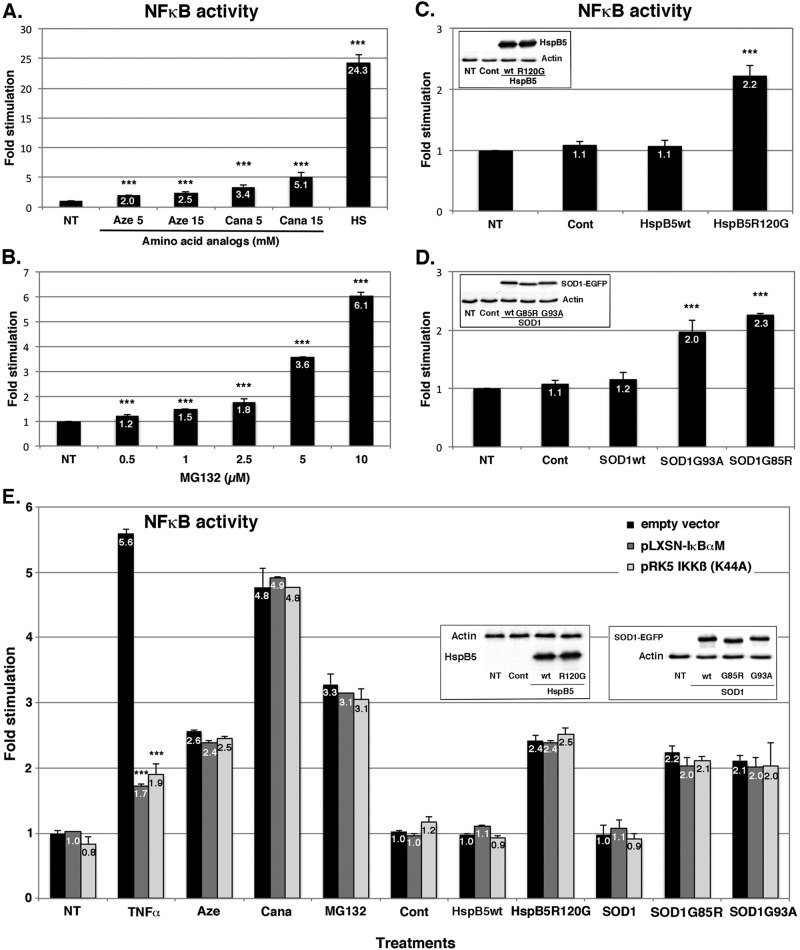
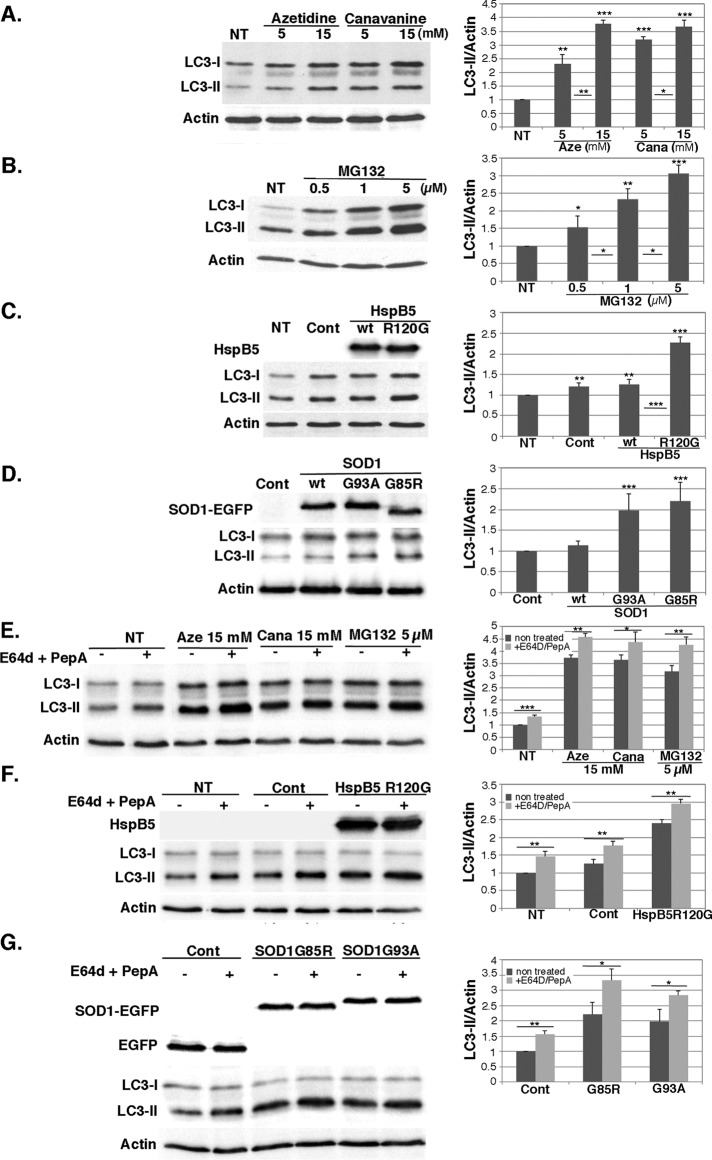
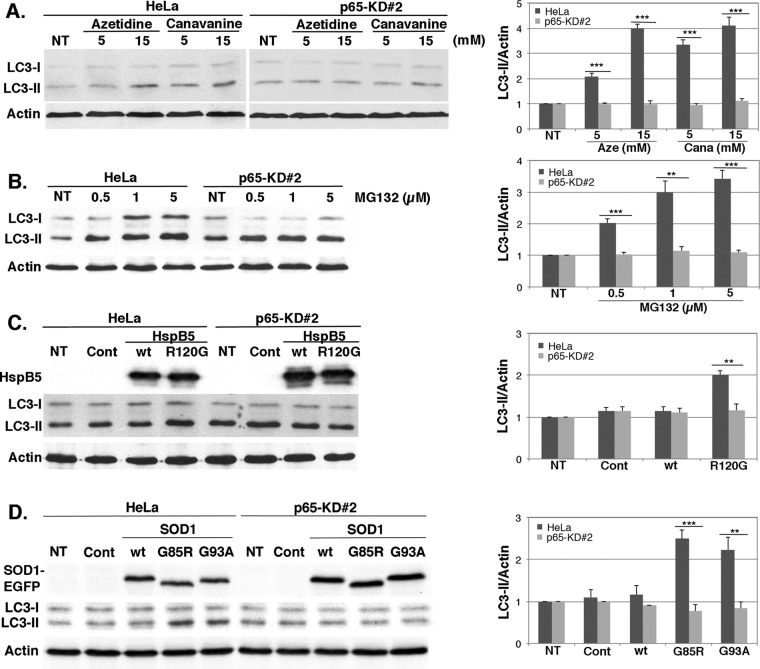
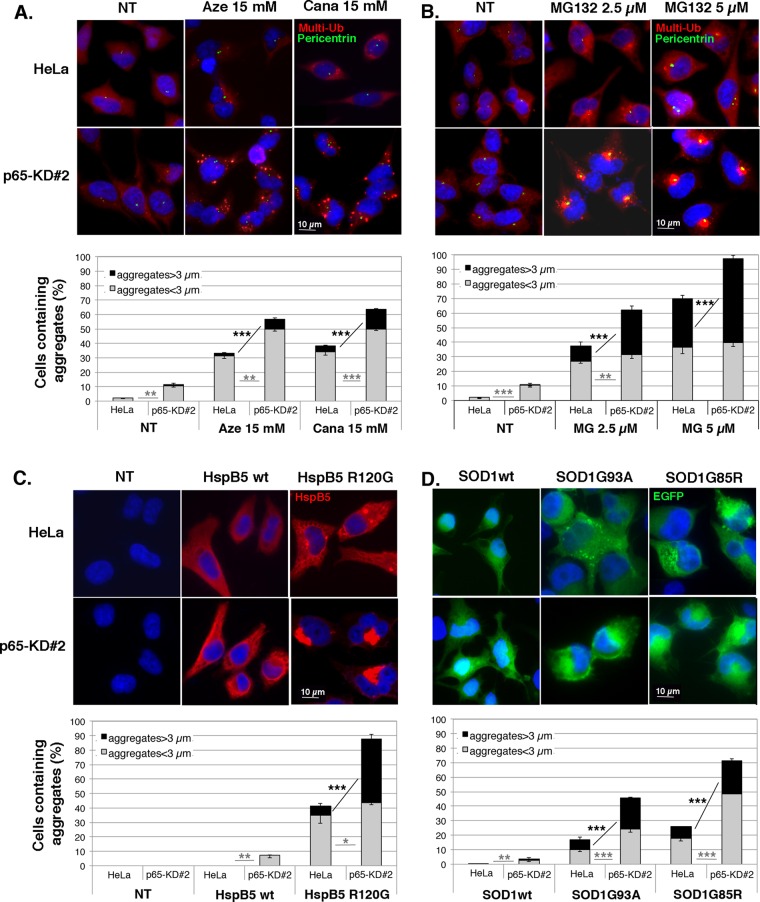
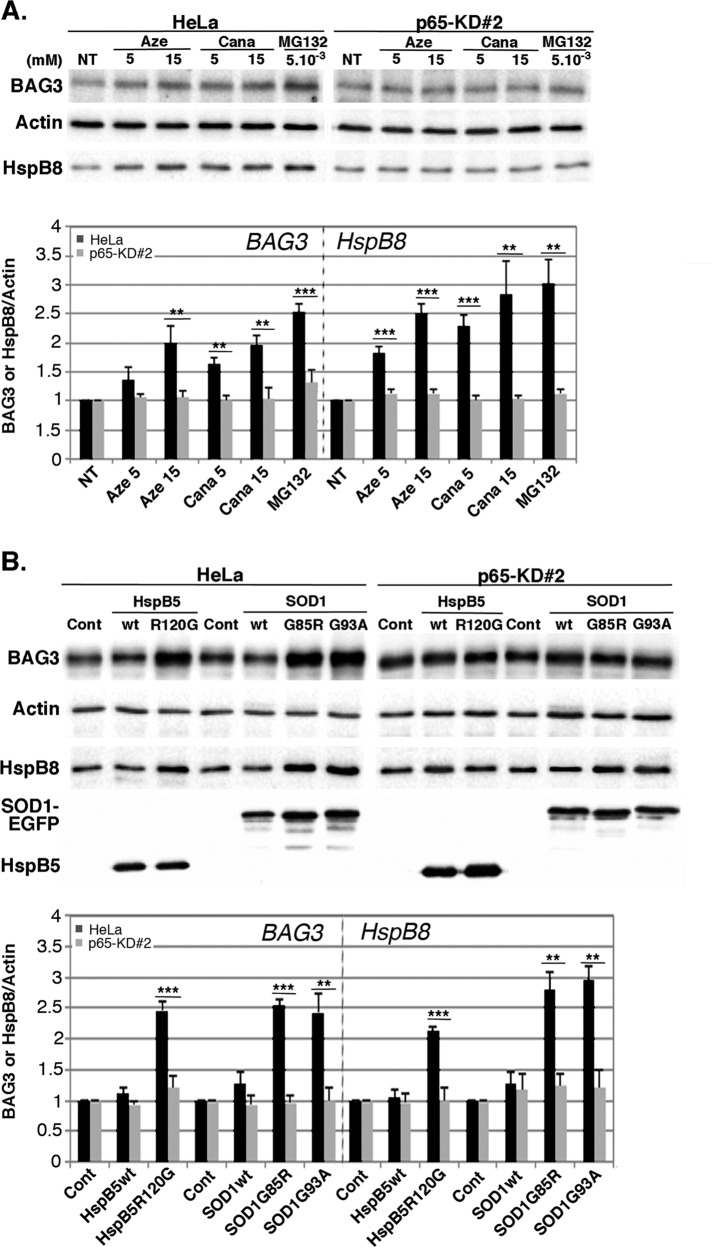
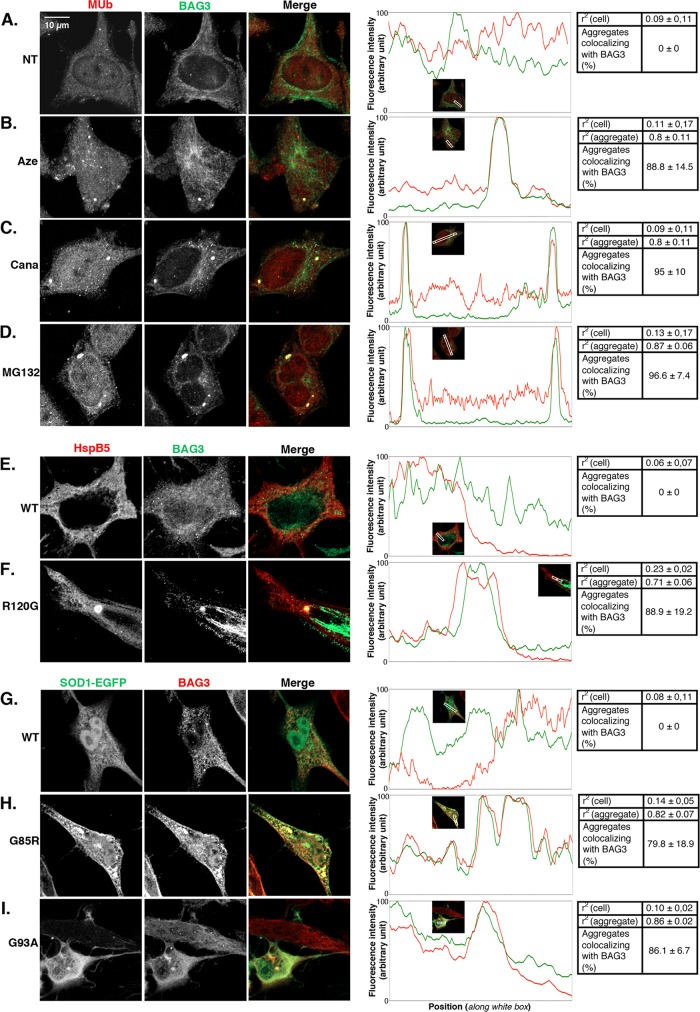
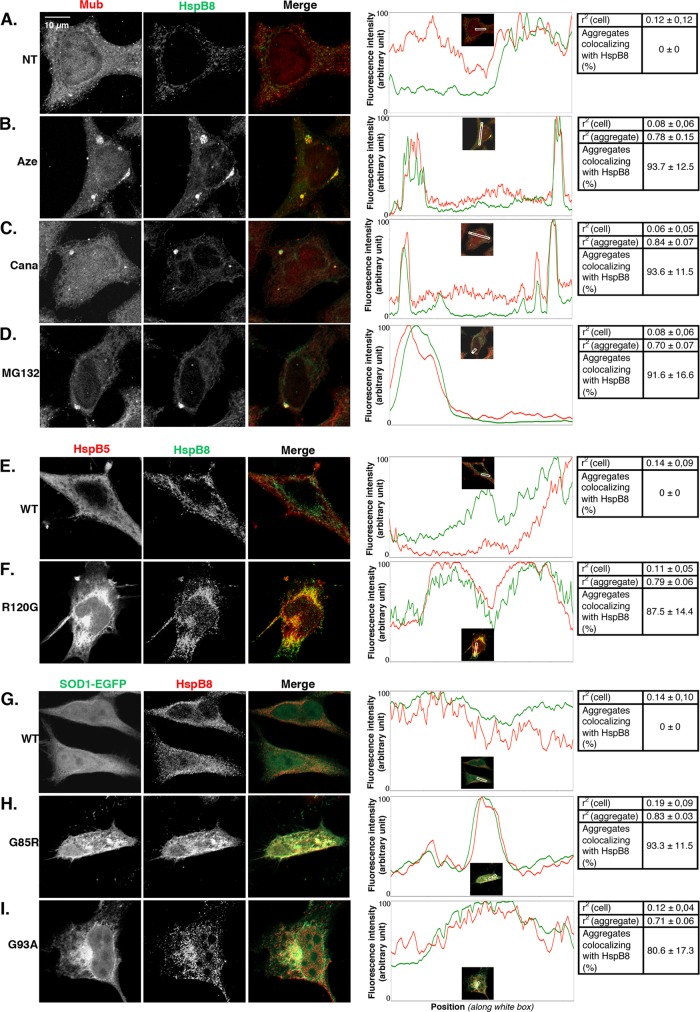
During cell life, proteins often misfold, depending on particular mutations or environmental changes, which may lead to protein aggregates that are toxic for the cell. Such protein aggregates are the root cause of numerous diseases called "protein conformational diseases," such as myofibrillar myopathy and familial amyotrophic lateral sclerosis. To fight against aggregates, cells are equipped with protein quality control mechanisms. Here we report that NFκB transcription factor is activated by misincorporation of amino acid analogues into proteins, inhibition of proteasomal activity, expression of the R120G mutated form of HspB5 (associated with myofibrillar myopathy), or expression of the G985R and G93A mutated forms of superoxide dismutase 1 (linked to familial amyotrophic lateral sclerosis). This noncanonical stimulation of NFκB triggers the up-regulation of BAG3 and HspB8 expression, two activators of selective autophagy, which relocalize to protein aggregates. Then NFκB-dependent autophagy allows the clearance of protein aggregates. Thus NFκB appears as a central and major regulator of protein aggregate clearance by modulating autophagic activity. In this context, the pharmacological stimulation of this quality control pathway might represent a valuable strategy for therapies against protein conformational diseases.


Figures

FIGURE 1:
FIGURE 1:
Amino acid analogue or MG132 treatment and overexpression of mutated forms of HspB5 and SOD1 induce the formation of protein aggregates. HeLa cells were untreated (NT) or subjected to 5 and 15 mM azetidine (A) or canavanine (B) treatment or 2.5 and 5 μM MG132 treatment (C) for 6 h and allowed to recover in fresh culture medium for 16 h. HeLa cells were transiently transfected with control (Cont) plasmids (see Materials and Methods) or plasmids expressing wild-type HspB5 or its mutated form, HspB5R120G (D), or wild-type SOD1-EGFP or its mutated forms, SOD1G93A-EGFP and SOD1G85R-EGFP (E), and were analyzed 48 h after transfection. Cells were fixed, permeabilized, and stained with antibodies against multiubiquitin (red staining) and pericentrin (indicator of MTOC localization; green staining; A–C) or HspB5 (red staining; D) and pericentrin (green staining; D). Nuclei were stained with Hoechst (blue), and cells were analyzed with a fluorescence microscope. The percentage of cells containing aggregates larger or smaller than 3 μm is reported in the histograms. n = 4.
FIGURE 2:
FIGURE 2:
Protein aggregation stresses stimulate NFκB activity. pNFκBLuc stable HeLa transformants were untreated (NT) or treated with 5 or 15 mM azetidine (Aze) or canavanine (Cana; A) or with increasing concentration (0.5–10 μM) of MG132 (B) for 6 h. As a positive control for NFκB induction, cells were also subjected to 90-min heat shock treatment (HS) at 43°C (A). (C, D) HeLa cells were transiently transfected or not (NT) with control plasmids (Cont) or plasmids expressing wild-type HspB5 or its mutated form, HspB5R120G (C), or wild- type SOD1-EGFP or its mutated forms, SOD1G93A-EGFP and SOD1G85R-EGFP (D). (E) pNFκBLuc HeLa cells were either transfected with an empty vector or with expression vectors for dominant-negative mutants of IκBα (pLXSN-IκBα) or of IKKβ (pRK5-IKKβ(K44A)). The next day, cells were treated with 2000 U/ml TNFα for 4 h, followed by 16 h of recovery or subjected to the same treatments as described (15 mM Aze or Cana, 5 μM MG132, or expression of wild-type and mutated forms of HspB5 and SOD1). Insets, immunoblot analysis of HspB5 and SOD1-EGFP levels in transfected HeLa cells 48 h after transfection. Luciferase activity was measured 16 h after treatment or 48 h after transfection. Results are presented as fold stimulation (ratio between luciferase activity after treatment vs. luciferase activity in NT counterpart). Results are presented as mean ± SD. n ≥ 3.
FIGURE 3:
FIGURE 3:
Amino acid analogue or MG132 treatment and overexpression of mutated forms of HspB5 and SOD1 increase autophagic flux. HeLa cells were either nontreated (NT) or subjected to azetidine or canavanine (5 or 15 mM) treatment (A) or MG132 (0.5–5 μM) treatment (B) for 6 h. (C, D) Cells were left untreated (NT) or transiently transfected with control plasmids (Cont) or plasmids expressing wild-type HspB5 and its mutated form, HspB5R120G (C), or wild-type SOD1-EGFP and its mutated forms, SOD1G93A-EGFP and SOD1G85R-EGFP (D). (E–G) HeLa cells were subjected to the same treatments as described in the presence of 5 μM cathepsin inhibitors pepstatin A (PepA) and E64d. The inhibitors were added concomitantly to the treatment or just after transfection and were not removed until protein extraction. Total protein extracts were prepared 16 h after treatment and 24 h after transfection and subjected to SDS–PAGE. Immunoblots were probed with antibodies against LC3-I and -II, HspB5, EGFP, and actin (as a loading control). The histograms show LC3-II/actin ratios, which were calculated from quantifications of LC3-II and actin bands of Western blots by ImageJ (n = 3; ratio was set at 1.0 for NT or Cont-transfected cells). Results are representative of three independent experiments.
FIGURE 4:
FIGURE 4:
p65 depletion alters autophagy induction by protein aggregation stresses. Control (HeLa) and p65-depleted cell lines (p65-KD#2) were left untreated or subjected to amino acid analogue (azetidine and canavanine; A) or MG132 treatment (B) as described in Figure 3. (C, D) Cell lines were untreated (NT) or transiently transfected with control plasmids (Cont) or plasmid expressing wild-type or mutated forms of HspB5 (C) and SOD1-EGFP (D) as described in Figure 3. Total protein extracts were analyzed in immunoblots probed with LC3, HSPB5, EGFP, and actin antibodies. The histograms show LC3-II/Actin ratios calculated as described in Figure 3. Results are representative of four independent experiments.
FIGURE 5:
FIGURE 5:
p65-deficient cells show increased protein aggregation in response to various protein aggregation stresses. Control (HeLa) and p65-depleted cell lines (p65-KD#2) were either untreated (NT) or treated for 6 h with 15 mM azetidine (Aze) or canavanine (Cana; A) or with 2.5 and 5 μM MG132 (B). (C, D) Cell lines were untreated or transiently transfected with plasmids expressing HspB5wt and HspB5R120G (C) or SOD1wt-EGFP, SOD1G93A-EGFP, and SOD1G85R-EGFP (D). Immunofluorescence analyses were performed 16 h after treatment or 48 h after transfection. Cells were fixed, permeabilized, and stained with multiubiquitin (red staining) and pericentrin (green staining) antibodies (A, B) or with HspB5 antibody (red staining; C). Fluorescent antibodies, SOD1-EGFP proteins, and nuclei stained with Hoechst (blue staining) were visualized under a fluorescence microscope. Percentage of cells containing aggregates larger or smaller than 3 μm is shown in the histograms (mean ± SD); n = 3.
FIGURE 6:
FIGURE 6:
NFκB up-regulates BAG3 and HspB8 expression after various protein aggregation stresses. (A) Control (HeLa) and p65-depleted (p65-KD#2) cell lines were either untreated (NT) or treated with 5 and 15 mM azetidine (Aze) and canavanine (Cana) or 5 μM MG132 for 6 h. At 16 h after treatments, total protein extracts were prepared and analyzed by immunoblots probed with antibodies against BAG3, HspB8, and actin (as a loading control). (B) As in A, but with HeLa and p65-KD#2 cell lines transiently transfected with control plasmids (Cont) or plasmids expressing HspB5wt, HspB5R120G, SOD1wt-EGFP, SOD1G93A-EGFP, or SOD1G85R-EGFP. Analysis was performed 35 h posttransfection. Expression of HspB5 and SOD1-EGFP was checked by probing immunoblots with anti-HspB5 and anti-EGFP antibodies. BAG3 and HspB8 levels were quantified; the densitometric measurements were normalized to the corresponding actin bands, and ratios were calculated between HeLa or p65-KD#2-treated cells vs. nontreated counterparts and are reported in the graphs (n = 3).
FIGURE 7:
FIGURE 7:
BAG3 colocalizes with protein aggregates induced by various aggregation stresses. (A–D) HeLa cells were either nontreated (A) or treated with 15 mM azetidine (B) and canavanine (C) or with 5 μM MG132 (D) for 6 h. At 16 h after treatment, cells were fixed and analyzed by confocal microscopy for BAG3 and multiubiquitin localization. (E–I) Cells were transiently transfected with plasmids expressing HspB5wt (E) or HspB5R120G (F) or SOD1 wt-EGFP (G), SOD1G85R-EGFP (H), and SOD1G93A-EGFP (I). At 48 h after transfection, cells were fixed and analyzed by confocal microscopy for BAG3, HspB5, and SOD1-EGFP localization. Single channels and channel overlays (merge) are shown. The intensity of red and green fluorescence measured along portions (white lines in inset pictures) that cross over aggregates is plotted for each condition. Each table indicates the r2 and the percentage of aggregates colocalizing with BAG3, where r2 is the mean of the squares of Pearson’s correlation coefficient r (mean ± SD) in aggregate-containing and random aggregate-devoid portions of the cells; a value close to 0 indicates a lack of colocalization, and a value close to 1 indicates complete colocalization, because all values are positive. The r2 values of the aggregate-containing vs. aggregate-devoid portions are statistically different with p < 0.001. Percentage of colocalization of BAG3 with multiubiquitinated aggregates (mean ± SD) is also indicated in the tables and was determined by geometrical center–based colocalization. Results are representative of three identical experiments.
FIGURE 8:
FIGURE 8:
HspB8 colocalizes with protein aggregates induced by various aggregation stresses. (A–I) Same as in Figure 7, but cells were analyzed by confocal microscopy for multiubiquitin, HspB5, SOD1-EGFP, and HspB8 localization.

Similar articles

Cited by

References

    1. Bampton ET, Goemans CG, Niranjan D, Mizushima N, Tolkovsky AM. The dynamics of autophagy visualized in live cells: from autophagosome formation to fusion with endo/lysosomes. Autophagy. 2005;1:23–36. - PubMed
    1. Behrends C, Fulda S. Receptor proteins in selective autophagy. Int J Cell Biol. 2012;2012:673290. - PMC - PubMed
    1. Carra S. The stress-inducible HspB8-Bag3 complex induces the eIF2alpha kinase pathway: implications for protein quality control and viral factory degradation. Autophagy. 2009;5:428–429. - PubMed
    1. Carra S, Seguin SJ, Lambert H, Landry J. HspB8 chaperone activity toward poly(Q)-containing proteins depends on its association with Bag3, a stimulator of macroautophagy. J Biol Chem. 2008a;283:1437–1444. - PubMed
    1. Carra S, Seguin SJ, Landry J. HspB8 and Bag3: a new chaperone complex targeting misfolded proteins to macroautophagy. Autophagy. 2008b;4:237–239. - PubMed

MeSH terms

LinkOut - more resources