. 2016 Apr 14:7:11220.
doi: 10.1038/ncomms11220.

Explosive cell lysis as a mechanism for the biogenesis of bacterial membrane vesicles and biofilms

Affiliations

Explosive cell lysis as a mechanism for the biogenesis of bacterial membrane vesicles and biofilms

Lynne Turnbull et al. Nat Commun. .

Abstract

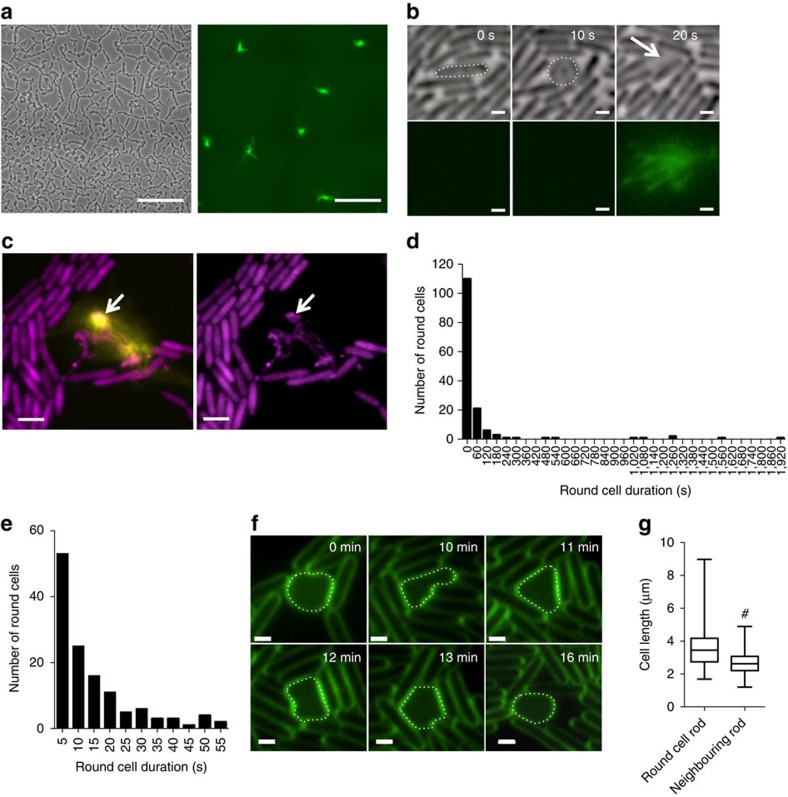
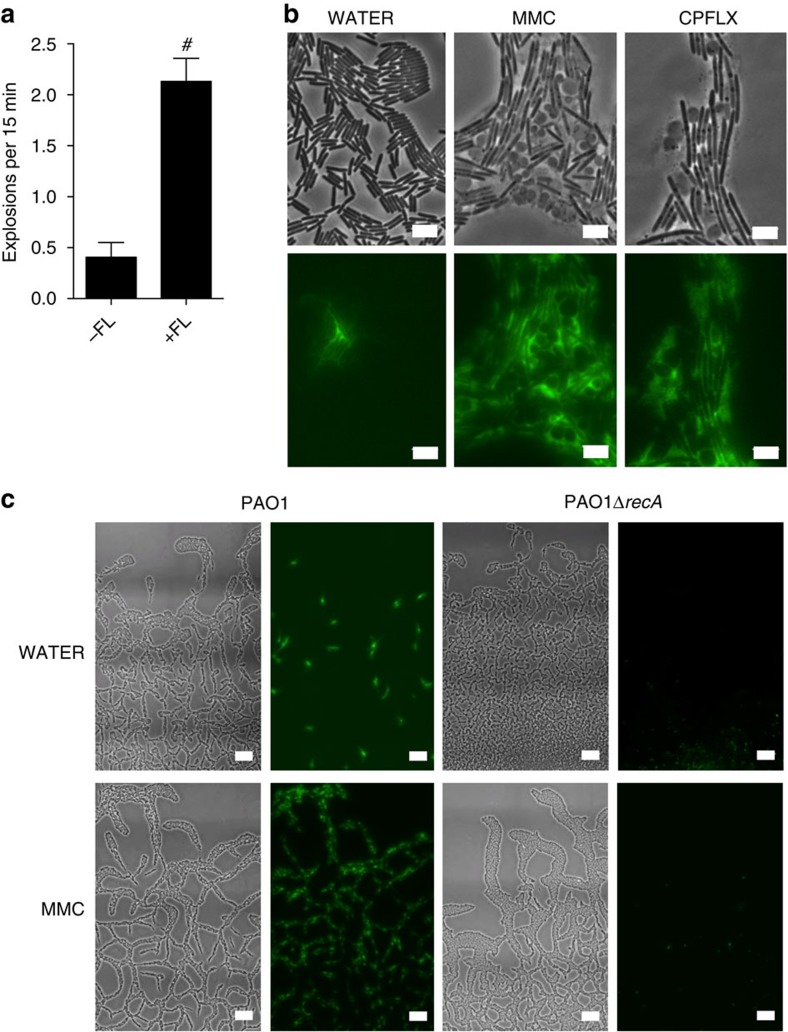
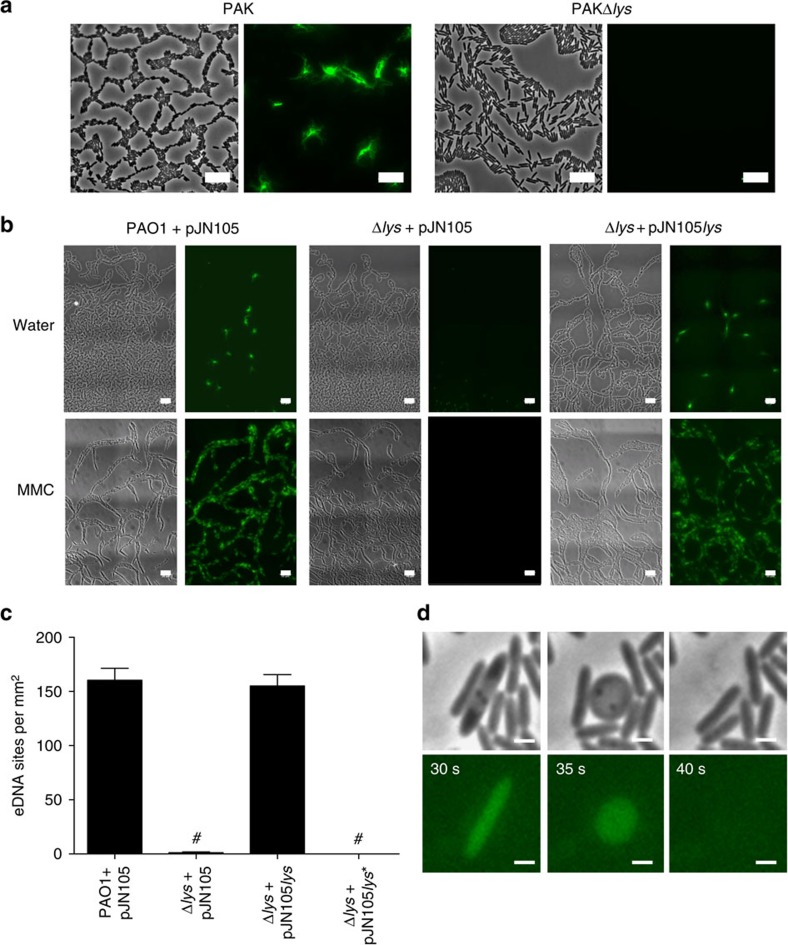
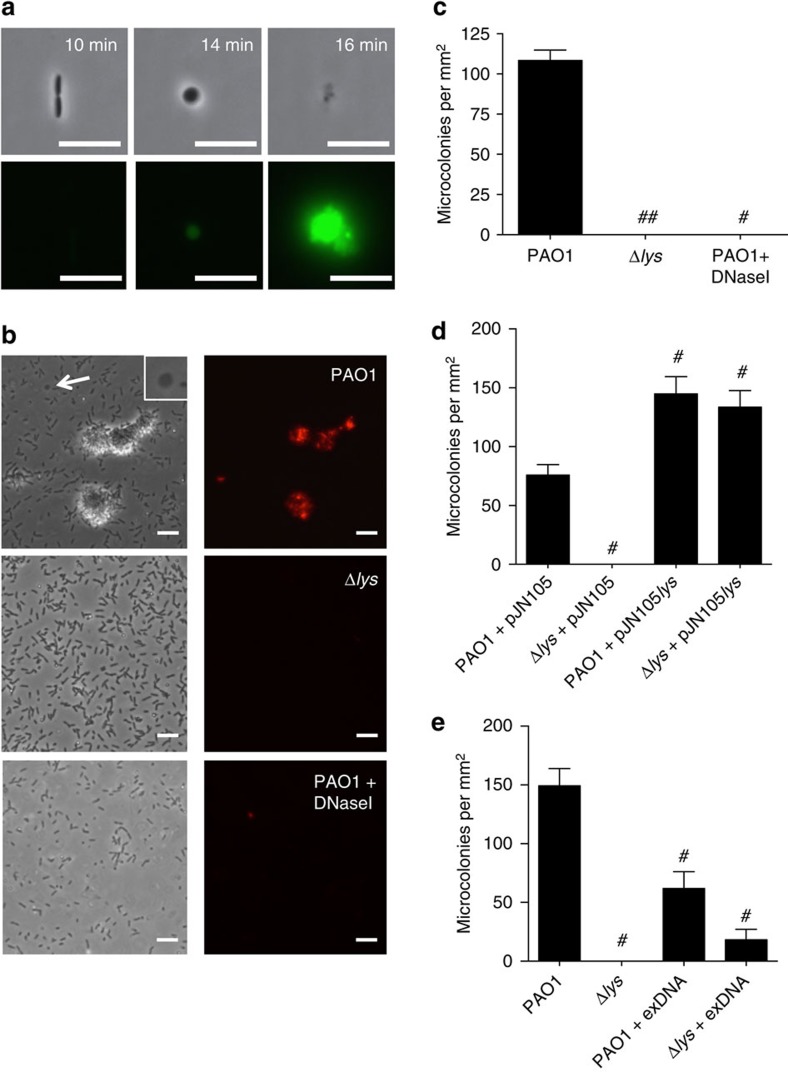
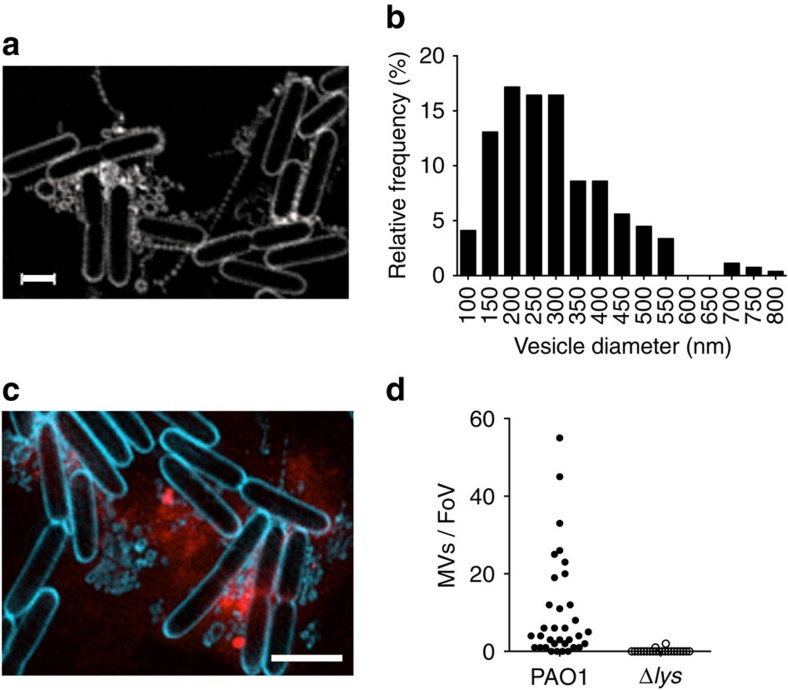
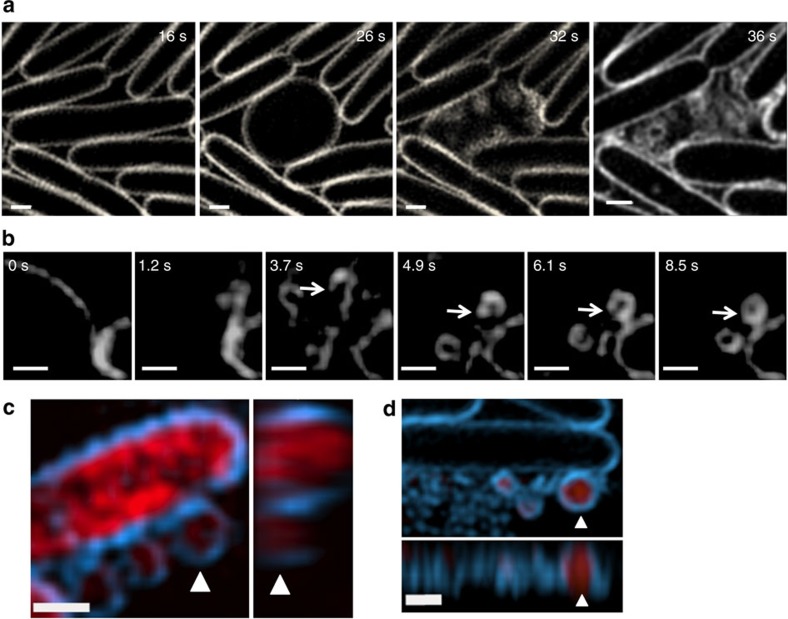
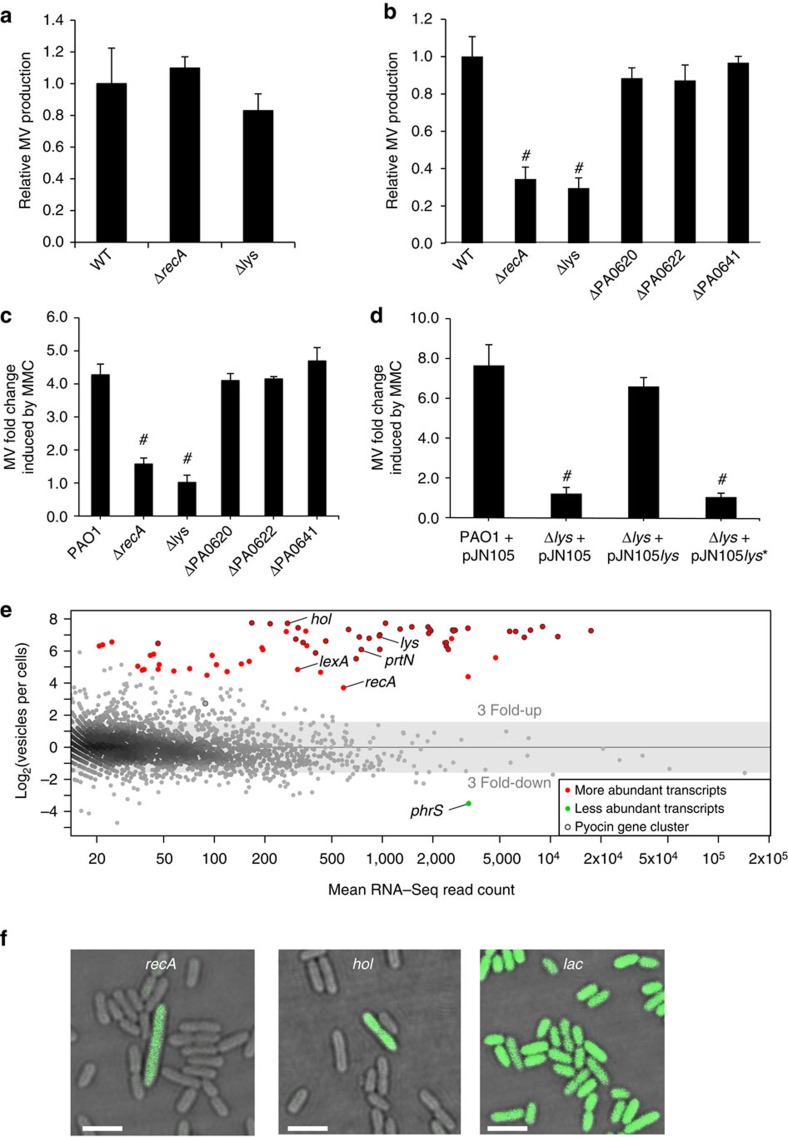
Many bacteria produce extracellular and surface-associated components such as membrane vesicles (MVs), extracellular DNA and moonlighting cytosolic proteins for which the biogenesis and export pathways are not fully understood. Here we show that the explosive cell lysis of a sub-population of cells accounts for the liberation of cytosolic content in Pseudomonas aeruginosa biofilms. Super-resolution microscopy reveals that explosive cell lysis also produces shattered membrane fragments that rapidly form MVs. A prophage endolysin encoded within the R- and F-pyocin gene cluster is essential for explosive cell lysis. Endolysin-deficient mutants are defective in MV production and biofilm development, consistent with a crucial role in the biogenesis of MVs and liberation of extracellular DNA and other biofilm matrix components. Our findings reveal that explosive cell lysis, mediated through the activity of a cryptic prophage endolysin, acts as a mechanism for the production of bacterial MVs.


Figures

Figure 1
Figure 1. Explosive cell lysis occurs in P. aeruginosa interstitial biofilms.
(a) Phase-contrast (left) and TOTO-1-stained eDNA (green, right); scale bar, 50 μm. (b) Time series of a rod-to-round cell transition (dotted white line, upper panels) and subsequent lysis releasing eDNA stained by TOTO-1 (green, lower panels). Time in seconds (top right); scale bar, 1 μm. (c) P. aeruginosa PAK-expressing cytoplasmic CFP (magenta) cultured in the presence of the eDNA stain TOTO-1 (yellow) showing that sites of eDNA release (arrow, left panel) contain extracellular CFP (arrow, right panel); scale bar, 2 μm. (d) Frequency distribution of survival times in seconds (s) of round cells from formation to explosion (n=150, bin size 60s). Another 12 round cells were observed that had either formed within a time-series or were present at the start of a time-series and which did not explode by the end of the time-series. Survival times of these cells were at least 10–45 min including one that we tracked for several hours. (e) Frequency distribution of round cell survival for those cells surviving <60 s (n=129, bin size 5s). (f) A round cell (dotted white line) cultured in the presence of FM-143FX (green), tracked over 20 min. Time in min (top right); scale bar, 1 μm. These round cells with long survival times had malleable cell walls and were able to withstand being pushed out of shape by surrounding cells and rapidly re-formed the default round shape when the neighbouring cells moved away. See Supplementary Movie 2. (g) Cell lengths of round cells that became rods (round cell rod; n=120) and neighbouring rod cells (n=750). Box is 25th–75th percentiles, line in box is median, whisker limits are minimum and maximum values; #P<0.0001, unpaired t-test with Welch's correction.
Figure 2
Figure 2. Stress induces explosive cell lysis.
(a) Frequency of explosive cell lysis events in the absence (−FL) or presence (+FL) of fluorescence imaging, mean±s.e.m., #P<0.0001, Unpaired t-test with Welch's correction. (b) Phase-contrast (top) and TOTO-1-stained eDNA (green, bottom) of P. aeruginosa PAO1 interstitial biofilms cultured in the presence of filter discs saturated in water, MMC or CPFLX; scale bar, 5 μm. (c) Phase-contrast (left) and TOTO-1-stained eDNA (green, right) of P. aeruginosa PAO1 and PAO1ΔrecA interstitial biofilms cultured in the presence of filter discs saturated in water, or MMC; scale bar, 20 μm.
Figure 3
Figure 3. Pyocin endolysin Lys is required for eDNA release in interstitial biofilms under inducing and non-inducing conditions.
(a) and (b) Phase-contrast (left) and TOTO-1-stained eDNA (green, right) of interstitial biofilms of (a) PAK and PAKΔlys and (b) PAO1 and PAO1Δlys containing either pJN105 (vector control) or pJN105lys cultured in the presence of filter discs saturated in water or MMC; scale bar, 10 μm. (c) Lys catalytic activity is required for eDNA release in P. aeruginosa PAO1 interstitial biofilms; n=30; mean±s.e.m. #P<0.0001, unpaired t-test with Welch's correction. (d) Time series of cells in an interstitial biofilm of P. aeruginosa PAO1 (phase-contrast, upper panels) containing the Phol-eGFP transcriptional fusion on plasmid pM0614-G (green, lower panels). Time in seconds; scale bar, 1 μm.
Figure 4
Figure 4. Explosive cell lysis is required for microcolony development in submerged hydrated biofilms.
(a) Time series of the initial stages of PAO1 biofilm development 1 h after inoculation showing attachment of a rod cell, its transition to round cell morphotype and subsequent explosion releasing eDNA (TOTO-1, green). Time in min (top right); scale bar, 5 μm. (b,c) Microcolonies in 8-h submerged biofilms of PAO1 (upper), PAO1Δlys (middle), and PAO1 cultured in the presence of DNaseI (lower). (b) Representative phase contrast (left) and eDNA (EthHD-2, right) images; scale bar, 10 μm. Inset shows magnified view of round cell at arrow-head (c) Microcolonies in 8-h submerged biofilms per mm2, n=30. Mean±s.e.m. *P<0.0001, unpaired t-test with Welch's correction. (d) Microcolonies per mm2 in 8-h submerged hydrated biofilms of PAO1 and PAO1Δlys carrying either pJN105 or pJN105lys, n=30. Mean±s.e.m. #P<0.0001, unpaired t-test with Welch's correction. (e) Microcolonies per mm2 in 8-h submerged hydrated biofilms of PAO1 and PAO1Δlys cultured in the absence or presence of exogenous DNA (exDNA), n=20. Mean±s.e.m. #P<0.0001, unpaired t-test with Welch's correction.
Figure 5
Figure 5. MVs are present within P. aeruginosa interstitial biofilms.
(a) f3D-SIM of PAK biofilms cultured in the presence of FM1-43FX (white), scale bar, 1 μm. (b) Frequency distribution of diameters of MVs measured in situ in live PAK biofilms (n=268, bin size=50 nm). (c) f3D-SIM of PAK biofilms cultured in the presence FM1-43FX (blue) and EthHD-2 (red); scale bar, 2 μm. (d) Quantification of MVs in random fields of view (40 μm × 40 μm) of PAO1 (n=35) and PAO1Δlys (n=22) biofilms cultured in the presence of FM1-43FX and imaged with f3D-SIM.
Figure 6
Figure 6. MVs are produced as a consequence of explosive cell lysis in P. aeruginosa biofilms.
(a,b) f3D-SIM time-series of live interstitial biofilms in the presence of FM1-43FX (white). Time in seconds, top right; scale bar, 0.5 μm. (c) f3D-SIM of P. aeruginosa PAK-expressing mChFP (red) in the presence of FM1-43FX (blue). xy (left) and corresponding yz (right) views showing a large MV containing mChFP (arrow); scale bar, 0.5 μm. (d) f3D-SIM of live PAK interstitial biofilms in the presence of FM1-43FX (blue) and EthHD-2 (red). xy (upper) and corresponding xz (lower) views showing a large MV containing eDNA (arrow); scale bar, 0.5 μm
Figure 7
Figure 7. Lys is involved in stress-induced MV formation of planktonic cells.
(a) MV production in P. aeruginosa PAO1 and isogenic mutants were analysed after 16 h of incubation under oxic planktonic growth conditions. n=3; mean±s.d. (b) MV production in P. aeruginosa PAO1 and isogenic mutants were analysed after 16 h of incubation under anoxic planktonic growth conditions. Values indicate the mean±s.d. of three replicates. n=3; mean±s.d. #P<0.001 versus wild type (WT) (Student's t-test). (c) MV production by planktonic P. aeruginosa PAO1 and isogenic mutants cultured in the presence of MMC (200ngmL−1) relative to no MMC, n=3; mean±s.d. #P<0.0005 (Student's t-test). (d) Catalytic activity of Lys is required for genotoxic stress-induced MV formation, n=3; mean±s.d. #P<0.0005 (Student's t test). (e) MA plot showing the comparison of mRNA levels associated with MVs with the transcript levels of stationary phase cells. More and less abundant transcripts in MVs are indicated by red and green dots, respectively (P value <0.02). Transcripts from the pyocin gene cluster (PA0610 to PA0648) are circled in black. (f) Promoter activities of recA, hol and lacZ (control) under non-inducing conditions were monitored by the aid of plasmids containing transcriptional fusions of the respective promoter regions to eGFP. Cells expressing GFP are green; scale bar, 2.5 μm.
Figure 8
Figure 8. PQS is not required for MV production in interstitial biofilms.
(a) f3D-SIM of PA14pqsA and PAO1pqsA biofilms cultured in the presence of FM1-43FX (white) showing MV patches; scale bar, 1 μm. (b) Quantification of MVs in random fields of view (40 μm × 40 μm) of PA14 (n=54), PA14pqsA (n=60), PAO1 (n=22) and PAO1pqsA (n=24); #P<0.0001, unpaired t-test with Welch's correction.

Comment in

References

    1. Kaparakis-Liaskos M. & Ferrero R. L. Immune modulation by bacterial outer membrane vesicles. Nat. Rev. Immunol. 15, 375–387 (2015). - PubMed
    1. Schwechheimer C. & Kuehn M. J. Outer-membrane vesicles from Gram-negative bacteria: biogenesis and functions. Nat. Rev. 13, 605–619 (2015). - PMC - PubMed
    1. Schooling S. R., Hubley A. & Beveridge T. J. Interactions of DNA with biofilm-derived membrane vesicles. J. Bacteriol. 191, 4097–4102 (2009). - PMC - PubMed
    1. Toyofuku M., Roschitzki B., Riedel K. & Eberl L. Identification of proteins associated with the Pseudomonas aeruginosa biofilm extracellular matrix. J. Proteome Res. 11, 4906–4915 (2012). - PubMed
    1. Drescher K. et al. Solutions to the public goods dilemma in bacterial biofilms. Curr. Biol. 24, 50–55 (2014). - PMC - PubMed

Publication types

MeSH terms