. 2016 Apr 14:6:24430.
doi: 10.1038/srep24430.

Hepatitis B virus X protein (HBx)-induced abnormalities of nucleic acid metabolism revealed by (1)H-NMR-based metabonomics

Affiliations

Hepatitis B virus X protein (HBx)-induced abnormalities of nucleic acid metabolism revealed by (1)H-NMR-based metabonomics

Dan Yue et al. Sci Rep. .

Abstract

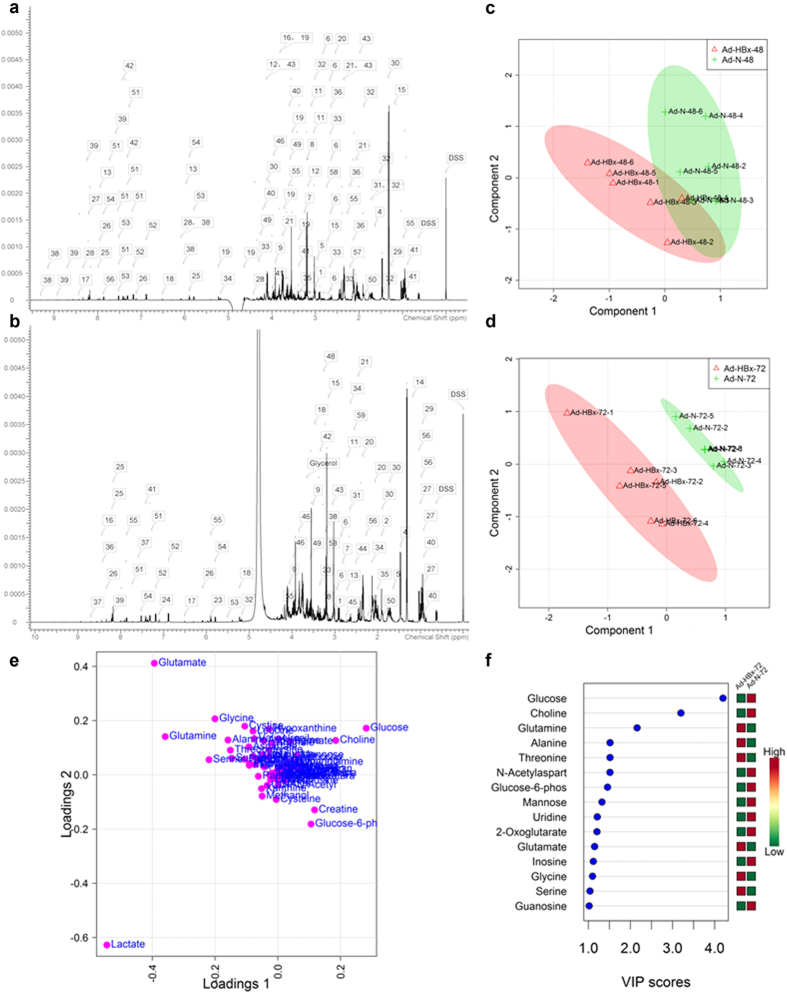
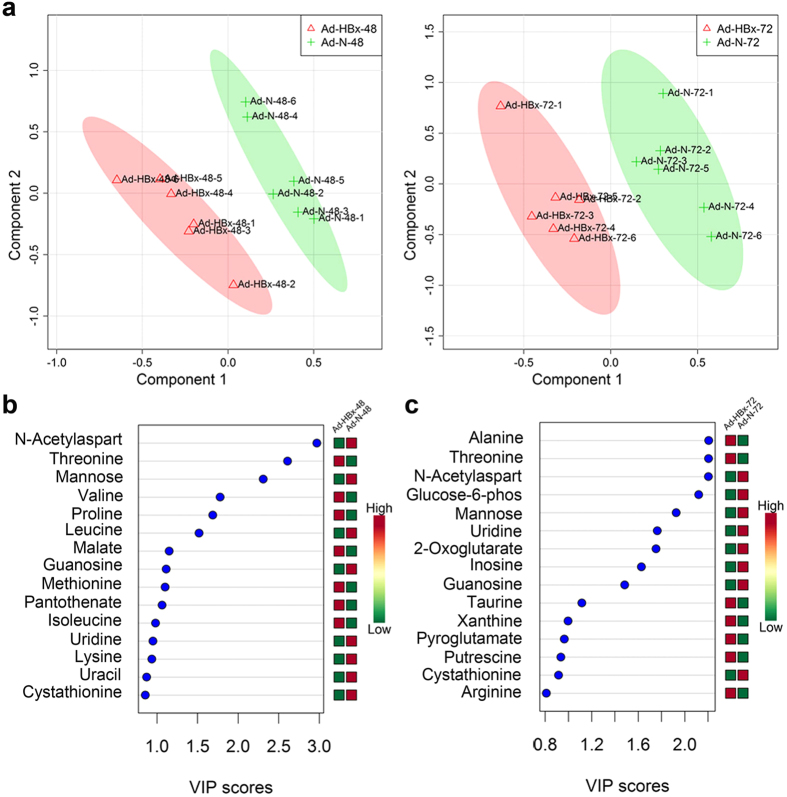
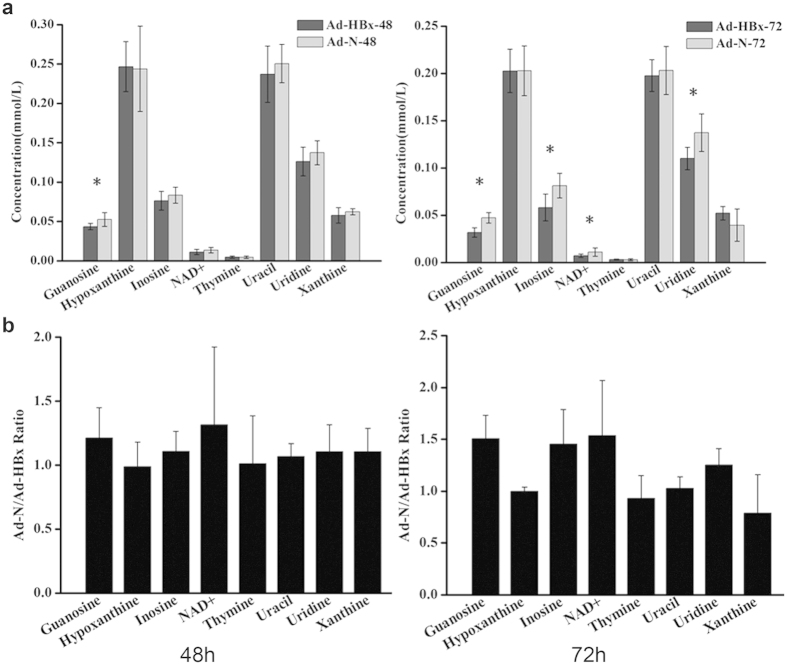
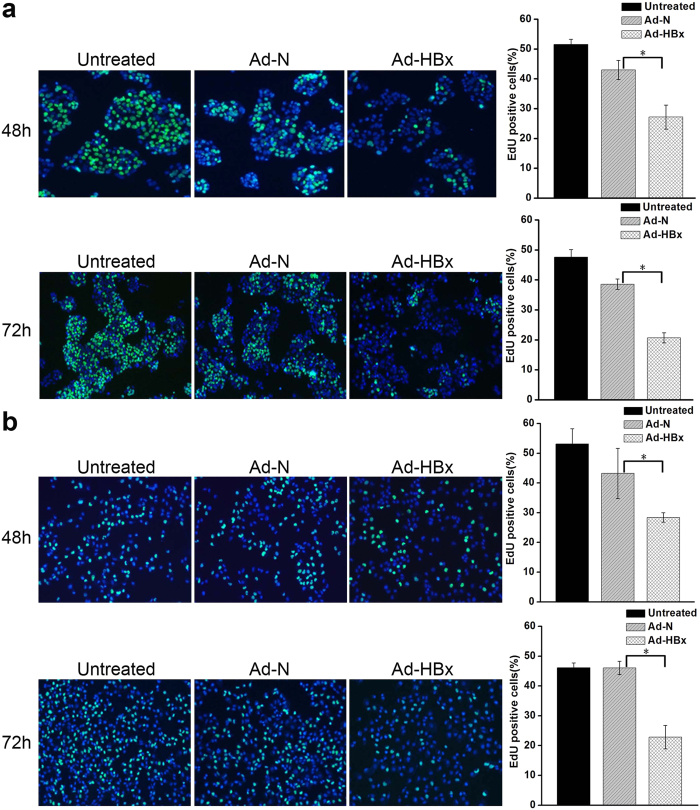
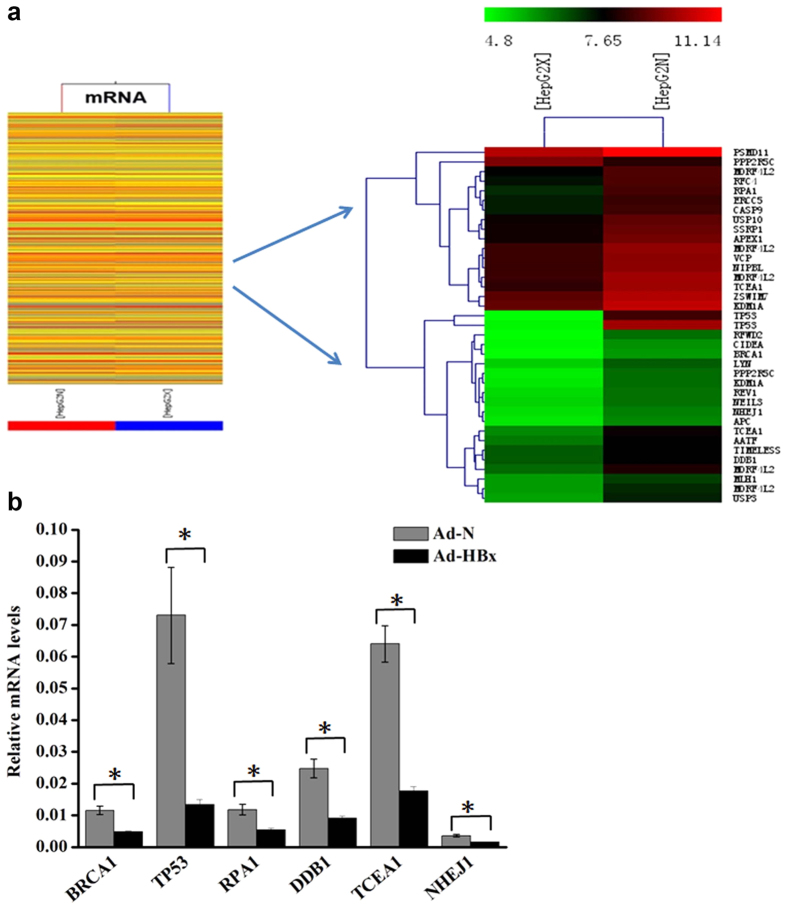
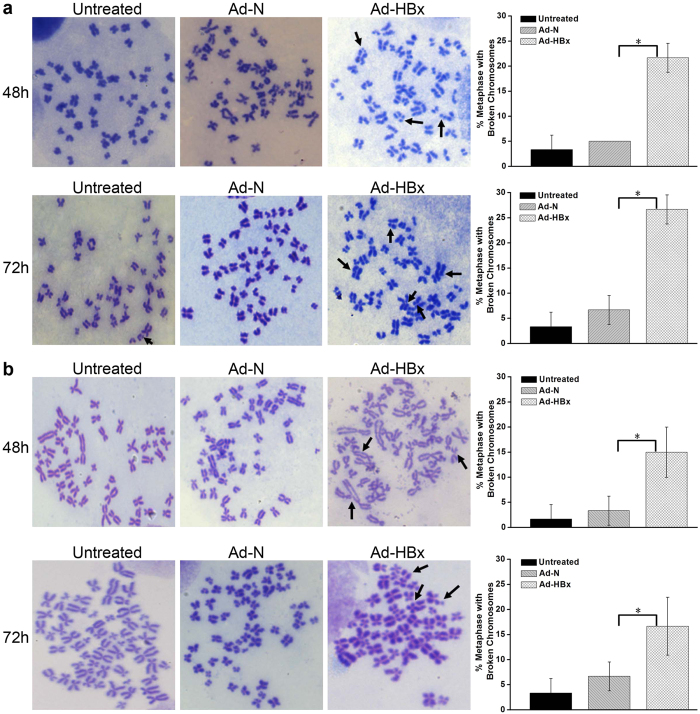
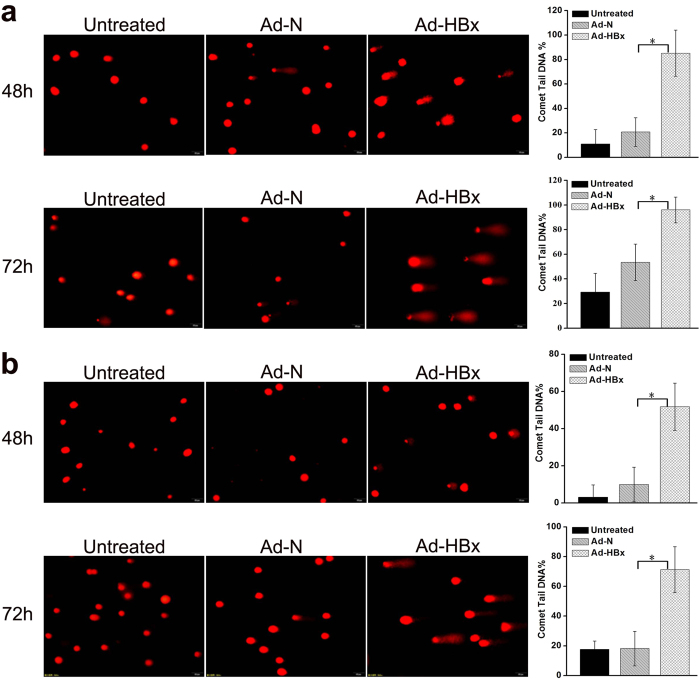
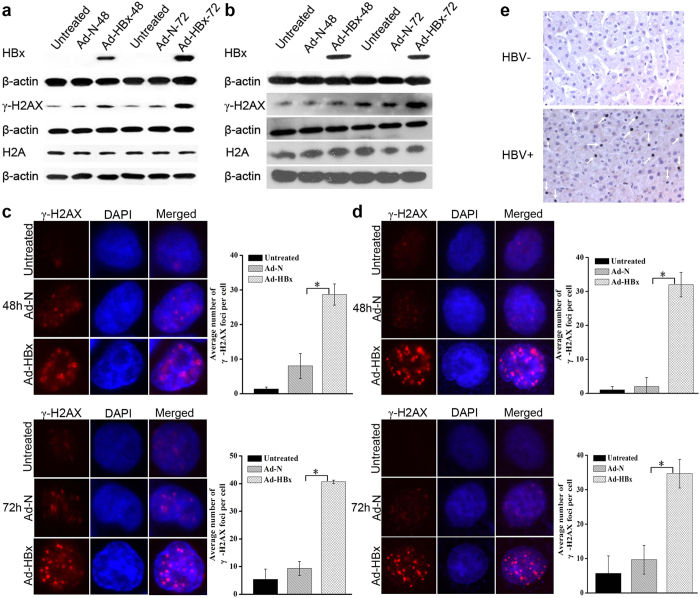
Hepatitis B virus X protein (HBx) plays an important role in HBV-related hepatocarcinogenesis; however, mechanisms underlying HBx-mediated carcinogenesis remain unclear. In this study, an NMR-based metabolomics approach was applied to systematically investigate the effects of HBx on cell metabolism. EdU incorporation assay was conducted to examine the effects of HBx on DNA synthesis, an important feature of nucleic acid metabolism. The results revealed that HBx disrupted metabolism of glucose, lipids, and amino acids, especially nucleic acids. To understand the potential mechanism of HBx-induced abnormalities of nucleic acid metabolism, gene expression profiles of HepG2 cells expressing HBx were investigated. The results showed that 29 genes involved in DNA damage and DNA repair were differentially expressed in HBx-expressing HepG2 cells. HBx-induced DNA damage was further demonstrated by karyotyping, comet assay, Western blotting, immunofluorescence and immunohistochemistry analyses. Many studies have previously reported that DNA damage can induce abnormalities of nucleic acid metabolism. Thus, our results implied that HBx initially induces DNA damage, and then disrupts nucleic acid metabolism, which in turn blocks DNA repair and induces the occurrence of hepatocellular carcinoma (HCC). These findings further contribute to our understanding of the occurrence of HCC.


Figures

Figure 1
Figure 1. Representative 600-MHz 1H-NMR spectra and PLS-DA analysis of 1H-NMR spectral data.
(a,b) Respectively show the spectra (0–10 ppm) of HepG2 cells infected by Ad-N and Ad-HBx, which included all metabolites identified. (c,d) Show the PLS-DA scores plots. (c) Ad-HBx-48 (red triangles) versus Ad-N-48 (green crosses) (R2 = 0.994 and Q2 = 0.447); (d) Ad-HBx-72 (red triangles) versus Ad-N-72 (green crosses) (R2 = 0.997 and Q2 = 0.743). The values of R2 and Q2 represent the goodness of fit and predictability of the models, respectively. (e) Loadings plot of 72 h post-infection from the PLS-DA analysis. (f) VIP scores of important metabolites. Red or green on the right indicates the low or high concentration of metabolites by comparing the concentration of each metabolite in Ad-HBx-72 and Ad-N-72.
Figure 2
Figure 2. HBx-induced abnormalities of nucleic acids.
(a) Scores plots of Ad-HBx-48 (red triangles) and Ad-N-48 (green crosses), and Ad-HBx-72 (red triangles) and Ad-N-72 (green crosses). (b) VIP scores of Ad-HBx-48 and Ad-N-48. (c) VIP scores of Ad-HBx-72 and Ad-N-72. Red or green on the right of (b) and (c) indicates the low or high concentration of metabolites by comparing the concentration of each metabolite in Ad-HBx-48 and Ad-N-48 or Ad-HBx-72 and Ad-N-72, respectively.
Figure 3
Figure 3. Quantification of nucleic acid components in HepG2 cells infected by Ad-HBx or Ad-N.
(a) Comparison of nucleic acid components between Ad-HBx-48 and Ad-N-48 or Ad-HBx-72 and Ad-N-72 by Student’s t test. *indicates p < 0.05. (b) Ad-N to Ad-HBx ratio for each nucleic acid component identified at 48 h and 72 h after infection.
Figure 4
Figure 4. The effects of HBx on EdU incorporation into HepG2 and SK-HEP-1 cells.
(a,b) Representative micrographs (left) and quantification analysis (right) of EdU-labeled cells of HepG2 and SK-HEP-1 at 48 h and 72 h post-infection. EdU-labeled cell (green) numbers of Ad-HBx-48 and Ad-HBx-72 were compared with those of Ad-N-48 and Ad-N-72, respectively. Results are representative of three independent experiments. Values represent mean ± SD. *indicates a significant difference between Ad-HBx-48 and Ad-N-48 or Ad-HBx-72 and Ad-N-72 by Student’s t test (p < 0.05).
Figure 5
Figure 5. HBx affected gene expression profiles of cells.
(a) Shows the expression profiles of mRNA (left) and DNA damage-related genes (right). Green or red on the heat map indicated a decrease or an increase in the mRNA level and color intensities correspond to relative signal levels on a logarithmic scale. (b) qRT-PCR validation of representative mRNA. Data were normalized to GAPDH and represent the mean of three experimental replicates. *indicates a significant difference between cells infected Ad-N and Ad-HBx by Student’s t test (p < 0.05).
Figure 6
Figure 6. HBx induced genomic instability.
(a,b) Chromosome breaks in HepG2 and SK-HEP-1 cells infected with Ad-HBx and Ad-N, or untreated were detected. Left panel: representative images of metaphase chromosomes. Arrows indicate the broken chromosomes. Right panel: quantification of metaphase spreads with broken chromosomes. Values are means ± SD from 3 independent experiments. *indicates a significant difference between Ad-HBx-48 and Ad-N-48 or Ad-HBx-72 and Ad-N-72 by Student’s t test (p < 0.05).
Figure 7
Figure 7. HBx-induced DNA damage was detected by comet assays.
(a,b) DNA damage in HepG2 and SK-HEP-1 cells infected with Ad-HBx and Ad-N, or untreated was detected by comet assays, respectively. Left panel: representative images of comet assay (Scale bar, 50 μ m). Right panel: quantification of comet tail DNA%. Values are means ± SD from 3 independent experiments. *indicates a significant difference between Ad-HBx-48 and Ad-N-48 or Ad-HBx-72 and Ad-N-72 by Student’s t test (p < 0.05).
Figure 8
Figure 8. HBx-induced DNA damage was detected by Western blotting, immunofluorescence and immunohistochemistry.
(a,b) Representative Western blotting of HBx, H2AX and γ-H2AX protein expression in HepG2 and SK-HEP-1 cells infected with Ad-HBx and Ad-N, or untreated. (c,d) Representative immunostaining (left) and quantification (right) of γ-H2AX in HepG2 and SK-HEP-1 cells infected by Ad-HBx or Ad-N, or untreated cells. Results are representative of three independent experiments. *p < 0.05 for comparison between Ad-HBx-48 and Ad-N-48 or Ad-HBx-72 and Ad-N-72 by Student’s t test. (e) Representative images of γ-H2AX expression in liver tissues of individuals infected with HBV by immunohistochemistry. DNA damage hepatocytes are marked with arrows.

Similar articles

Cited by

References

    1. Kimhofer T., Fye H., Taylor-Robinson S., Thursz M. & Holmes E. Proteomic and metabonomic biomarkers for hepatocellular carcinoma: a comprehensive review. Br J Cancer 112, 1141–1156, doi: 10.1038/bjc.2015.38 (2015). - DOI - PMC - PubMed
    1. Mahboobi N. et al.. Hepatitis B virus infection in dentistry: a forgotten topic. J Viral Hepat 17, 307–316, doi: 10.1111/j.1365-2893.2010.01284.x (2010). - DOI - PubMed
    1. Yang F. et al.. Long noncoding RNA high expression in hepatocellular carcinoma facilitates tumor growth through enhancer of zeste homolog 2 in humans. Hepatology 54, 1679–1689, doi: 10.1002/hep.24563 (2011). - DOI - PubMed
    1. Shi Y., Song Q., Hu D., Zhuang X. & Yu S. Tumor-infiltrating lymphocyte activity is enhanced in tumors with low IL-10 production in HBV-induced hepatocellular carcinoma. Biochem Biophys Res Commun 461, 109–114, doi: 10.1016/j.bbrc.2015.03.177 (2015). - DOI - PubMed
    1. Yang Y. X. et al.. Metabonomic studies of human hepatocellular carcinoma using high-resolution magic-angle spinning H-1 NMR spectroscopy in conjunction with multivariate data analysis. Journal of Proteome Research 6, 2605–2614, doi: 10.1021/pr070063h (2007). - DOI - PubMed

Publication types

Substances

LinkOut - more resources