. 2016 Apr 14:6:24526.
doi: 10.1038/srep24526.

Structural and functional properties of prefibrillar α-synuclein oligomers

Affiliations

Structural and functional properties of prefibrillar α-synuclein oligomers

Laura Pieri et al. Sci Rep. .

Abstract

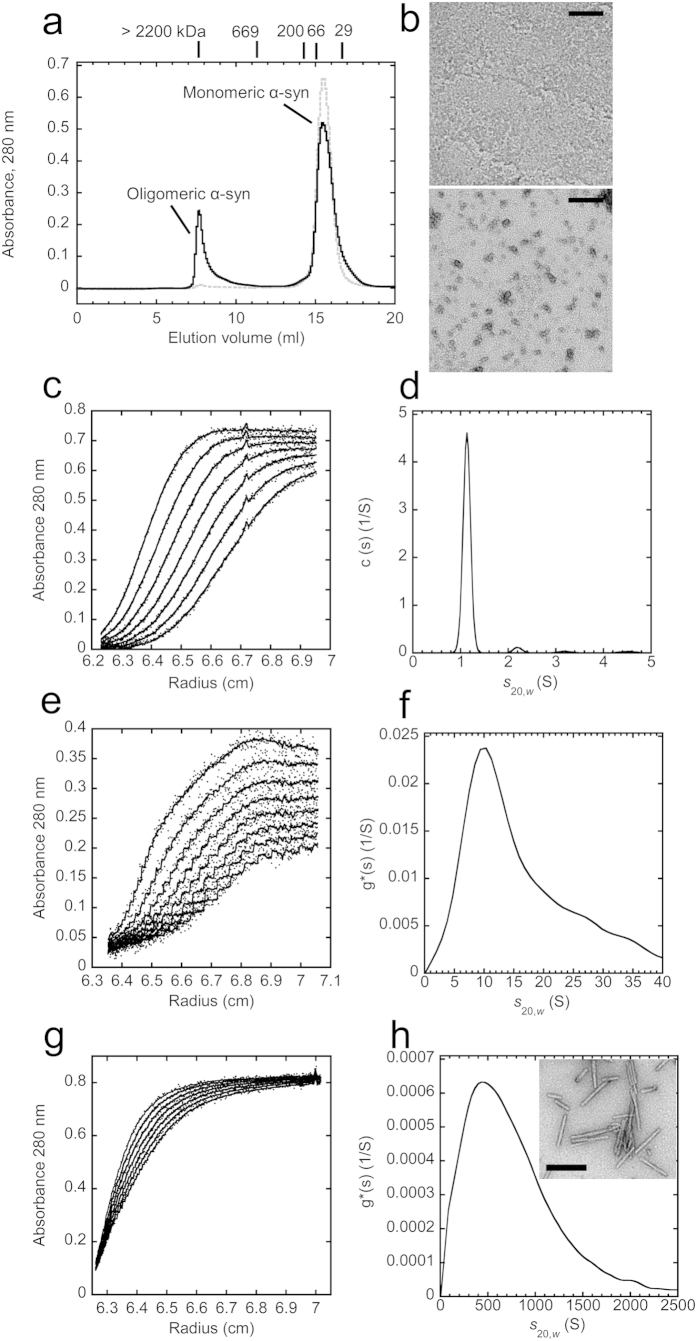
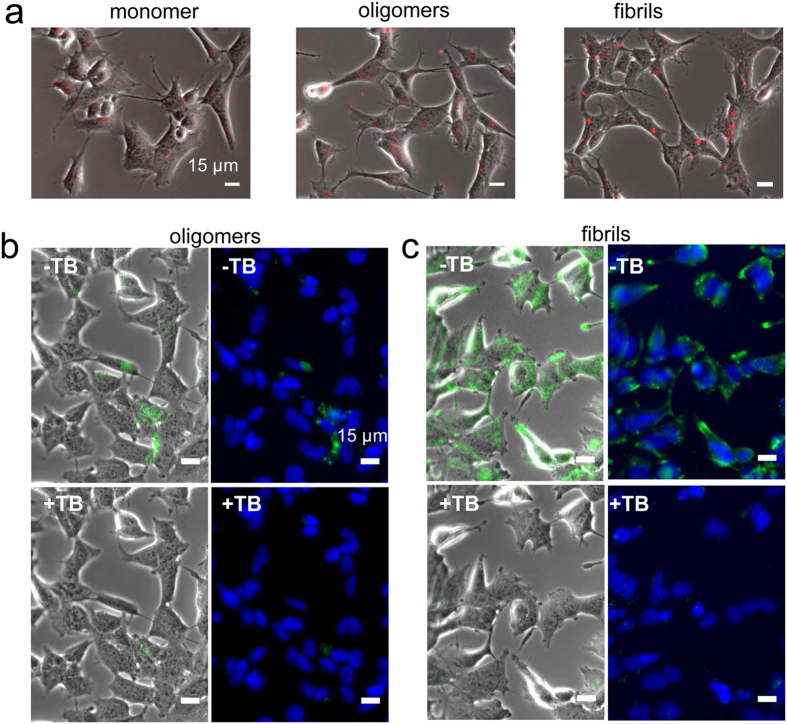
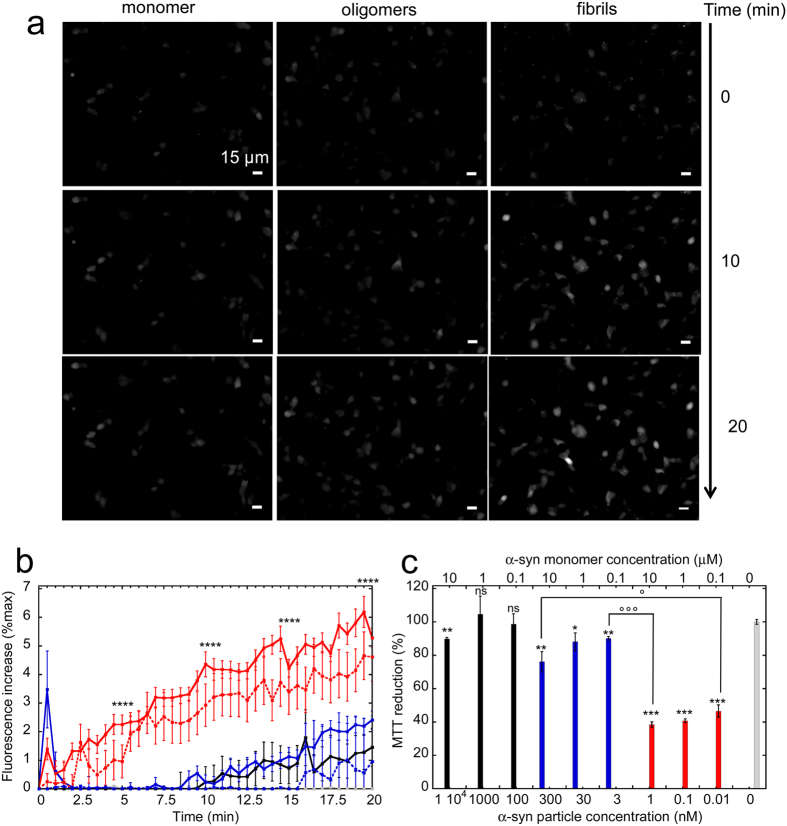
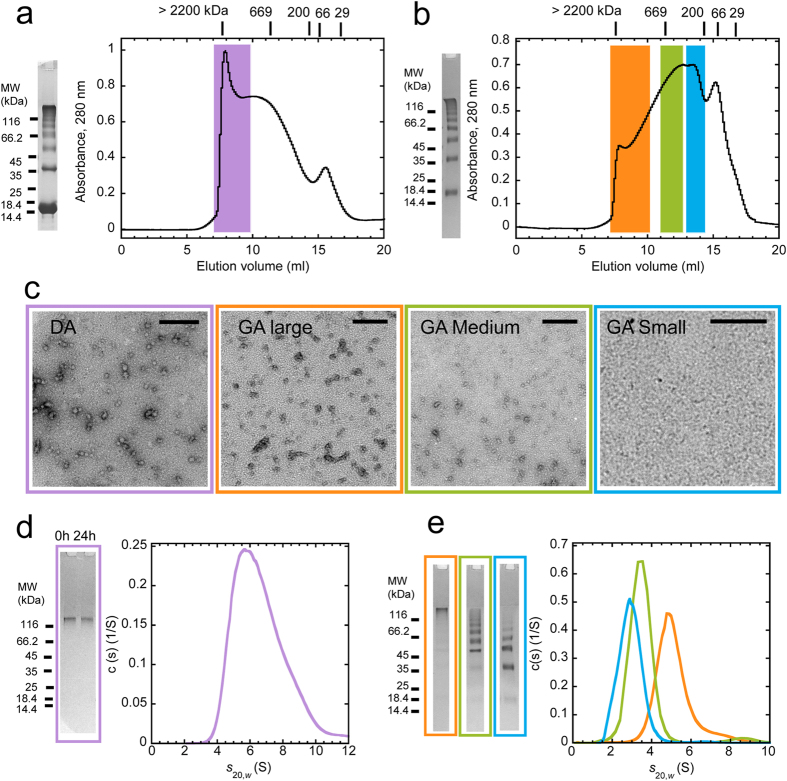
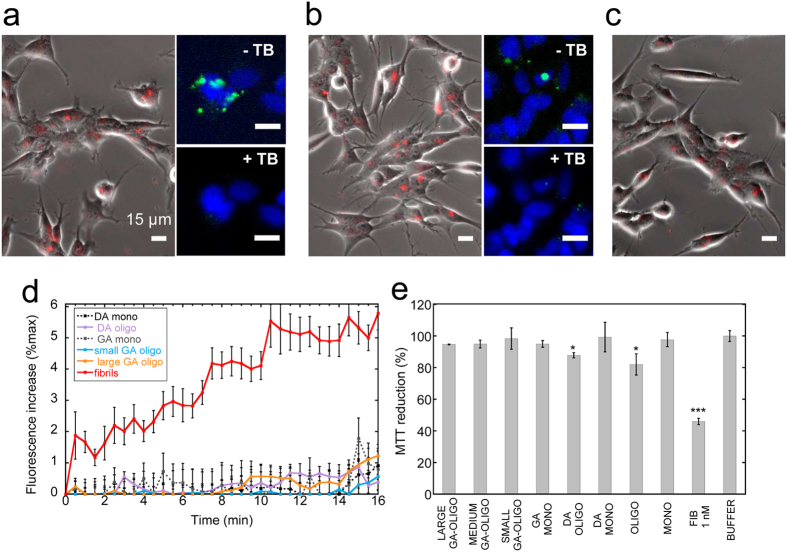
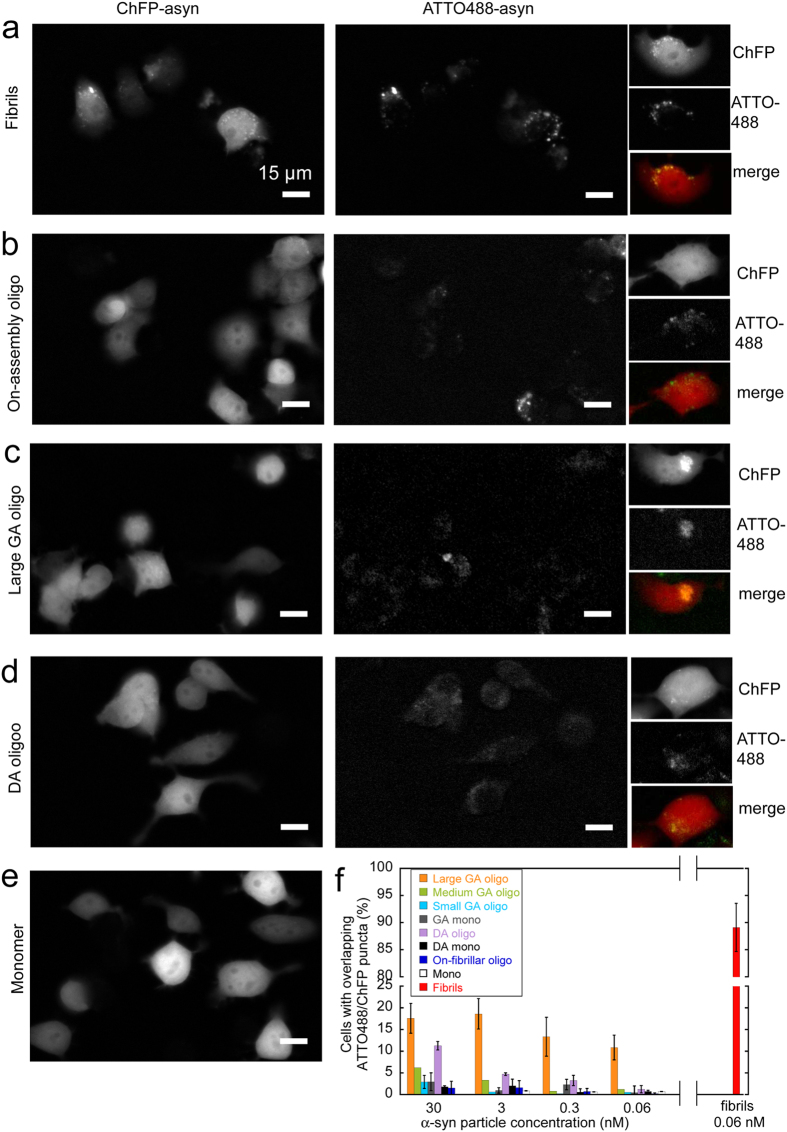
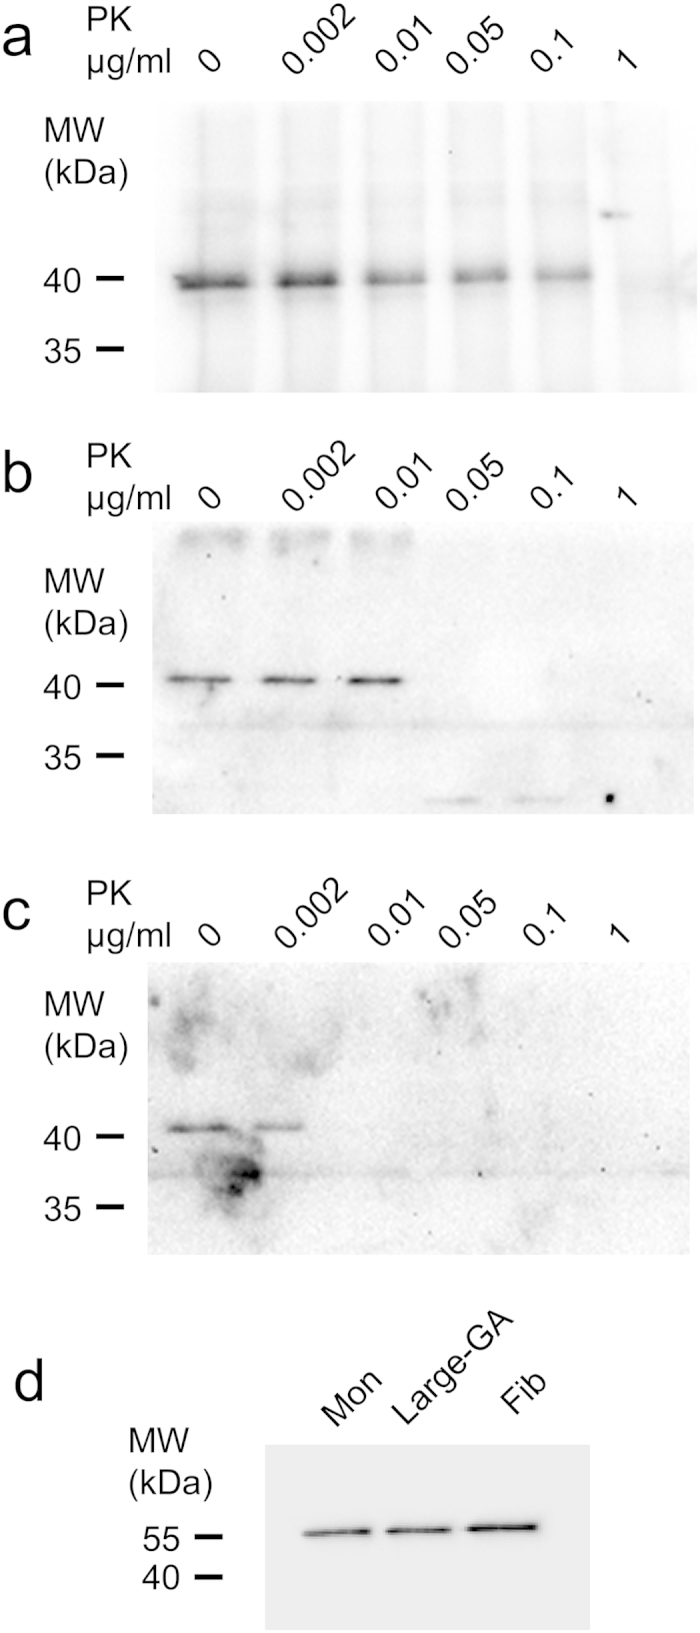
The deposition of fibrillar alpha-synuclein (α-syn) within inclusions (Lewy bodies and Lewy neurites) in neurons and glial cells is a hallmark of synucleinopathies. α-syn populates a variety of assemblies ranging from prefibrillar oligomeric species to fibrils whose specific contribution to neurodegeneration is still unclear. Here, we compare the specific structural and biological properties of distinct soluble prefibrillar α-syn oligomers formed either spontaneously or in the presence of dopamine and glutaraldehyde. We show that both on-fibrillar assembly pathway and distinct dopamine-mediated and glutaraldehyde-cross-linked α-syn oligomers are only slightly effective in perturbing cell membrane integrity and inducing cytotoxicity, while mature fibrils exhibit the highest toxicity. In contrast to low-molecular weight and unstable oligomers, large stable α-syn oligomers seed the aggregation of soluble α-syn within reporter cells although to a lesser extent than mature α-syn fibrils. These oligomers appear elongated in shape. Our findings suggest that α-syn oligomers represent a continuum of species ranging from unstable low molecular weight particles to mature fibrils via stable elongated oligomers composed of more than 15 α-syn monomers that possess seeding capacity.


Figures

Figure 1
Figure 1. Production and characterization of on-fibrillar assembly pathway α-syn assemblies.
(a) Isolation of on-fibrillar assembly pathway oligomeric α-syn by SEC. 500 μl of α-syn (800 μM monomer concentration) were loaded onto a Superose 6 (10/300) column and eluted at a flow rate of 0.5 ml/min in PBS diluted 10-fold. Elution was monitored by measuring absorbance at 280 nm. Grey dashed line, freshly thawed α-syn; Black solid line, α-syn incubated in assembly buffer for 7 days at 4 °C without shaking. The elution volumes of the standards Dextran blue (>2200 kDa); thyroglobulin (670 kDa); β-amylase (200 kDa); BSA (66 kDa); and carbonic anhydrase (29 kDa) are shown. Oligomeric α-syn eluted with an apparent molecular mass >2200 kDa. Monomeric α-syn eluted at ~54 kDa. (b) Negatively stained TEM images of purified monomeric (top panel) or oligomeric α-syn (bottom panel). Scale bars, 200 nm. (c) Sedimentation velocity data for monomeric α-syn (120 μM) at 50000 rpm and 15 °C in PBS diluted 10-fold. Shown are sedimentation boundaries obtained at intervals of 15 min. (d) Sedimentation coefficient continuous c(s) distribution of monomeric α-syn calculated from the sedimentation velocity data of panel (c) and corrected to s20,w. (e) Sedimentation velocity data for oligomeric α-syn (70 μM monomer concentration) at 25000 rpm and 15 °C in PBS diluted 10-fold. Shown are sedimentation boundaries obtained at intervals of 10 min. (f) Sedimentation coefficient g*(s) distribution of oligomeric α-syn calculated from the sedimentation velocity data of panel (e) and corrected to s20,w. (g) Sedimentation velocity data for fibrillar α-syn (20 μM monomer concentration) at 2000 rpm and 20 °C in assembly buffer. Shown are sedimentation boundaries obtained at intervals of 10 min. (h) Sedimentation coefficient g*(s) distribution of fibrillar α-syn calculated from the sedimentation velocity data of panel (g) and corrected to s20,w. Inset, negatively stained transmission electron micrograph of fibrillar α-syn. Scale bar, 200 nm.
Figure 2
Figure 2. Interaction of α-syn assemblies with cell membranes.
(a) Binding of ATTO550-labeled α-syn assemblies (red) to SH-SY5Y cells, imaged by epifluorescence and phase contrast microscopy. Left panel, monomeric α-syn (1 μM); Middle panel, oligomeric α-syn (30 nM, i.e. 1 μM monomeric α-syn); Right panel, fibrillar α-syn (0.1 nM, i.e. 1 μM monomeric α-syn). Scale bars, 15 μm. (b,c) Localization of ATTO488-labeled α-syn assemblies (green) on the plasma membranes of SH-SY5Y cells. Cells were exposed 15 min to 30 nM oligomeric (b) or 0.1 nM fibrillar α-syn (c) and imaged before (b,c, top panels, -TB) and after addition of the fluorescence quencher Trypan blue (b,c, bottom panels, +TB). Phase contrast imaging (b,c, left panels) and cell nuclei counterstaining (blue) with Hoescht 33258 (Invitrogen) (b,c, right panels) are also shown. Scale bars, 15 μm.
Figure 3
Figure 3. Intracellular free Ca2+ variation induced by α-syn assemblies and cellular toxicity.
(a) Epifluorescence microscopy imaging of intracellular Ca2+ variation observed at 3 different incubation stages of Fluo-4-AM-loaded SH-SY5Y cells exposed to α-syn assemblies. Cells were imaged every 30 s for 20 min. Left panels, control cells exposed to monomeric α-syn (10 μM). Middle panels, oligomeric α-syn (300 nM, i.e. 10 μM monomeric α-syn); Right panels, fibrillar α-syn (1 nM, i.e. 10 μM monomeric α-syn). Scale bars, 15 μm. (b) Kinetics of intracellular Ca2+ variation induced by α-syn assemblies. Black curve, 10 μM monomeric α-syn. Blue curves, 300 nM (solid line) or 1 nM (dashed line) oligomeric α-syn; red curves, 1 nM (solid line) or 0.2 nM (dashed line) fibrillar α-syn. Grey curve, control cells treated with PBS. The fluorescence increase at each time point is expressed as a fraction of the maximum fluorescence measured upon addition of 10 μM ionomycin to the cells at the end of each experiment. Data are mean ± SE of the fluorescence increase measured in at least 100 different cells from 3 independent experiments. Fibrils 1 nM vs oligomers 300 nM, ****P < 0.0001 (two-sample, two-tailed independent Student’s t-test). (c) Viability of SH-SY5Y cells exposed 24 h to different particle concentrations of α-syn assemblies, measured by MTT assay. The initial monomeric protein concentration values corresponding to each particle concentration are indicated on the top x-axis. Black bars, monomeric α-syn; blue bars, oligomeric α-syn; red bars, fibrillar α-syn. Grey bar, PBS. MTT reduction is expressed as percentage relative to control cells treated with identical volumes of PBS. Data are mean ± SE (n = 6). Versus control cells, *P < 0.05; **P < 0.01; ***P < 0.001 (two-sample, two-tailed independent Student’s t-test). Oligomers vs fibrils, °P < 0.05; °°°P < 0.001 (two-sample, two-tailed independent Student’s t-test).
Figure 4
Figure 4. Production and characterization of SDS-stable DA-mediated or GA-cross-linked α-syn oligomers.
(a,b) Isolation of DA-mediated (a) or GA-cross-linked (b) α-syn oligomeric species by SEC. Coomassie blue-stained 10% Tris-Tricine-SDS-PAGE of SDS-resistant oligomeric populations obtained in the presence of DA (a) or GA (b) are also shown. α-syn (500 μl, 600 μM) incubated in the presence of DA or GA (see Methods for details) was loaded onto a Superose 6 (10/300) column and eluted at a flow rate of 0.5 ml/min in PBS diluted 10-fold. Elution was monitored by measuring absorbance at 280 nm. The elution positions of the standards Dextran blue (>2200 kDa); thyroglobulin (670 kDa); β-amylase (200 kDa); BSA (66 kDa); and carbonic anhydrase (29 kDa) are indicated. Colored areas in panels (a,b) indicate the four different populations of DA-mediated and GA-cross-linked α-syn oligomers we isolated and characterized. Purple area, large DA-mediated oligomers. Orange area, large; green area, medium; cyan area, small GA-cross-linked α-syn oligomers (also see Supplementary Fig. S2). (c) Negatively stained TEM images of purified DA-mediated (purple frame); large (orange frame), medium (green frame), and small (cyan frame) GA-cross-linked α-syn oligomers. Scale bars, 200 nm. (d) Sedimentation coefficient continuous c(s) distributions of isolated DA-induced α-syn oligomers, obtained by sedimentation velocity measurements performed at 25000 rpm and 15 °C, and corrected to s20,w. Coomassie blue-stained 10% Tris-Tricine-SDS-PAGE profiles of isolated DA-mediated α-syn oligomers before and after 24 h incubation in serum free Dulbecco’s modified Eagle’s Medium/Ham’s nutrient mixture F-12 (DMEM/F12) cell culture medium are also shown. (e) Sedimentation coefficient continuous c(s) distributions of purified large (orange curve), medium (green curve) and small GA-cross-linked α-syn oligomers (cyan curve), obtained by sedimentation velocity measurements performed at 25000 rpm and 15 °C, and corrected to s20,w. Coomassie blue-stained 10% Tris-Tricine-SDS-PAGE of purified large (orange frame), medium (green frame) and small GA-cross-linked α-syn oligomers (cyan frame) are also shown.
Figure 5
Figure 5. Interaction of DA-mediated or GA-cross-linked α-syn oligomers with cell membranes, intracellular free Ca2+ and toxicity measurements.
(ac) binding of ATTO550-labeled DA-mediated or GA-cross-linked α-syn oligomers (red) to the surfaces of human neuroblastoma SH-SY5Y cells, imaged by epifluorescence and phase contrast microscopy. (a) DA-mediated α-syn oligomers (50 nM, equivalent to 1 μM monomeric α-syn); (b) large GA-cross-linked α-syn oligomers (62.5 nM, equivalent to 1 μM monomeric α-syn); (c) small GA-cross-linked α-syn oligomers (250 nM, equivalent to 1 μM monomeric α-syn). Small panels on the right in (a,b) show ATTO488-labeled DA-mediated α-syn oligomers (a) and large GA-cross-linked α-syn oligomers (b) (green) imaged before (top, -TB) and after (bottom, +TB) the addition of Trypan blue to quench the fluorescence of plasma membrane-bound oligomeric species. Cell nuclei were counterstained with Hoescht 33258 (blue). Scale bars, 15 μm. (d) kinetics of intracellular free Ca2+ variation monitored by epifluorescence microscopy imaging of SH-SY5Y cells loaded with Fluo-4-AM and exposed to DA-mediated or GA-cross-linked α-syn oligomers. Cells were imaged every 30 s for 20 min. Black dotted curve, 10 μM monomeric α-syn coming from the SEC separation of α-syn incubated in the presence of DA (see Fig. 4a); purple curve, 500 nM DA-mediated α-syn oligomers; grey dotted curve, 10 μM monomeric α-syn coming from the SEC separation of α-syn incubated in the presence of GA (see Fig. 4b); orange curve, 625 nM large GA-cross-linked α-syn oligomers; cyan curve, 2.5 μM small GA-cross-linked α-syn oligomers; red curve, 1 nM fibrillar α-syn. The fluorescence increase at each time point is expressed as a fraction of the maximum fluorescence measured upon addition of 10 μM ionomycin to the cells at the end of each experiment. Data are mean ± SE of the fluorescence increase measured in at least 100 different cells from 3 independent experiments. (e) Viability of SH-SY5Y cells exposed for 24 h to monomeric and oligomeric DA-mediated or GA-cross-linked α-syn (300 nM) or to fibrillar α-syn (1 nM), measured by MTT assay. MTT reduction is expressed as percentage relative to control cells treated with identical volumes of PBS. Data are mean ± SE (n = 6). Versus control cells, *P < 0.05; ***P < 0.001 (two-sample, two-tailed independent Student’s t-test).
Figure 6
Figure 6. Seeding propensity of α-syn oligomers assessed by epifluorescence microscopy imaging.
(ae) Epifluorescence microscopy imaging of Neuro2A cells stably expressing ChFP-α-syn exposed 24 h to 1 nM α-syn fibrils (a); 30 nM on-fibrillar assembly pathway α-syn oligomers (b); 30 nM large GA-cross-linked α-syn oligomers (c); 30 nM DA-mediated α-syn oligomers (d); or 0.5 μM monomeric α-syn (e). α-syn assemblies were labeled with ATTO488. Left panels, ChFP-α-syn red fluorescence; middle panels, ATTO488-α-syn green fluorescence; Right panels show ChFP and ATTO488 fluorescence as well as merged images for representative individual cells. Scale bars, 15 μm. (f) Proportion of cells with exogenous ATTO-488-labeled α-syn assemblies overlapping with endogenous cytoplasmic ChFP-α-syn puncta after 24 h exposure to different concentrations of ATTO-488-labeled α-syn assemblies. Values are mean ± SE, obtained by randomly counting at least 500 cells in 7–10 fields from 3 independent experiments.
Figure 7
Figure 7. Seeded aggregation of reporter ChFP-α-syn by exogenous α-syn assemblies assessed by increased resistance to proteolysis.
Western blot analysis of the ChFP-α-syn resistance to proteinase K in lysates from Neuro2A cells exposed for 24 h to 0.3 nM α-syn fibrils, equivalent to 2.5 μM monomeric α-syn (a), 300 nM large GA-cross-linked α-syn oligomers, equivalent to 5 μM monomeric α-syn (b), or 5 μM monomeric α-syn (c). The lysates (40 μl corresponding to ~80000 cells), were incubated in the presence of the indicated concentrations of proteinase K for 20 min at 37 °C. The proteolytic reactions were stopped by addition of 1 mM PMSF and immediate denaturation in Laemmli buffer for 5 min at 95 °C. The samples were analyzed on 12% Tris-Glycine SDS-PAGE. ChFP–α-syn (ac) was probed with mouse monoclonal anti-α-syn antibody (BD Biosciences Cat #610787). The immunoreactivity of α-tubulin (mouse monoclonal antibody DM1A, Abcam Cat #ab7291) in the initial lysate was used as a loading control (d). ChFP-α-syn assemblies seeded by α-syn fibrils resisted 0.1 μg/ml proteinase K (a). ChFP-α-syn from cells exposed to monomeric α-syn was fully degraded by 0.01 μg/ml proteinase K (c). ChFP-α-syn originating from cells exposed to large GA-cross-linked oligomers resisted 0.01 μg/ml and was fully degraded by 0.05 μg/ml proteinase K (b).

Similar articles

Cited by

References

    1. McCann H., Stevens C. H., Cartwright H. & Halliday G. M. α-Synucleinopathy phenotypes. Parkinsonism Relat. Disord. 20, S62–67 (2014). - PubMed
    1. Spillantini M. G. et al.. Filamentous alpha-synuclein inclusions link multiple system atrophy with Parkinson’s disease and dementia with Lewy bodies. Neurosci. Lett. 251, 205–208 (1998). - PubMed
    1. Lashuel H. A., Overk C. R., Oueslati A. & Masliah E. The many faces of α-synuclein: from structure and toxicity to therapeutic target. Nat. Rev. Neurosci. 14, 38–48 (2013). - PMC - PubMed
    1. Crowther R. A., Jakes R., Spillantini M. G. & Goedert M. Synthetic filaments assembled from C-terminally truncated alpha-synuclein. FEBS Lett. 436, 309–312 (1998). - PubMed
    1. Lashuel H. A. et al.. Alpha-synuclein, especially the Parkinson’s disease-associated mutants, forms pore-like annular and tubular protofibrils. J. Mol. Biol. 322, 1089–1102 (2002). - PubMed

Publication types