

Combined Therapy With Adipose-Derived Mesenchymal Stem Cells and Ciprofloxacin Against Acute Urogenital Organ Damage in Rat Sepsis Syndrome Induced by Intrapelvic Injection of Cecal Bacteria
- PMID: 27075767
- PMCID: PMC4878325
- DOI: 10.5966/sctm.2015-0116
Combined Therapy With Adipose-Derived Mesenchymal Stem Cells and Ciprofloxacin Against Acute Urogenital Organ Damage in Rat Sepsis Syndrome Induced by Intrapelvic Injection of Cecal Bacteria
Abstract
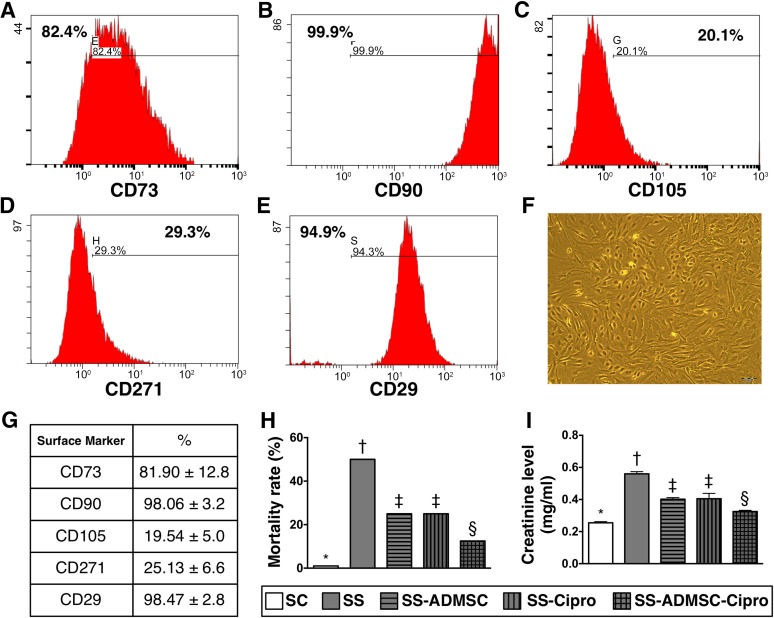
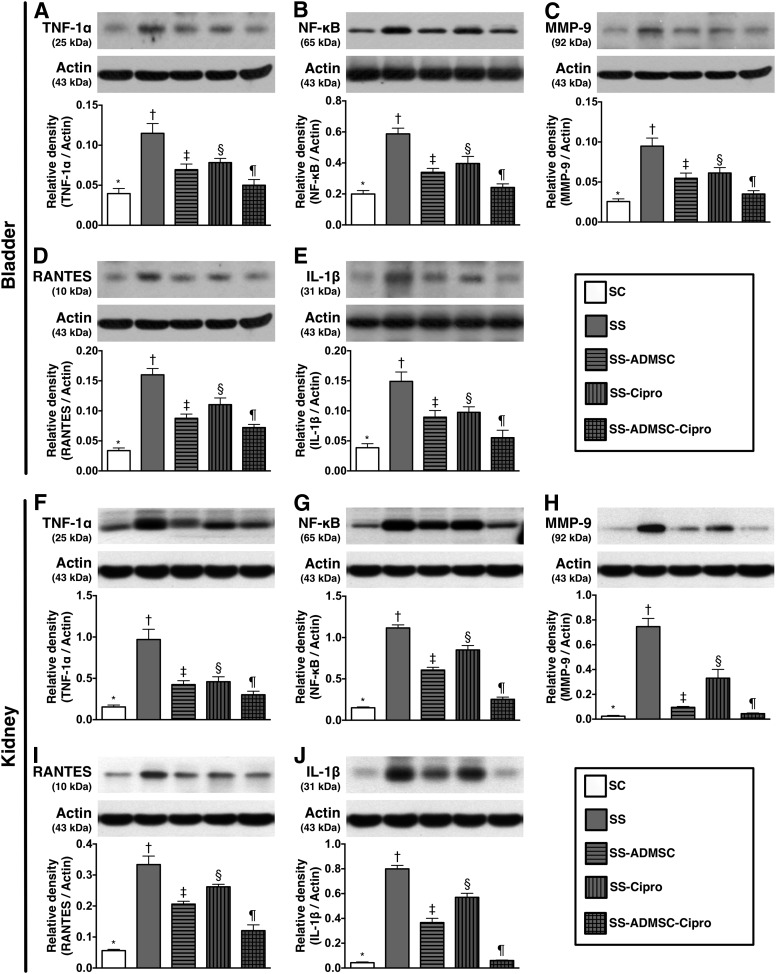
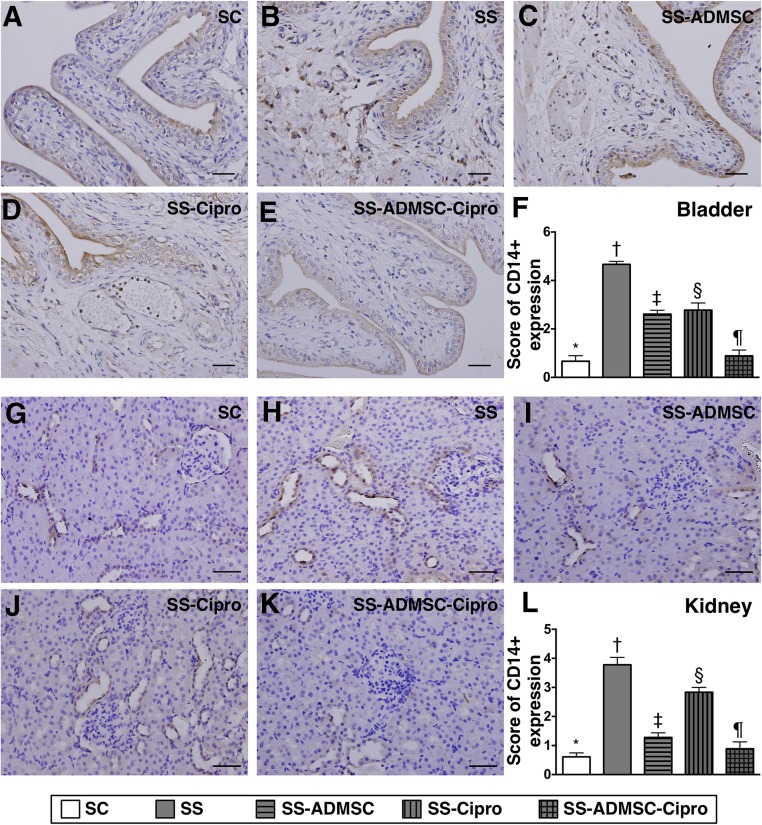
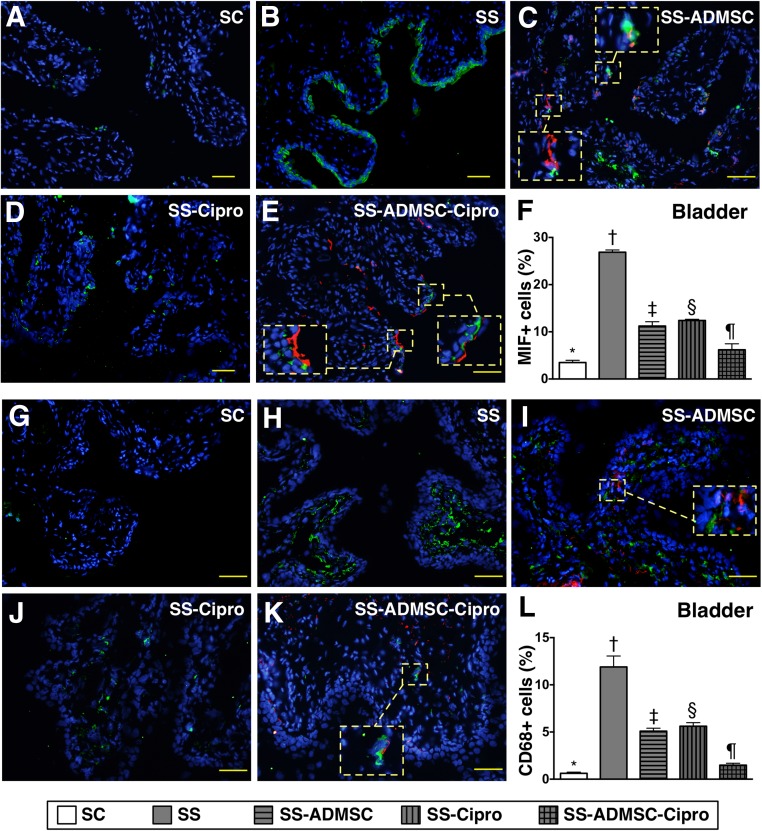
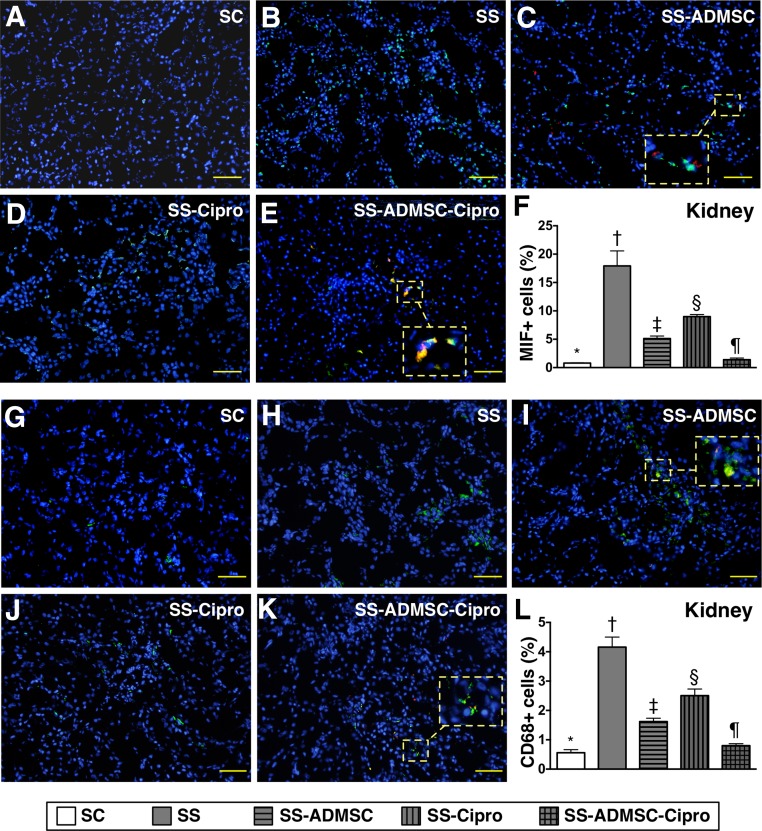
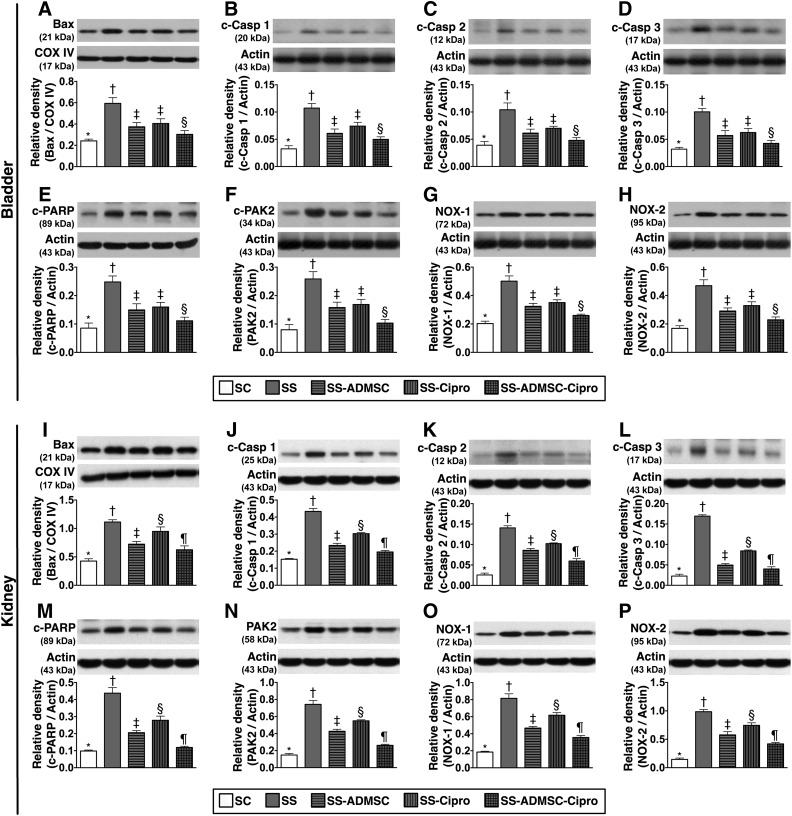
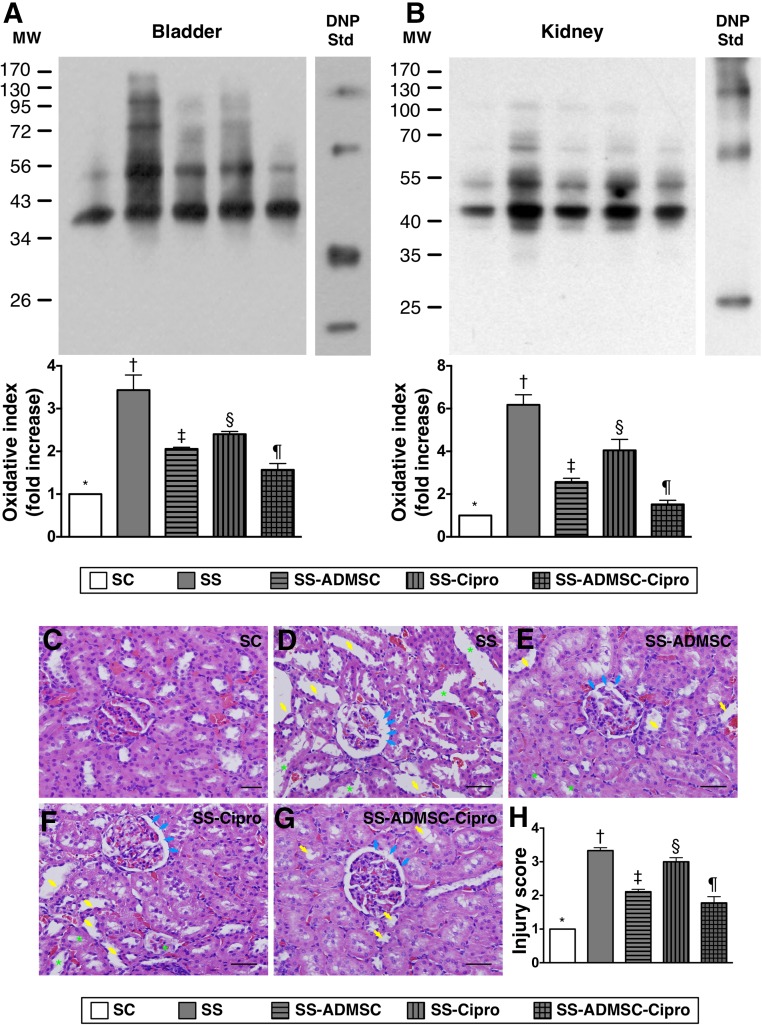
We hypothesized that combined treatment with autologous adipose-derived mesenchymal stem cell (ADMSC) and ciprofloxacin is superior to ciprofloxacin only in reducing sepsis-induced urogenital organ damage and mortality in rat sepsis syndrome (SS) caused by intrapelvic injection of cecal bacteria (1.0 × 10(4) cells per milliliter; total, 5.0 ml). Male Sprague-Dawley rats (n = 60) equally divided into group 1 (sham-control), group 2 (SS), group 3 (SS-ADMSC [5.0 × 10(5) intravenously at 0.5, 6, and 18 hours after sepsis induction]), group 4 (SS-ciprofloxacin [3.0 mg/kg, b.i.d.] for 5 days), and group 5 (SS-ADMSC-ciprofloxacin) were sacrificed by day 5. Mortality rate and creatinine level were highest in group 2 and lowest in group 1 and significantly higher in groups 3 and 4 than those in group 5, but there was no difference between groups 3 and 4 (all p < .005). The kidney injury score, inflammatory biomarker expressions at protein (tumor necrosis factor-1α, nuclear factor-κB, matrix metallopeptidase-9, regulated on activation, normal T-cell expressed and secreted, interleukin-1β) and cellular (CD14+, migratory inhibitor factor positive, CD68+) levels in kidneys and urinary bladder were lowest in group 1 and highest in group 2, higher in group 4 than in groups 3 and 5, and higher in group 3 than in group 5 (all p < .001). Protein expressions of apoptosis (Bax, cleaved caspase 3 and poly[ADP-ribose] polymerase 1, p21 protein [Cdc42/Rac]-activated kinase 2) and oxidative stress (oxidized protein, NADPH oxidase (NOX)-1, NOX-2) in these organs showed an identical pattern compared with that of inflammation in all groups (all p < .001). In conclusion, ADMSC-assisted ciprofloxacin therapy offered an additional benefit by reducing acute urogenital organ damage in rat.
Significance: Autologous adipose-derived mesenchymal stem cell-assisted ciprofloxacin therapy offered an additional benefit by reducing acute urogenital organ damage in rats.
Keywords: Adipose-derived mesenchymal stem cells; Antibiotics; Inflammation; Sepsis syndrome; Urogenital organ damage.
©AlphaMed Press.
Figures
Comment in
-
Re: Combined Therapy with Adipose-Derived Mesenchymal Stem Cells and Ciprofloxacin against Acute Urogenital Organ Damage in Rat Sepsis Syndrome Induced by Intrapelvic Injection of Cecal Bacteria.J Urol. 2016 Dec;196(6):1816-1817. doi: 10.1016/j.juro.2016.09.012. Epub 2016 Sep 14. J Urol. 2016. PMID: 27845140 No abstract available.
-
Re: Combined Therapy with Adipose-Derived Mesenchymal Stem Cells and Ciprofloxacin against Acute Urogenital Organ Damage in Rat Sepsis Syndrome Induced by Intrapelvic Injection of Cecal Bacteria.J Urol. 2017 May;197(5):1279. doi: 10.1016/j.juro.2017.02.011. Epub 2017 Feb 10. J Urol. 2017. PMID: 29539909 No abstract available.
Similar articles
-
Additional benefit of combined therapy with melatonin and apoptotic adipose-derived mesenchymal stem cell against sepsis-induced kidney injury.J Pineal Res. 2014 Aug;57(1):16-32. doi: 10.1111/jpi.12140. Epub 2014 May 15. J Pineal Res. 2014. PMID: 24761983
-
Apoptotic adipose-derived mesenchymal stem cell therapy protects against lung and kidney injury in sepsis syndrome caused by cecal ligation puncture in rats.Stem Cell Res Ther. 2013;4(6):155. doi: 10.1186/scrt385. Stem Cell Res Ther. 2013. PMID: 24451364 Free PMC article.
-
Combination of adipose-derived mesenchymal stem cells (ADMSC) and ADMSC-derived exosomes for protecting kidney from acute ischemia-reperfusion injury.Int J Cardiol. 2016 Aug 1;216:173-85. doi: 10.1016/j.ijcard.2016.04.061. Epub 2016 Apr 14. Int J Cardiol. 2016. PMID: 27156061
-
Adipose-Derived Mesenchymal Stem Cells: A New Tool for the Treatment of Renal Fibrosis.Stem Cells Dev. 2018 Oct 15;27(20):1406-1411. doi: 10.1089/scd.2017.0304. Epub 2018 Aug 27. Stem Cells Dev. 2018. PMID: 30032706 Review.
-
Virus integration and genome influence in approaches to stem cell based therapy for andro-urology.Adv Drug Deliv Rev. 2015 Mar;82-83:12-21. doi: 10.1016/j.addr.2014.10.012. Epub 2014 Oct 18. Adv Drug Deliv Rev. 2015. PMID: 25453258 Free PMC article. Review.
Cited by
-
Concise Reviews: Stem Cells and Kidney Regeneration: An Update.Stem Cells Transl Med. 2019 Jan;8(1):82-92. doi: 10.1002/sctm.18-0115. Epub 2018 Oct 9. Stem Cells Transl Med. 2019. PMID: 30302937 Free PMC article. Review.
-
Interplay Between Inflammatory-immune and Interleukin-17 Signalings Plays a Cardinal Role on Liver Ischemia-reperfusion Injury-Synergic Effect of IL-17Ab, Tacrolimus and ADMSCs on Rescuing the Liver Damage.Stem Cell Rev Rep. 2023 Nov;19(8):2852-2868. doi: 10.1007/s12015-023-10611-4. Epub 2023 Aug 26. Stem Cell Rev Rep. 2023. PMID: 37632641
-
Additional benefit of induced pluripotent stem cell-derived mesenchymal stem cell therapy on sepsis syndrome-associated acute kidney injury in rat treated with antibiotic.Stem Cell Res Ther. 2021 Oct 7;12(1):526. doi: 10.1186/s13287-021-02582-5. Stem Cell Res Ther. 2021. PMID: 34620235 Free PMC article.
-
Combinational therapy with antibiotics and antibiotic-loaded adipose-derived stem cells reduce abscess formation in implant-related infection in rats.Sci Rep. 2020 Jul 7;10(1):11182. doi: 10.1038/s41598-020-68184-y. Sci Rep. 2020. PMID: 32636453 Free PMC article.
-
Mesenchymal stromal cell-derived extracellular vesicles: regenerative and immunomodulatory effects and potential applications in sepsis.Cell Tissue Res. 2018 Oct;374(1):1-15. doi: 10.1007/s00441-018-2871-5. Epub 2018 Jun 28. Cell Tissue Res. 2018. PMID: 29955951 Review.
References
-
- Dellinger RP, Levy MM, Carlet JM, et al. Surviving Sepsis Campaign: International guidelines for management of severe sepsis and septic shock: 2008. Crit Care Med. 2008;36:296–327. - PubMed
-
- Cronshaw HL, Daniels R, Bleetman A, et al. Impact of the Surviving Sepsis Campaign on the recognition and management of severe sepsis in the emergency department: are we failing? Emerg Med J. 2011;28:670–675. - PubMed
-
- Tipler PS, Pamplin J, Mysliwiec V, et al. Use of a protocolized approach to the management of sepsis can improve time to first dose of antibiotics. J Crit Care. 2013;28:148–151. - PubMed
-
- Angus DC, Linde-Zwirble WT, Lidicker J, et al. Epidemiology of severe sepsis in the United States: Analysis of incidence, outcome, and associated costs of care. Crit Care Med. 2001;29:1303–1310. - PubMed
Publication types
MeSH terms
Substances
LinkOut - more resources
Full Text Sources
Other Literature Sources
Research Materials
Miscellaneous
