. 2016 Apr 13;108(8):djw026.
doi: 10.1093/jnci/djw026. Print 2016 Aug.

miR-141-Mediated Regulation of Brain Metastasis From Breast Cancer

Affiliations

miR-141-Mediated Regulation of Brain Metastasis From Breast Cancer

Bisrat G Debeb et al. J Natl Cancer Inst. .

Abstract

Background: Brain metastasis poses a major treatment challenge and remains an unmet clinical need. Finding novel therapies to prevent and treat brain metastases requires an understanding of the biology and molecular basis of the process, which currently is constrained by a dearth of experimental models and specific therapeutic targets.

Methods: Green Fluorescent Protein (GFP)-labeled breast cancer cells were injected via tail vein into SCID/Beige mice (n = 10-15 per group), and metastatic colonization to the brain and lung was evaluated eight weeks later. Knockdown and overexpression of miR-141 were achieved with lentiviral vectors. Serum levels of miR-141 were measured from breast cancer patients (n = 105), and the association with clinical outcome was determined by Kaplan-Meier method. All statistical tests were two-sided.

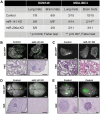
Results: Novel brain metastasis mouse models were developed via tail vein injection of parental triple-negative and human epidermal growth factor receptor 2 (HER2)-overexpressing inflammatory breast cancer lines. Knockdown of miR-141 inhibited metastatic colonization to brain (miR-141 knockdown vs control: SUM149, 0/8 mice vs 6/9 mice,P= .009; MDA-IBC3, 2/14 mice vs 10/15 mice,P= .007). Ectopic expression of miR-141 in nonexpressing MDA-MB-231 enhanced brain metastatic colonization (5/9 mice vs 0/10 mice,P= .02). Furthermore, high miR-141 serum levels were associated with shorter brain metastasis-free survival (P= .04) and were an independent predictor of progression-free survival (hazard ratio [HR] = 4.77, 95% confidence interval [CI] = 2.61 to 8.71,P< .001) and overall survival (HR = 7.22, 95% CI = 3.46 to 15.06,P< .001).

Conclusions: Our study suggests miR-141 is a regulator of brain metastasis from breast cancer and should be examined as a biomarker and potential target to prevent and treat brain metastases.


Figures

Figure 1.
Figure 1.
Association of the epithelial phenotype and E-cadherin expression with brain metastasis. A) GFP-labeled SUM149 cells injected via tail vein into immunocompromised mice. Scale bar = 100 µm. B) Lung metastasis sublines (LuMS) and brain metastasis sublines (BrMS) were derived by digesting tissues from a lung and a brain metastasis from a xenograft mouse model and culturing them in an adherent culture. The BrMS were morphologically epithelial-like whereas the LuMS were mesenchymal-like. Scale bars: left = 2000 µm; right = 100 µm. C) Western blot showing that the BrMS expressed markers consistent with an epithelial phenotype whereas the LuMS showed mesenchymal molecular characteristics. D) Immunohistochemical staining shows stronger expression of E-cadherin in xenograft tissues obtained from brain metastases vs lung metastases (scale bar = 200 µm; inset = 25 µm). E) Unsupervised hierarchical clustering analysis of the 50 most differentially expressed genes revealed a segregation of the BrMS with the E-cadherin-expressing HMLE cells, and the LuMS with the metastatic profile generated from E-cadherin loss (red = upregulated genes; blue = downregulated genes) (21). F) Gene set enrichment analysis (GSEA) identified E-cadherin stabilization and cell junction organization pathways over-represented in BrMS, and extracellular matrix organization and collagen formation pathways in LuMS. G) miRNA microarray showed that the LuMS clustered distinctly from the BrMS and miR-200s (miR-141, miR-200a, miR-200b, and miR-200c) were overexpressed in all of the BrMS sublines (P < .001, false discovery rate = 0.05) (red = upregulated genes; green = downregulated genes). BrMS = brain metastasis sublines; LuMS = lung metastasis sublines.
Figure 2.
Figure 2.
miR-141 knockdown and metastatic colonization in xenograft mouse models. A) Mice were injected via tail vein with 1 × 106 GFP-labeled SUM149 cells (n = 10/group) or 5 × 105 GFP-labeled MDA-IBC3 cells (n = 15/group), and brain and lung metastatic colonization were analyzed eight weeks after injection by fluorescent stereomicroscopy. Mice injected with cancer cells that either died immediately or days after injection or were found dead before the eight-week endpoint were excluded from the final analysis. Both cell lines were transduced with miR-141 knockdown (KD), miR-200a KD, or control vector. Transduction with miR-141 KD completely and specifically blocked metastasis to the brain in SUM149 cells (P = .009, Fisher’s exact test, two-sided) and statistically significantly reduced brain metastasis in MDA-IBC3 cells (P = .007, Fisher’s exact test, two-sided). B and C) Representative bright field (BF)–fluorescence images (upper panel) and hematoxylin and eosin (H&E)–stained images (lower panel) of lung metastases from mice injected with SUM149 control and miR-141 KD cells (B) (scale bars: upper = 2000 µm; lower = 1000 µm) and MDA-IBC3 control and miR-141 KD cells (C) (scale bars: upper = 2000 µm; lower = 100 µm). D and E) Representative BF-fluorescence images (upper panel) and H&E images (lower panel) of brain metastases from mice injected with control and miR-141 KD SUM149 cells (D) (scale bars: upper = 2000 µm; lower = 1000 µm) and MDA-IBC3 cells (E) (scale bars: upper = 2000 µm; lower = 100 µm). H&E = hematoxylin and eosin.
Figure 3.
Figure 3.
Receptor status of brain metastasis lesions generated from each parental cell line. A) Representative images from sections of brain metastasis lesions obtained from experimental models SUM149 and MDA-IBC3 (via tail vein injection) stained for estrogen receptor, progesterone receptor, and human epidermal growth factor receptor 2 (scale bar = 100 µm). B) In situ hybridization showing high levels of miR-141 in brain metastasis xenografts from SUM149 and MDA-IBC3 cell lines (scale bar = 100 µm). ER = estrogen receptor; HER2 = human epidermal growth factor receptor 2; PR = progesterone receptor.
Figure 4.
Figure 4.
Immunohistochemical staining of brain and lung metastasis lesions from xenografts. A and B) Representative images from histological sections of brain and lung metastases generated via tail vein injection of SUM149 cells (A) and MDA-IBC3 cells (B) stained for Ki-67, CK5/6, and E-cadherin. Scale bar = 100 µm. C) Quantification of E-cadherin expression in brain vs lung metastasis xenograft tissue sections (P < .03, t test, two-sided). Error bars represent standard deviation.
Figure 5.
Figure 5.
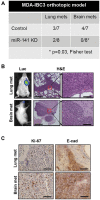
miR-141 in a spontaneous brain metastasis xenograft model. Spontaneous brain metastasis model generated with MDA-IBC3 cells. Cells were implanted into the cleared mammary fat pads of SCID/Beige mice, and primary tumors were resected when their volumes were bigger than 300 mm3. A) Quantification of lung and brain metastasis in xenograft mouse model generated via orthotopic injection of control and miR-141 KD MDA-IBC3 cells into the cleared mammary fat pads of SCID/Beige mice (n = 8). In Control MDA-IBC3, four of seven mice developed brain metastases while none of the mice from miR-141 KD developed brain metastases (P = .03), Fisher’s exact test, two-sided). B) Live bioimaging images of mice and images of sections of brain and lung metastases stained with hematoxylin and eosin collected from mice injected orthotopically with MDA-IBC3 cells. Scale bars: left = 1000 µm; right = 100 µm. C) Sections of brain and lung metastases collected from mice injected orthotopically with MDA-IBC3 cells and stained for Ki-67 and E-cadherin. Expression of E-cadherin in brain metastasis tissues is uniformly strong in this orthotopic model of metastasis. Scale bar = 100 µm. H&E = hematoxylin and eosin.
Figure 6.
Figure 6.
Ectopic expression of miR-141 in low-expressing breast cancer cells and its effect on brain metastasis. A) Overexpression of miR-141 in MDA-231 and SUM159 parental cell lines as validated by real-time polymerase chain reaction. Error bars represent standard deviation. B) Mice were injected via tail vein with 5 × 105 GFP-labeled MDA-231 cells (n = 11/group) and with 5 × 105 GFP-labeled SUM159 cells (n = 12/group). Mice injected with cancer cells that either died immediately or days after injection or were found dead before the eight-week endpoint were excluded from the final analysis. None of the control-vector-transduced MDA-231 cells metastasized to the brain while miR-141 OE MDA-231 cells did (P = .02, Fisher’s exact test, two-sided). C and D) Representative bright field (BF)–fluorescence images (upper panel, scale bar = 2000 µm) and hematoxylin and eosin (H&E) images (lower panel, scale bar = 100 µm) of brain metastases (C) and lung metastases (D) collected from mice injected with control and miR-141 OE-transduced MDA-231 cells. E) Representative BF-fluorescence images (upper panel, scale bar = 2000 µm) and H&E images (lower panel, scale bar = 1000 µm) of lung metastases from mice injected with control and miR-141 OE-transduced SUM159 cells. H&E = hematoxylin and eosin.
Figure 7.
Figure 7.
Markers in brain metastasis xenografts from ectopically miR-141-overexpressing cell lines. A and B) Representative images from sections of brain and lung metastases collected from miR-141 OE MDA-231 (A) and miR-141 OE SUM159 (B) cells stained for Ki-67, CK5/6, and E-cadherin. Focally E-cadherin-positive cells observed at the brain meninges but not in lung metastases or brain parenchyma of miR-141 OE MDA-231. Scale bar = 100 µm. C) In situ hybridization showing high levels of miR-141 in brain metastasis tissues generated from tail vein injection of MDA-231 miR-141 OE cells. Scale bar = 100 µm. D) Quantification of E-cadherin expression by real-time polymerase chain reaction showing statistically significant increase in E-cadherin mRNA expression in MDA-231 miR-141 OE cells compared with parental control cells (P = .003, t test, two-sided) but not in SUM159 miR-141 OE cells vs parental control cells. Error bars represent standard deviation.
Figure 8.
Figure 8.
Association of serum miR-141 levels with clinical outcome in breast cancer patients. A) Patients with metastatic inflammatory breast cancer (IBC; n = 39) had higher serum miR-141 levels than patients with locally advanced breast cancer (n = 16) (P = .008) or patients with metastatic non-IBC, n = 31) (P = .01, Mann-Whitney test, two-sided). B and C) Kaplan-Meier curves demonstrate serum miR-141 levels associated with shorter progression-free survival times (B) (4.2 vs 7.8 months, P = .002, log-rank, two-sided) and shorter overall survival times (C) (12.3 vs 27.8 months, P = .001, log-rank, two-sided) in patients with metastatic breast cancer (both metastatic IBC and metastatic non-IBC). The number of patients at risk in the detected vs undetected miR-141 groups at different time points are presented at the bottom of the graphs. D) High serum miR-141 levels were associated with shorter brain metastasis–free survival (P = .04, log-rank, two-sided). IBC = inflammatory breast cancer; LABC = locally advanced breast cancer; MIBC = metastatic IBC; MNIBC = metastatic non-IBC; OS = overall survival; PFS = progression-free survival.

References

    1. Lin NU, Bellon JR, Winer EP. CNS metastases in breast cancer. J Clin Oncol. 2004;22(17):3608–3617. - PubMed
    1. Lin NU, Claus E, Sohl J, et al. Sites of distant recurrence and clinical outcomes in patients with metastatic triple-negative breast cancer: high incidence of central nervous system metastases. Cancer. 2008;113(10):2638–2645. - PMC - PubMed
    1. Lin NU, Winer EP. Brain metastases: the HER2 paradigm. Clin Cancer Res. 2007;13(6):1648–1655. - PubMed
    1. Langley RR, Fidler IJ. The biology of brain metastasis. Clin Chem. 2013;59(1):180–189. - PubMed
    1. Fidler IJ. The role of the organ microenvironment in brain metastasis. Semin Cancer Biol. 2011;21(2):107–112. - PubMed

Publication types

MeSH terms