. 2016 Apr 12;23(4):712-24.
doi: 10.1016/j.cmet.2016.03.004.

VEGFB/VEGFR1-Induced Expansion of Adipose Vasculature Counteracts Obesity and Related Metabolic Complications

Affiliations

VEGFB/VEGFR1-Induced Expansion of Adipose Vasculature Counteracts Obesity and Related Metabolic Complications

Marius R Robciuc et al. Cell Metab. .

Abstract

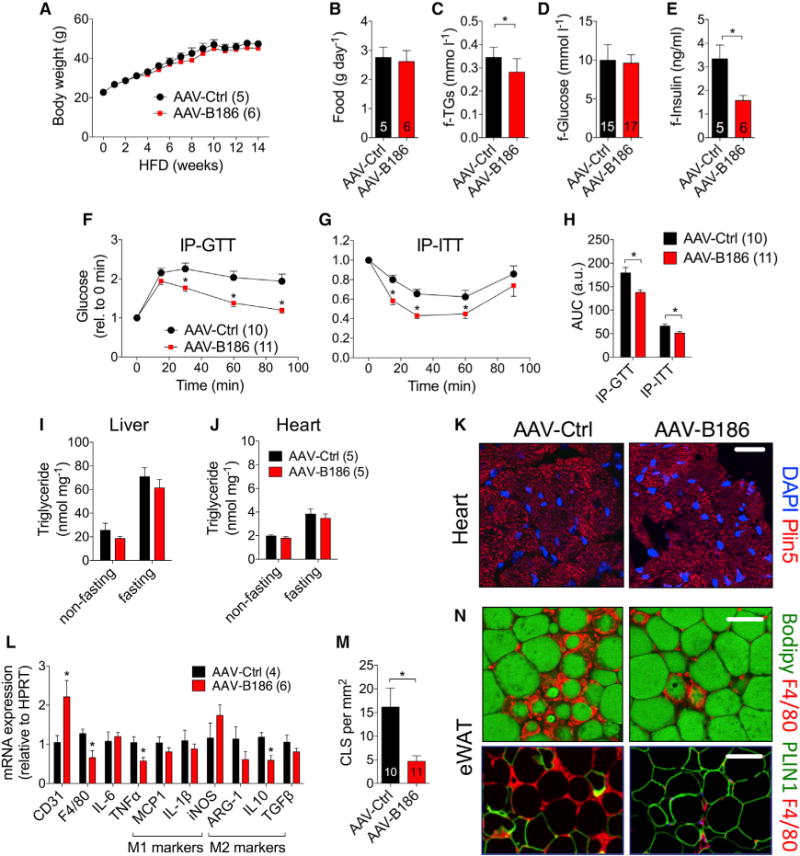
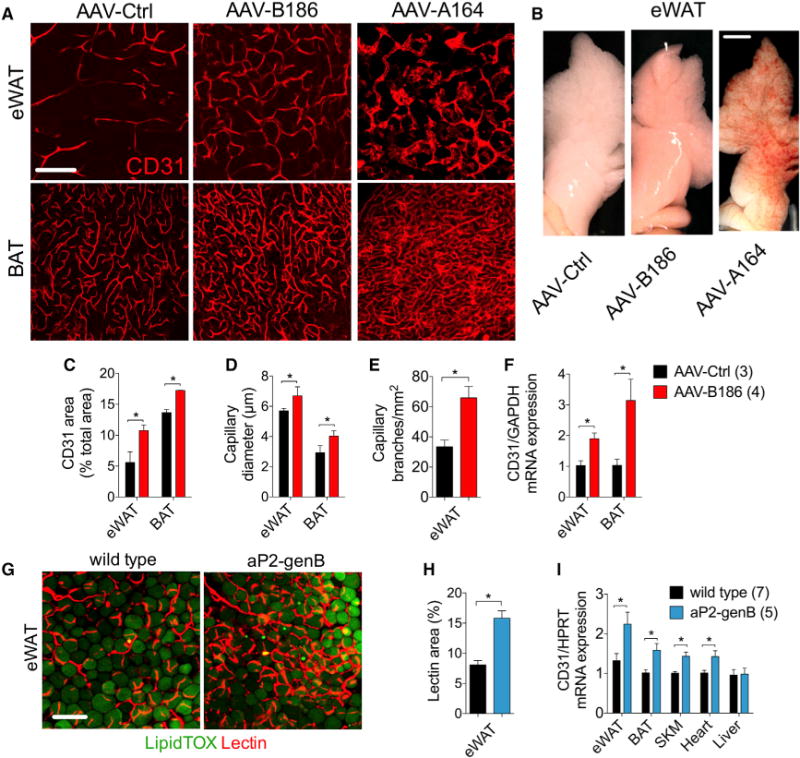
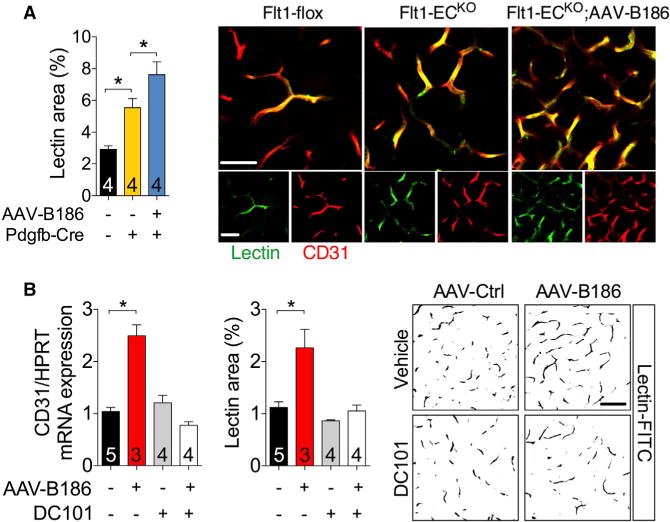
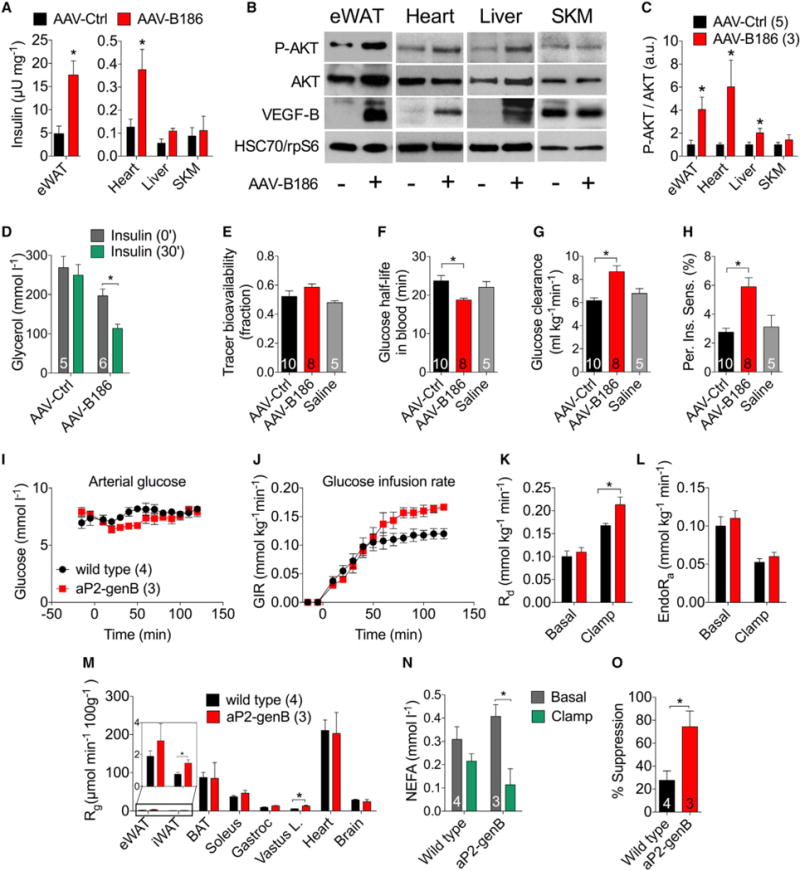
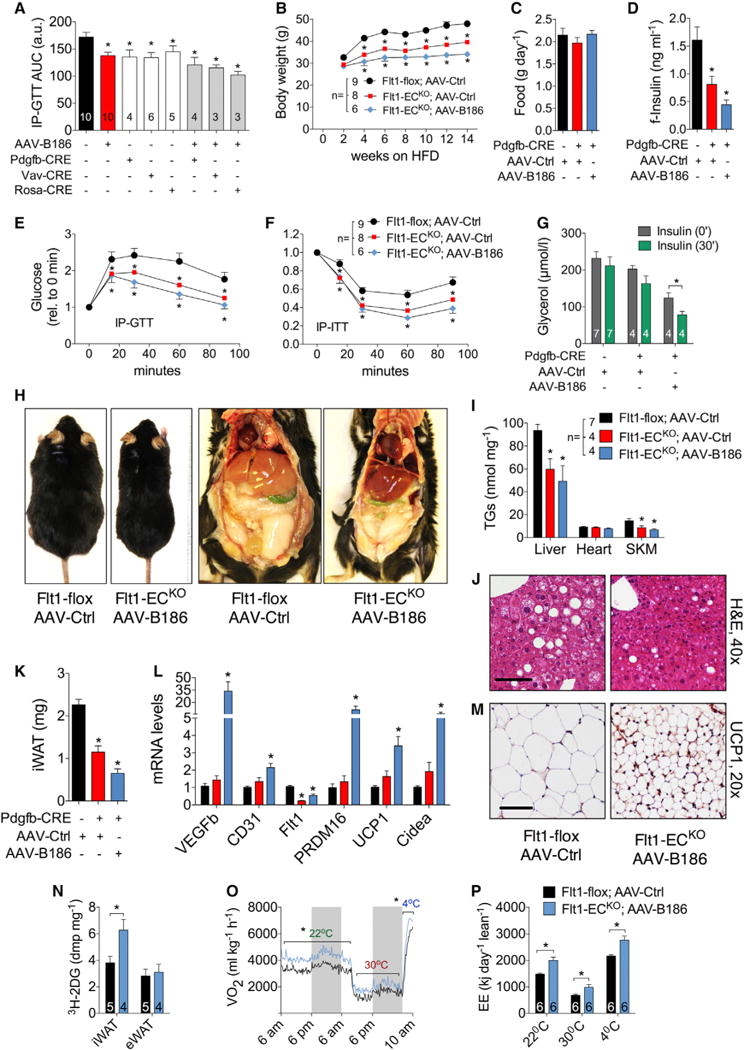
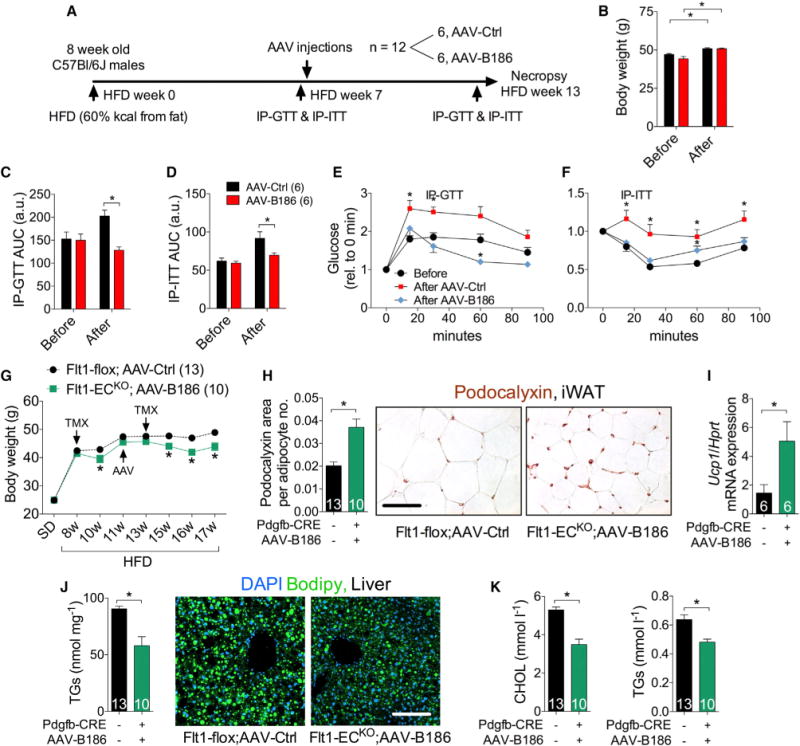
Impaired angiogenesis has been implicated in adipose tissue dysfunction and the development of obesity and associated metabolic disorders. Here, we report the unexpected finding that vascular endothelial growth factor B (VEGFB) gene transduction into mice inhibits obesity-associated inflammation and improves metabolic health without changes in body weight or ectopic lipid deposition. Mechanistically, the binding of VEGFB to VEGF receptor 1 (VEGFR1, also known as Flt1) activated the VEGF/VEGFR2 pathway and increased capillary density, tissue perfusion, and insulin supply, signaling, and function in adipose tissue. Furthermore, endothelial Flt1 gene deletion enhanced the effect of VEGFB, activating the thermogenic program in subcutaneous adipose tissue, which increased the basal metabolic rate, thus preventing diet-induced obesity and related metabolic complications. In obese and insulin-resistant mice, Vegfb gene transfer, together with endothelial Flt1 gene deletion, induced weight loss and mitigated the metabolic complications, demonstrating the therapeutic potential of the VEGFB/VEGFR1 pathway.


Figures

Figure 1
Figure 1. Improved Lipid and Glucose Metabolism but No Changes in Ectopic Lipid Deposition in HFD-Fed AAV-B186-Expressing Mice
C57BL/6JOlaHsd males transduced with AAVs and fed a HFD were used for the experiments. (A–E) Comparison of (A) body weight, (B) food consumption, and fasting levels of (C) triglycerides, (D) glucose, and (E) insulin. (F–H) IP-GTT (F), IP-ITT (G), and area under the curce (AUC) (H). (I and J) Triglyceride concentration in the (I) liver and (J) heart. (K) Visualization of lipid droplets in Plin5-stained heart sections. (L) eWAT gene expression analysis by qPCR. (M and N) Crown-like structure (CLS) quantification (M) from F4/80 (macrophage, red)-stained eWAT sections (N). Adipocytes were stained green for lipids (Bodipy) or perilipin 1 (PLIN1). Scale bars, (K) 50 μm and (N) 100 μm. The number of mice is indicated in the figure. Data are represented as mean ± SEM. *p < 0.05, calculated with two-tailed unpaired t test.
Figure 2
Figure 2. VEGFB Transduction Leads to Adipose Tissue Capillary Bed Expansion
C57BL/6JOlaHsd males on a standard diet, transduced for 2 to 4 weeks with the indicated AAVs or transgenic for VEGFB were used for the experiments. (A) Representative confocal projections of adipose tissue whole-mount staining for CD31. (B) Macroscopic images of eWAT. (C–E) CD31 area (C), capillary diameter (D), and capillary branch density (E) were quantified from images represented by the panels in (A). (F) CD31 mRNA expression in adipose tissue. (G and H) Representative confocal projections of adipose tissue whole-mount staining from mice injected intravenously with lectin (G) and lectin area quantification (H). (I) CD31 mRNA expression in various tissues. Scale bar, (A and G) 100 μm and (B) 3 μm. The number of mice is indicated in the figure. Data are represented as mean ± SEM. *p < 0.05, calculated with two-tailed unpaired t test.
Figure 3
Figure 3. VEGFR1 Deletion Boosts, whereas VEGF/VEGFR2 Blockage Abolishes the Effect of VEGFB on Adipose Tissue Vasculature
Mice were transduced with the indicated AAVs 2 weeks before analysis. (A) Quantification of lectin-perfused vessel areas and the representative optical sections of eWAT from Flt1-flox and Flt1-ECKO mice. (B) CD31 mRNA levels, quantification of lectinperfused areas, and the representative optical sections of eWAT from C57Bl/6JOlaHsd male mice that received DC101 or vehicle. Scale bar, (A) 50 μm and (B) 100 μm. The number of mice is indicated in the figure. Data are represented as mean ± SEM. *p < 0.05, calculated using the one-way ANOVA, Holm-Sidak’s multiple comparisons test.
Figure 4
Figure 4. Elevated VEGFB Levels Increase Insulin Delivery, Signaling, and Function and Improve Insulin Sensitivity in HFD-Fed Mice
C57Bl/6JOlaHsd (A–F) or apoE*3Leiden;hCETP-Tg (G–K) males transduced with AAVs or Vegfb transgenic males (I–O) were fed a HFD and used for the experiments. Mice were injected with 0.75 U/kg insulin and analyzed after 10 min (A–C) or 30 min (D–F). (A) Human insulin concentration in mouse tissues measured by an ultrasensitive ELISA. (B and C) Western blot images (B) and quantifications using ImageJ (C). HSC70 or rpS6 were used as loading controls. (D) Serum levels of glycerol. (E–H) Bioavailability of [U-13C]-glucose (E) and analysis of tracer half-life (F), glucose clearance rate (G), and peripheral insulin sensitivity (H). (I and J) Arterial glucose (I) and GIR (J) during the IC. (K and L) Rd (K) and EndoRa (L) during the IC. (M) Rg after the IC in the eWAT, iWAT, BAT, soleus, gastrocnemius, vastus lateralis, heart, and brain. (N) Non-esterified fatty acid (NEFA) levels in the basal and hyperinsulinemic (clamp) states. (O) Calculated suppression of adipose tissue lipolysis by hyperinsulinemia. The number of mice is indicated in the figure. Data are represented as mean ± SEM. *p < 0.05, calculated with two-tailed unpaired t test (A, C, K, M, and O), two-tailed paired t test (D and N), or one-way ANOVA, Holm-Sidak’s multiple comparisons test (E–H).
Figure 5
Figure 5. Resistance to Diet-Induced Obesity and Associated Metabolic Complications in Flt1-ECKO Mice Transduced with AAV-B186
Flt1-flox male mice on a standard diet (A) or HFD (B–P) were used for the experiments. The mice in control groups were transduced with AAV-Ctrl. (A) Area under curve from IP-GTT performed in the indicated Flt1-flox;Cre transgenic mouse lines treated with tamoxifen and transduced with AAV-Ctrl or AAV-B186. (B and C) Body weight (B) and food consumption (C) measurements. (D–F) Fasting serum insulin (D), IP-GTT (E), and IP-ITT (F) for 6–7 weeks of HFD. (G) Adipose tissue response to insulin. (H) Representative necropsy images. (I) Triglyceride levels in tissues. (J) H&E staining of paraffin sections from the liver. (K–M) iWAT weight (K), gene expression (L), and UCP-1 immunohistochemistry (M). (N) Insulin stimulated 2DG uptake in iWAT and eWAT. (O and P) Oxygen consumption (O) and energy expenditure (P) assessed using metabolic cages. Scale bar, 50 μm. The number of mice is indicated in the figure. Data are represented as mean ± SEM. *p < 0.05, calculated with one-way ANOVA, Holm-Sidak’s multiple comparisons test (A–H and J) or two-tailed paired t test (I) when compared to the untreated group (insulin, 0 min).
Figure 6
Figure 6. Therapeutic Potential of the VEGFB/VEGFR1 Pathway in Obesity
HFD-fed C57BL/6JOlaHsd (A–F) and Flt1-flox (G–I) males were used for the experiments. (A) Experimental design to assess the therapeutic potential of AAV-B186. (B) Body weight before and 6 weeks after AAV injections. (C–F) AUC and IP-GTT and IP-ITT (G) Body weight monitoring and therapeutic strategy. Tamoxifen treatment (TMX) was administered during two periods, as indicated. (H) iWAT capillary density analysis by podocalyxin staining. The podocalyxin area was normalized to the number of adipocytes per field to account for the reduction in adipocyte size. (I) Relative iWAT UCP-1 mRNA levels measured by RT-PCR. (J) Quantification of liver triglyceride levels and images of liver lipid droplets stained with Bodipy. (K) Serum levels of cholesterol (CHOL) and triglycerides (TGs). Scale bar, 50 μm. The number of mice is indicated in the figure. Data are represented as mean ± SEM. *p < 0.05, calculated with two-tailed paired t test in (B, E, and F) and two-tailed unpaired t test in (C, D, and G–K).

Comment in

References

    1. Aase K, von Euler G, Li X, Ponten A, Thorén P, Cao R, Cao Y, Olofsson B, Gebre-Medhin S, Pekny M, et al. Vascular endothelial growth factor-B-deficient mice display an atrial conduction defect. Circulation. 2001;104:358–364. - PubMed
    1. Anisimov A, Leppänen VM, Tvorogov D, Zarkada G, Jeltsch M, Holopainen T, Kaijalainen S, Alitalo K. The basis for the distinct biological activities of vascular endothelial growth factor receptor-1 ligands. Sci Signal. 2013;6:ra52. - PubMed
    1. Ayala JE, Bracy DP, McGuinness OP, Wasserman DH. Considerations in the design of hyperinsulinemic-euglycemic clamps in the conscious mouse. Diabetes. 2006;55:390–397. - PubMed
    1. Ayala JE, Bracy DP, Malabanan C, James FD, Ansari T, Fueger PT, McGuinness OP, Wasserman DH. Hyperinsulinemic-euglyce-mic clamps in conscious, unrestrained mice. J Vis Exp. 2011;57:e3188. - PMC - PubMed
    1. Baba T, Shimada K, Neugebauer S, Yamada D, Hashimoto S, Watanabe T. The oral insulin sensitizer, thiazolidinedione, increases plasma vascular endothelial growth factor in type 2 diabetic patients. Diabetes Care. 2001;24:953–954. - PubMed

Publication types

MeSH terms

Substances