. 2016 Jun;6(6):664-79.
doi: 10.1158/2159-8290.CD-16-0040. Epub 2016 Apr 13.

Identification of Predictive Biomarkers for Cytokine Release Syndrome after Chimeric Antigen Receptor T-cell Therapy for Acute Lymphoblastic Leukemia

Affiliations

Identification of Predictive Biomarkers for Cytokine Release Syndrome after Chimeric Antigen Receptor T-cell Therapy for Acute Lymphoblastic Leukemia

David T Teachey et al. Cancer Discov. 2016 Jun.

Abstract

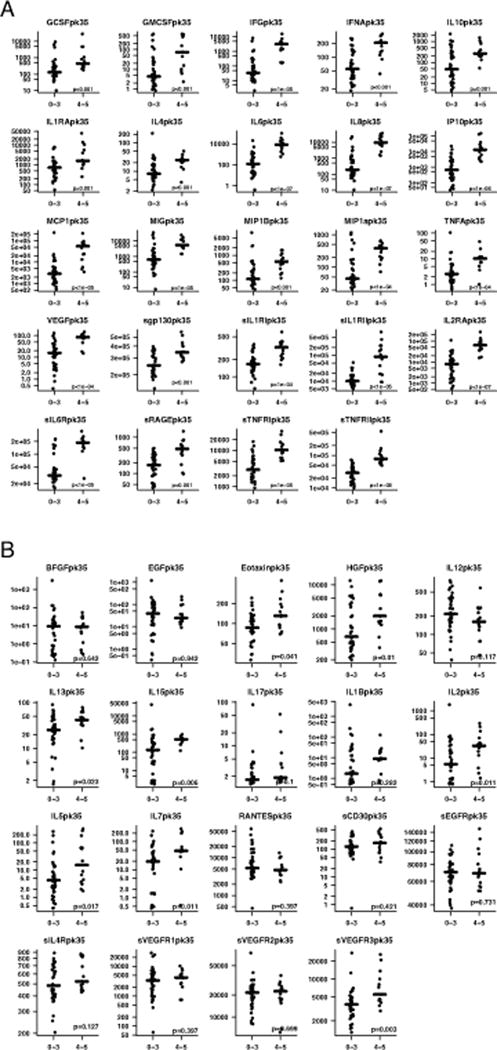
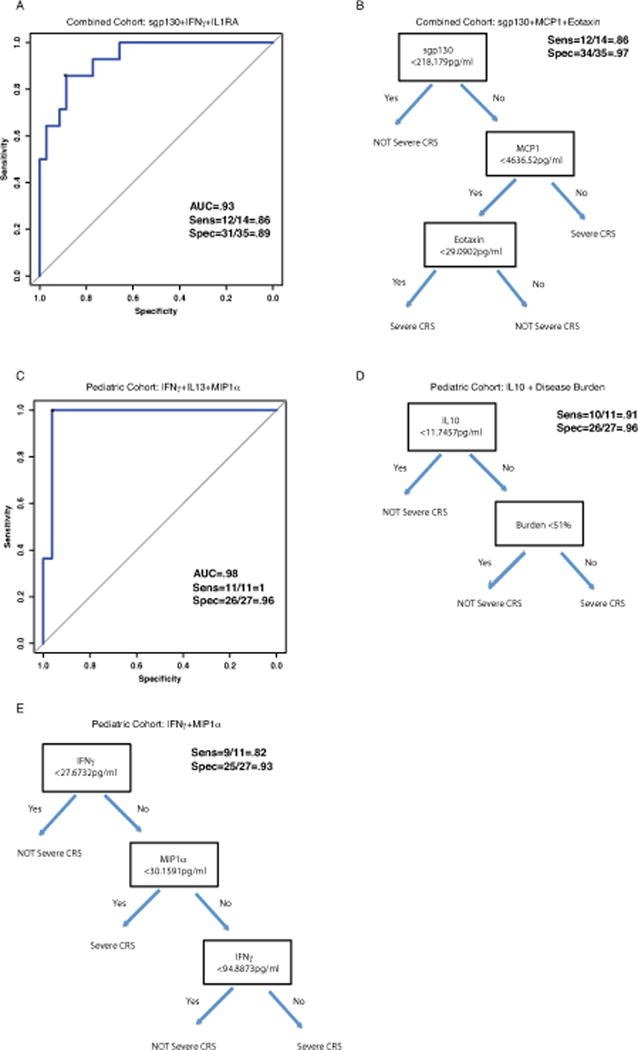
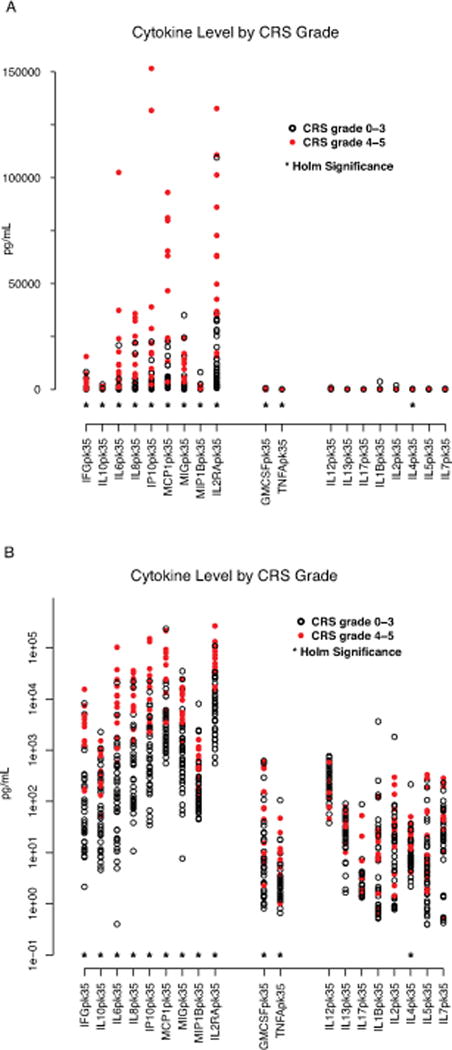
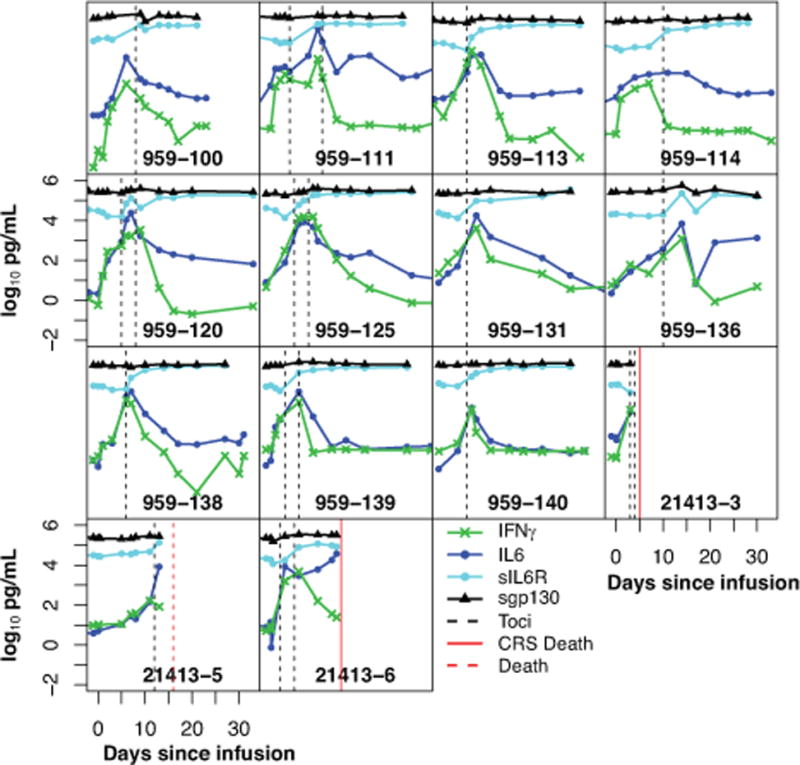
Chimeric antigen receptor (CAR)-modified T cells with anti-CD19 specificity are a highly effective novel immune therapy for relapsed/refractory acute lymphoblastic leukemia. Cytokine release syndrome (CRS) is the most significant and life-threatening toxicity. To improve understanding of CRS, we measured cytokines and clinical biomarkers in 51 CTL019-treated patients. Peak levels of 24 cytokines, including IFNγ, IL6, sgp130, and sIL6R, in the first month after infusion were highly associated with severe CRS. Using regression modeling, we could accurately predict which patients would develop severe CRS with a signature composed of three cytokines. Results were validated in an independent cohort. Changes in serum biochemical markers, including C-reactive protein and ferritin, were associated with CRS but failed to predict development of severe CRS. These comprehensive profiling data provide novel insights into CRS biology and, importantly, represent the first data that can accurately predict which patients have a high probability of becoming critically ill.

Significance: CRS is the most common severe toxicity seen after CAR T-cell treatment. We developed models that can accurately predict which patients are likely to develop severe CRS before they become critically ill, which improves understanding of CRS biology and may guide future cytokine-directed therapy. Cancer Discov; 6(6); 664-79. ©2016 AACR.See related commentary by Rouce and Heslop, p. 579This article is highlighted in the In This Issue feature, p. 561.


Conflict of interest statement

Conflict of Interest Statement. Carl June, Stephan Grupp, David Teachey, Simon Lacey, Pamela Shaw, J. Joseph Melenhorst, Noelle Frey, Shannon Maude, Fang Chen, Vanessa Gonzalez, Edward Pequignot, Bruce Levine and David Porter received research funding from Novartis. Shannon Maude and Susan Rheingold perform consultancy for Novartis. Carl June, David Porter, and Bruce Levine have patents and royalties, Zhaohui Zheng has royalties, and Stephan Grupp has a patent in the field of cell and gene therapy that are managed in accordance with University of Pennsylvania policy and oversight.

Figures

Figure 1
Figure 1. Cytokines associated with severe CRS
Serial cytokine assessment of 43 cytokines was performed in 51 patients treated with CTL019. Cytokine profiles were compared in patients who developed severe CRS with patients who did not. Figure 1 depicts peak values of cytokines over the first month. (A). 24 cytokines, including IFNγ, IL6, IL8, sIL2Rα, sgp130, sIL6R, MCP1, MIP1α, and GM-CSF were highly associated with CRS4-5 compared to CRS0-3, significant by Holm’s adjusted p-value. (B). The 19 cytokines that were not statistically different by CRS severity based on Holm’s adjusted p-value.
Figure 2
Figure 2. Cytokine profiles can predict severe CRS
Cytokines were analyzed from the first 3 days after infusion, sent before patients developed severe CRS. Logistic and classification tree models were used to identify predictors of severe CRS. With a 3-variable regression model, found by forward selection, we accurately predicted which patients developed severe CRS using IFNγ, sgp130, and IL1RA. Figure 2A depicts ROC curve for the 3-variable regression models in the combined cohort. With a decision tree model, we accurately predicted which patients developed severe CRS using sgp130, MCP1, and Eotaxin (Figure 2B). For the pediatric cohort, using a 3-variable regression model we accurately predicted severe CRS with a combination of IFNγ, IL13, and MIP1α (Figure 2C). In the pediatric cohort only, a bone marrow aspirate was collected immediately prior to infusion. We found disease burden was associated with CRS severity but did not improve the predictive accuracy of the models over the cytokines alone. A combination of a single cytokine, IL10 and disease burden using decision tree modeling was very accurate for CRS prediction (Figure 2D). Without disease burden, using decision tree modeling a combination of IFNγ and MIP1α was accurate in the pediatric only cohort (Figure 2E).
Figure 3
Figure 3. Severe CRS has a cytokine pattern that mirrors hemophagocytic syndrome
19 of the tested cytokines have previously been studied in children macrophage activation syndrome (MAS)/hemophagocytic syndrome (HLH). A near identical pattern of cytokines differentially elevated in HLH were also elevated in patients with CRS4-5 compared with CRS0-3. Figure 3 depicts cytokines are clustered into three groups. Those on left, including IFNγ, IL10, IL6, IL8, IP10, MCP1, MIP1β, and IL2Rα are expected to be elevated in HLH and were also found to be differently elevated in patients with severe CRS. Those in middle, including TNFα and GM-CSF have been found to be elevated in some patients with HLH and normal in others. Those on the right are cytokines expected to be normal in HLH. * = statistically significant by Holm’s adjustment. (A) Data presented in linear scale. (B) Data presented in log 10 scale.
Figure 4
Figure 4. Tocilizumab improves hypercytokinemia in patients with severe CRS
14 of 51 patients developed severe CRS and all were treated with tocilizumab. Cytokines were measured serially. Figure 4 depicts the levels of 4 cytokines starting from day of infusion over the first month. Hashed lines depict time of tocilizumab administration. After tocilizumab treatment, there was generally an apparent transient rise in IL6, followed by a rapid decrease. INFγ also decreased rapidly after tocilizumab administration in most patients. sIL6R increased in all and sgp130 levels increased in most patients after tocilizumab

Comment in

References

    1. Grupp SA, Kalos M, Barrett D, Aplenc R, Porter DL, Rheingold SR, et al. Chimeric antigen receptor-modified T cells for acute lymphoid leukemia. The New England journal of medicine. 2013;368:1509–18. - PMC - PubMed
    1. Maude SL, Frey N, Shaw PA, Aplenc R, Barrett DM, Bunin NJ, et al. Chimeric antigen receptor T cells for sustained remissions in leukemia. The New England journal of medicine. 2014;371:1507–17. - PMC - PubMed
    1. Davila ML, Riviere I, Wang X, Bartido S, Park J, Curran K, et al. Efficacy and toxicity management of 19-28z CAR T cell therapy in B cell acute lymphoblastic leukemia. Sci Transl Med. 2014;6:224ra25. - PMC - PubMed
    1. Lee DW, Kochenderfer JN, Stetler-Stevenson M, Cui YK, Delbrook C, Feldman SA, et al. T cells expressing CD19 chimeric antigen receptors for acute lymphoblastic leukaemia in children and young adults: a phase 1 dose-escalation trial. Lancet. 2015;385:517–28. - PMC - PubMed
    1. Porter DL, Levine BL, Kalos M, Bagg A, June CH. Chimeric antigen receptor-modified T cells in chronic lymphoid leukemia. The New England journal of medicine. 2011;365:725–33. - PMC - PubMed

Publication types

MeSH terms