Meta-Analysis
. 2016 Jun;47(6):1873-6.
doi: 10.1183/13993003.02121-2015. Epub 2016 Apr 13.

A 380-gene meta-signature of active tuberculosis compared with healthy controls

Affiliations
Meta-Analysis

A 380-gene meta-signature of active tuberculosis compared with healthy controls

Simon Blankley et al. Eur Respir J. 2016 Jun.
No abstract available


Figures

Figure 1:
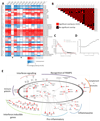
Figure 1:. Modular and meta-profiling identifying common transcriptional response.
(A) Modular analysis of 13 publically available and compatible datasets of TB compared to control groups. 38 annotated modules are displayed as a heatmap with red indicating significant over-abundance of transcripts and a blue indicating significant under-abundance (p <0.05). The colour intensity represents the percentage of genes in that module which are significantly differentially expressed. Two datasets with different modular profiles marked with asterisks. (B) Venn Mapper used to identify significance of overlap between any two differentially expressed gene lists. Significance of overlap between significant gene lists calculated by Venn Mapper programme, with methodology adapted from Smid et al [9]. Significant genes identified following filtering of probes for low expression (probes eliminated if expression less than 2FC from median normalised value in 10% or more of samples), followed by statistical filtering; independent t-test with Benjamini Hochberg multiple testing correction between TB and control group. Probes were then matched to Entrez gene IDs which was used as the reference “array” for analysis. The fold change representation for each gene was the mean fold change of TB group compared to control group, where genes were multiply represented on an array the fold change associated with the most significant q-value was chosen. (C) Differentially expressed genes (DEGs) were identified for each of the sixteen datasets (probes filtered for low expression, followed by statistical filtering; independent t-test with Benjamini Hochberg multiple testing correction between TB and control group) and then using meta-profiling to simulate the data and identify the number of overlaps to define the meta-signature (shaded grey). (D) Genes were grouped by number of datasets in which they were significantly identified, and the percentage calculated which were upregulated (direction of regulation relative to control group; where there were inconsistencies in direction of regulation across datasets the direction most often observed was used to determine direction). (E) Curated cartoon of 380 meta-signature generated using IPA and IPA knowledge base.

References

    1. World Health Organization. World Health Organisation: Global tuberculosis report 2014. 2014.
    1. Blankley S, Berry MP, Graham CM, Bloom CI, Lipman M, O'Garra A. The application of transcriptional blood signatures to enhance our understanding of the host response to infection: the example of tuberculosis. Philosophical transactions of the Royal Society of London Series B, Biological sciences. 2014;369 20130427. - PMC - PubMed
    1. Bloom CI, Graham CM, Berry MP, et al. Transcriptional blood signatures distinguish pulmonary tuberculosis, pulmonary sarcoidosis, pneumonias and lung cancers. PloS one. 2013;8:e70630. - PMC - PubMed
    1. Kaforou M, Wright VJ, Oni T, et al. Detection of Tuberculosis in HIV-Infected and -Uninfected African Adults Using Whole Blood RNA Expression Signatures: A Case-Control Study. PLoS medicine. 2013;10:e1001538. - PMC - PubMed
    1. Joosten SA, Fletcher HA, Ottenhoff TH. A helicopter perspective on TB biomarkers: pathway and process based analysis of gene expression data provides new insight into TB pathogenesis. PloS one. 2013;8:e73230. - PMC - PubMed