. 2011 Jun 15;656(1-2):106-113.
doi: 10.1016/j.jelechem.2010.12.031.

Simultaneous real-time measurement of EEG/EMG and L-glutamate in mice: A biosensor study of neuronal activity during sleep

Affiliations

Simultaneous real-time measurement of EEG/EMG and L-glutamate in mice: A biosensor study of neuronal activity during sleep

Erik Naylor et al. J Electroanal Chem (Lausanne). .

Abstract

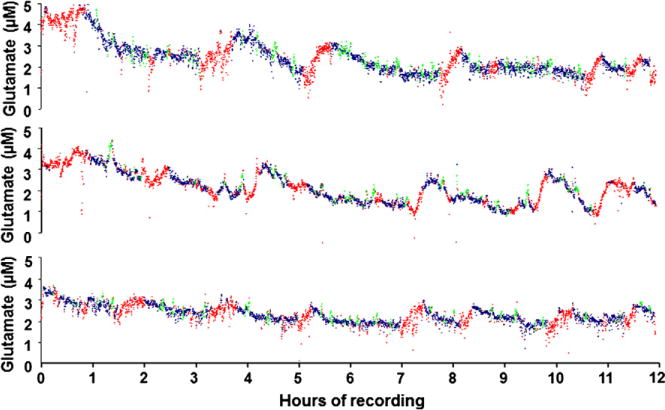
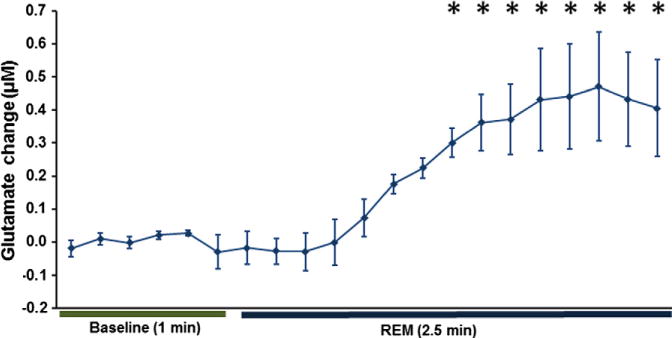
We report on electroencephalograph (EEG) and electromyograph (EMG) measurements concurrently with real-time changes in L-glutamate concentration. These data reveal a link between sleep state and extracellular neurotransmitter changes in a freely-moving (tethered) mouse. This study reveals, for the first time in mice, that the extracellular L-glutamate concentration in the pre-frontal cortex (PFC) increases during periods of extended wakefulness, decreases during extended sleep episodes and spikes during periods of REM sleep. Individual sleep epochs (10 s in duration) were scored as wake, slow-wave (SW) sleep or rapid eye movement (REM) sleep, and then correlated as a function of time with measured changes in L-glutamate concentrations. The observed L-glutamate levels show a statistically significant increase of 0.86 ± 0.26 μM (p < 0.05) over 37 wake episodes recorded from all mice (n = 6). Over the course of 49 measured sleep periods longer than 15 min, L-glutamate concentrations decline by a similar amount (0.88 ± 0.37 μM, p < 0.08). The analysis of 163 individual REM sleep episodes greater than one min in length across all mice (n = 6) demonstrates a significant rise in L-glutamate levels as compared to the 1 min preceding REM sleep onset (RM-ANOVA, DF = 20, F = 6.458, p < 0.001). The observed rapid changes in L-glutamate concentration during REM sleep last only between 1 and 3 min. The approach described can also be extended to other regions of the brain which are hypothesized to play a role in sleep. This study highlights the importance of obtaining simultaneous measurements of neurotransmitter levels in conjunction with sleep markers to help elucidate the underlying physiological and ultimately the genetic components of sleep.

Keywords: Continuous in vivo monitoring; Electroencephalography; Electromyography; Glutamate biosensor; Mouse sleep studies.


Figures

Fig. 1
Fig. 1
Diagrammatic representation of the EEG–EMG-biosensor surgery protocol carried out in this study. For this series, the active component in the diagram is illustrated in blue. Fig. 1a – depiction of the mouse skull after the skin was been retracted and connective tissue was removed revealing bregma, the traditional point of origin for stereotaxic coordinates. Fig. 1b – depiction of the three screws used as EEG recording electrodes. Screws for EEG-1 and EEG-2 were placed at A/P: −3.0 mm, M/L +1.5 mm and A/P: −1.0 mm, M/L +1.5 mm, respectively, while the EEG COMMON screw was located at A/P: −3.0 mm, M/L −1.5 mm. Fig. 1c – stereotaxic (measured) placement of a guide cannula at A/P: +1.94 mm, M/L −1.50 mm, D/V −0.5 mm. Fig. 1d – all items were secured in place with dental acrylic resin (blue). Fig. 1e – the connector wires for the three EEG electrodes were separately routed up through the dental acrylic resin and then soldered to the pre-fabricated headmount while Pt–Ir EMG electrodes (pre-connected to the headmount) are inserted in the nuchal (neck) muscle tissue. Fig. 1f – additional dental acrylic resin was added to the headmount and guide cannula to secure the entire assembly to the skull. (For interpretation of the references to colour in this figure legend, the reader is referred to the web version of this article.)
Fig. 2
Fig. 2
A working schematic of the L-glutamate biosensor, including biosensor dimensions. L-glutamate, in the presence of water and oxygen, is converted (Box 1) into H2O2, NH3 and oxoglutaric acid by L-glutamate oxidase (EC 1.4.3.11). The enzymatically-produced H2O2 diffuses through the selective membrane (Box 2) to the Pt–Ir surface where it is oxidized at a potential of 0.6 V vs. Ag/AgCl (Box 3). L-Ascorbate and other electroactive interferents are excluded from the Pt–Ir surface by two mechanisms: (1) L-ascorbate oxidase (EC 1.10.3.3), in the presence of oxygen, actively removes L-ascorbate (Box 4) by conversion to dehydroascorbate and water (neither of which are electroactive at 0.6 V vs. Ag/AgCl), and (2) remaining L-ascorbate (Box 5) and other endogenous electroactive interferents are further excluded by an inner-selective membrane. While it is not possible to eliminate 100% of the electroactive interferents (Box 6), the inner-membrane and active removal of L-ascorbate effectively limit the amount of interferent that reaches the electrode surface such that any changes in the local concentration are insignificant and do not contribute to the observed current.
Fig. 3
Fig. 3
A representative in vitro L-glutamate biosensor pre-calibration titration graph. The biosensor was placed in a jacketed beaker previously charged with 20 ml of 100 mM PBS at ambient temperature. Stepwise titration of 10 μM L-glutamate (indicated by blue arrows) was added to the rapidly stirred PBS solution. Typically, the effectiveness of the L-ascorbate oxidase and interference membranes was assessed via a single 250 μM injection of L-ascorbic acid (red arrow). The changes in current as a function of L-glutamate concentration followed a linear pattern over a range up to 40 μM (inset graphic). The rejection ratio of L-ascorbic acid of this representative biosensor prior to implantation is over 150:1 (manufacturer specification) and is improved over the 50:1 reported elsewhere.6 (For interpretation of the references to colour in this figure legend, the reader is referred to the web version of this article.)
Fig. 4a
Fig. 4a
Representative waveforms for each of the three stages of mouse sleep. Wake epochs are characterized by high amplitude EMG activity coupled with high frequency (>12 Hz) low amplitude EEG activity. SW sleep epochs are characterized by high amplitude (>100 μV), low frequency (<5 Hz) EEG activity, paired with a low amplitude EMG trace. REM sleep epochs are characterized by an abundance of 5–8 Hz frequencies (theta) in the EEG traces, whose amplitudes are <100 μV, and are coupled with a tonic EMG signal. Scoring of discrete epochs has historically been accomplished by visual recognition of these frequency and amplitude changes by a trained human scorer. Individual epochs are joined together to constitute episodes of wake, SW sleep and REM sleep. While wake and SW sleep episodes can be >15 min in length, REM sleep episodes are typically less than 3 min in duration.
Fig. 4b
Fig. 4b
Expanded view of a 10 s. SW and REM sleep EEG epoch. SW sleep epochs are visually determined to contain a majority of 1–4 Hz waveform activity and a significantly larger amplitude component than either wake or REM sleep epochs. By contrast, REM sleep epochs are visually inspected for a predominance of 5–8 Hz activity and an amplitude that visually corresponds to that of wake epochs.
Fig. 5
Fig. 5
Changes in L-glutamate concentration measured concurrently with sleep state. Graphs represent three of the six mice used in this study and reflect the composite EEG/EMG/L-glutamate concentrations measured over a 12 h time period during lights-on. Individual points represent 10 s epochs with colour coding to indicate the scored sleep/wake state (Red = wake, Blue = SW sleep, Green = REM sleep). The relative changes in L-glutamate concentration on the y-axis are based on individual post-calibration values represented and do not denote absolute L-glutamate concentrations. Note that the green periods indicative of REM sleep events are shorter in duration than the wake or SW sleep episodes. (For interpretation of the references to colour in this figure legend, the reader is referred to the web version of this article.)
Fig. 6
Fig. 6
Average change in L-glutamate concentration for all wake and sleep episodes greater than 15 min in duration. Wake episodes were globally classified as periods of at least 15 min in length where no more than five continuous minutes of SW sleep was present. A wake episode was considered terminated when five or more continuous minutes of sleep (SW or REM sleep) was observed. Sleep episodes were globally classified as at least 15 min of continuous sleep with both SW and REM sleep epochs contributing as part of the same sleep episode. A sleep episode was considered terminated when five or more continuous minutes of wake activity was observed. Bars represent SEM ** = p < 0.005.
Fig. 7
Fig. 7
Increase in mean L-glutamate level during REM sleep episodes (163 total, n = 6 mice). For REM sleep periods lasting longer than 1 min, a baseline was established by averaging L-glutamate concentrations for the minute immediately prior to the onset of the REM sleep episode. The baseline was then subtracted from the L-glutamate concentration during each epoch of the REM sleep episode. Bars represent SEM, * = p < 0.05, Fisher’s posthoc analysis RM-ANOVA, DF = 20, F = 6.458.

References

    1. Dement WC. History of sleep physiology and medicine. In: Kryger MH, Roth T, Dement WC, editors. Principles and Practices of Sleep Medicine. fourth. W.B. Saunders Company; Philadelphia: 2005. pp. 1–12.
    1. Zepelin H, Siegel JM, Tobler I. Mammalian sleep. In: Kryger MH, Roth T, Dement WC, editors. Principles and Practices of Sleep Medicine. fourth. W.B. Saunders Company; Philadelphia: 2005. pp. 91–100.
    1. Steriade M. Brain electrical activity and sensory processing during waking and sleep states. In: Kryger MH, Roth T, Dement WC, editors. Principles and Practices of Sleep Medicine. fourth. W.B. Saunders Company; Philadelphia: 2005. pp. 91–100.
    1. Carskadon MA, Dement WC. Normal human sleep: an overview. In: Kryger MH, Roth T, Dement WC, editors. Principles and Practices of Sleep Medicine. W.B. Saunders; Philadelphia: 1994. pp. 889–913.
    1. John J, Ramanathan L, Siegel JM. Am J Physiol Regul Integr Comp Physiol. 2008;295(6):R2041–R2049. - PMC - PubMed

LinkOut - more resources