

Optimization of digital droplet polymerase chain reaction for quantification of genetically modified organisms
- PMID: 27077048
- PMCID: PMC4827695
- DOI: 10.1016/j.bdq.2015.12.003
Optimization of digital droplet polymerase chain reaction for quantification of genetically modified organisms
Abstract
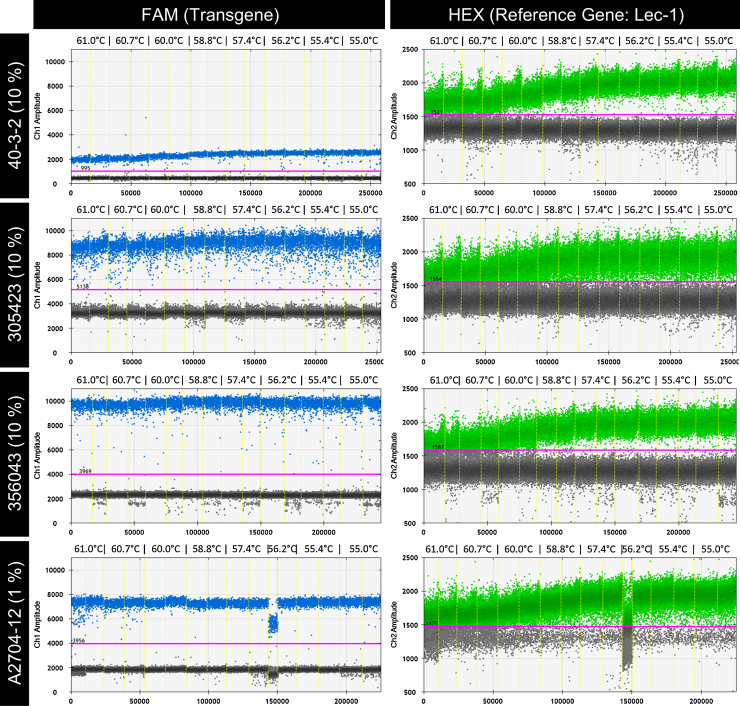
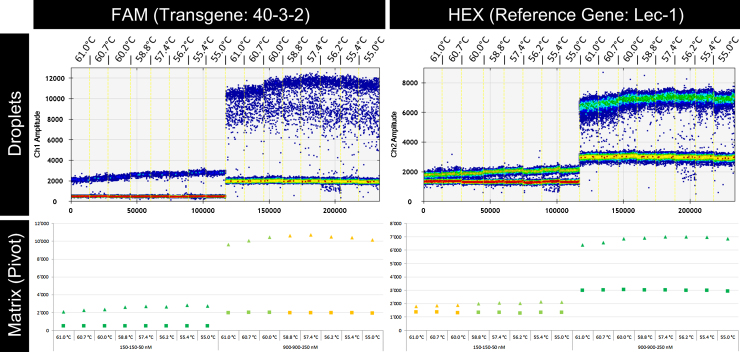
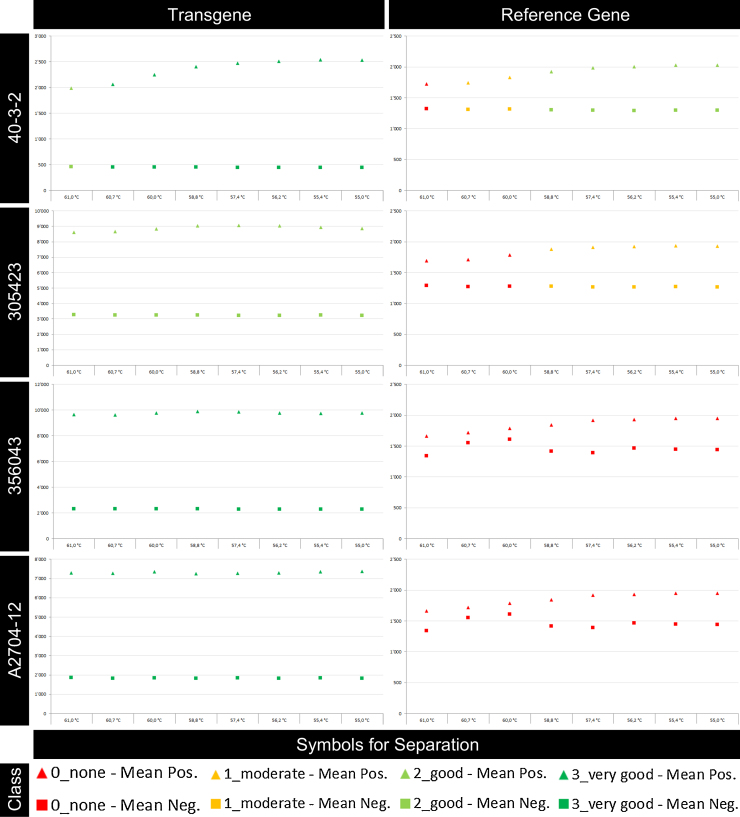
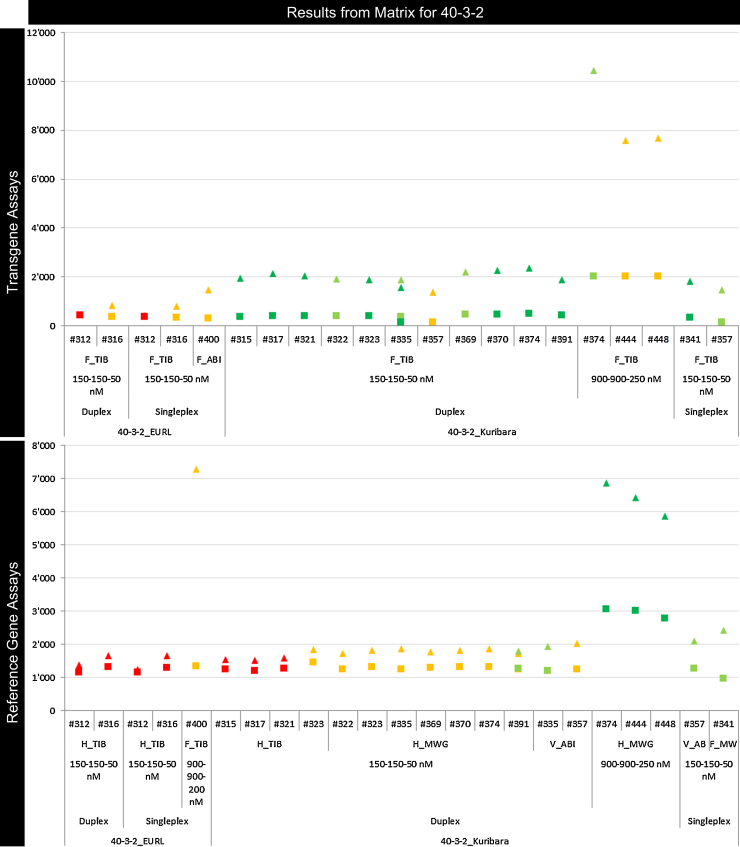
Digital PCR in droplets (ddPCR) is an emerging method for more and more applications in DNA (and RNA) analysis. Special requirements when establishing ddPCR for analysis of genetically modified organisms (GMO) in a laboratory include the choice between validated official qPCR methods and the optimization of these assays for a ddPCR format. Differentiation between droplets with positive reaction and negative droplets, that is setting of an appropriate threshold, can be crucial for a correct measurement. This holds true in particular when independent transgene and plant-specific reference gene copy numbers have to be combined to determine the content of GM material in a sample. Droplets which show fluorescent units ranging between those of explicit positive and negative droplets are called 'rain'. Signals of such droplets can hinder analysis and the correct setting of a threshold. In this manuscript, a computer-based algorithm has been carefully designed to evaluate assay performance and facilitate objective criteria for assay optimization. Optimized assays in return minimize the impact of rain on ddPCR analysis. We developed an Excel based 'experience matrix' that reflects the assay parameters of GMO ddPCR tests performed in our laboratory. Parameters considered include singleplex/duplex ddPCR, assay volume, thermal cycler, probe manufacturer, oligonucleotide concentration, annealing/elongation temperature, and a droplet separation evaluation. We additionally propose an objective droplet separation value which is based on both absolute fluorescence signal distance of positive and negative droplet populations and the variation within these droplet populations. The proposed performance classification in the experience matrix can be used for a rating of different assays for the same GMO target, thus enabling employment of the best suited assay parameters. Main optimization parameters include annealing/extension temperature and oligonucleotide concentrations. The droplet separation value allows for easy and reproducible assay performance evaluation. The combination of separation value with the experience matrix simplifies the choice of adequate assay parameters for a given GMO event.
Keywords: ABI, LifeTechnologies (formerly AppliedBiosystems); Bio, DNA Technology/Biosearch Technologies; Cat. No., catalogue number; DNA, deoxyribonucleic acid; Droplet digital PCR (ddPCR); EC, European Commission; ERM, Certified European Reference Material; EU, European Union; EURL-GMFF, European Reference Laboratory for GM Food and Feed; Experience matrix; Food/feed analysis; GM, genetically modified; GMO, genetically modified organism; Genetically modified organism (GMO); HEX,H, hexachlorfluorescein; L, liter; Lec, lectin gene of soy; MIQE, minimal information for publication of quantitative digital PCR experiments; MRPL, minimum required performance limit; MS, Microsoft; MWG, Eurofins-MWG; MeanSignal, mean fluorescence signal value; PCR, polymerase chain reaction; Quantification; SD, standard deviation (of fluorescence signals); TAMRA,T, tetramethylrhodamin; TIB, TIB Molbiol; Tech, technician; VBA, visual basic for applications; VIC,V, fluorescent dye (LifeTechnologies); cp/cp, (gene) copy per (gene) copy; dPCR, digital PCR; ddPCR, droplet digital PCR; fluorescein, FAM,F; gDNA, genomic DNA; qPCR, (quantitative) real-time PCR.
Figures


References
-
- Huggett J.F., Foy C.A., Benes V., Emslie K., Garson J.A., Haynes R., Hellemans J., Kubista M., Mueller R.D., Nolan T. The digital MIQE guidelines: minimum information for publication of quantitative digital PCR experiments. Clin. Chem. 2013;59(6):892–902. - PubMed
-
- Dreo T., Pirc M., Ramsak Z., Pavsic J., Milavec M., Zel J., Gruden K. Optimising droplet digital PCR analysis approaches for detection and quantification of bacteria: a case study of fire blight and potato brown rot. Anal. Bioanal. Chem. 2014;406(26):6513–6528. - PubMed
LinkOut - more resources
Full Text Sources
Other Literature Sources
Miscellaneous