. 2016 Apr 14;12(4):e1005985.
doi: 10.1371/journal.pgen.1005985. eCollection 2016 Apr.

Intermittent Stem Cell Cycling Balances Self-Renewal and Senescence of the C. elegans Germ Line

Affiliations

Intermittent Stem Cell Cycling Balances Self-Renewal and Senescence of the C. elegans Germ Line

Amanda Cinquin et al. PLoS Genet. .

Abstract

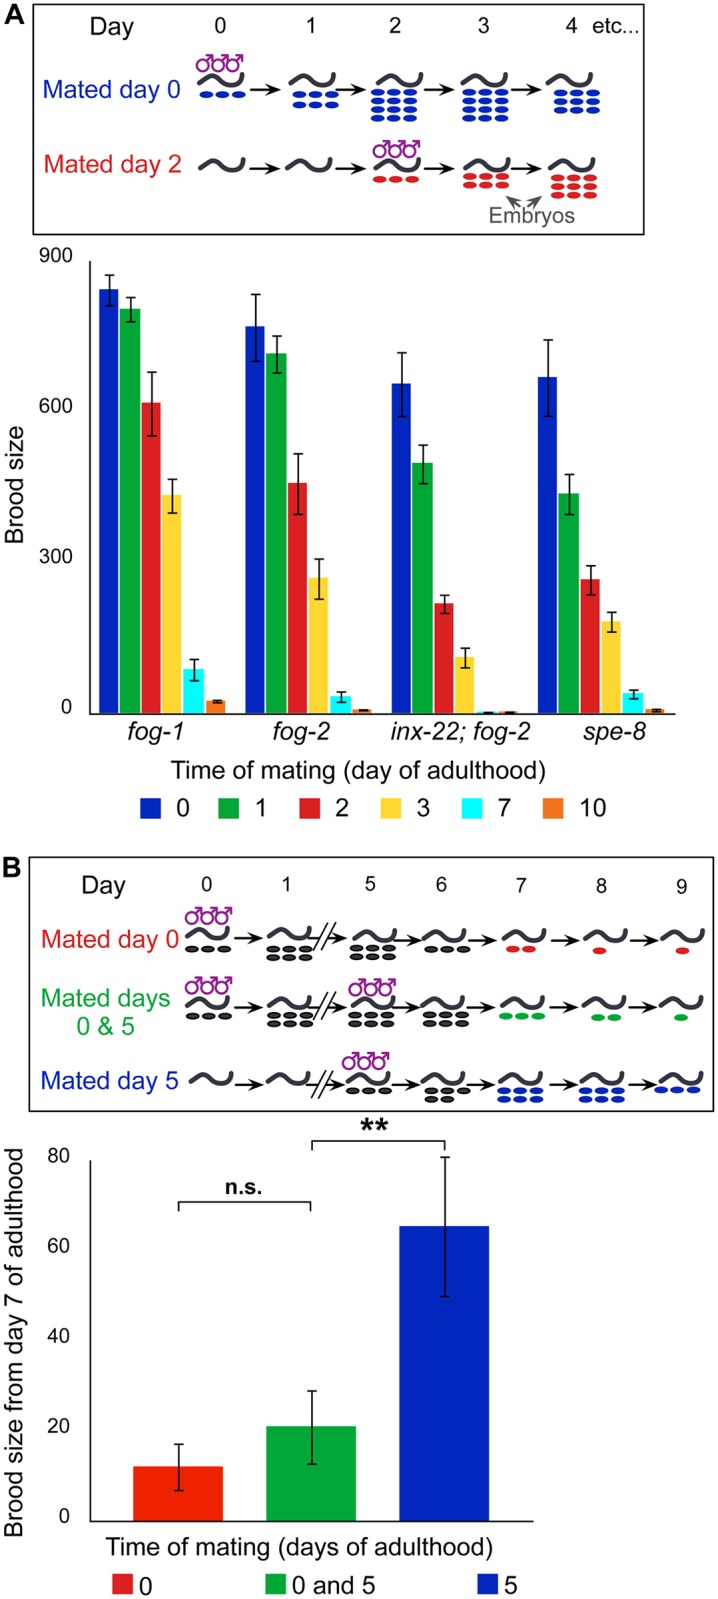
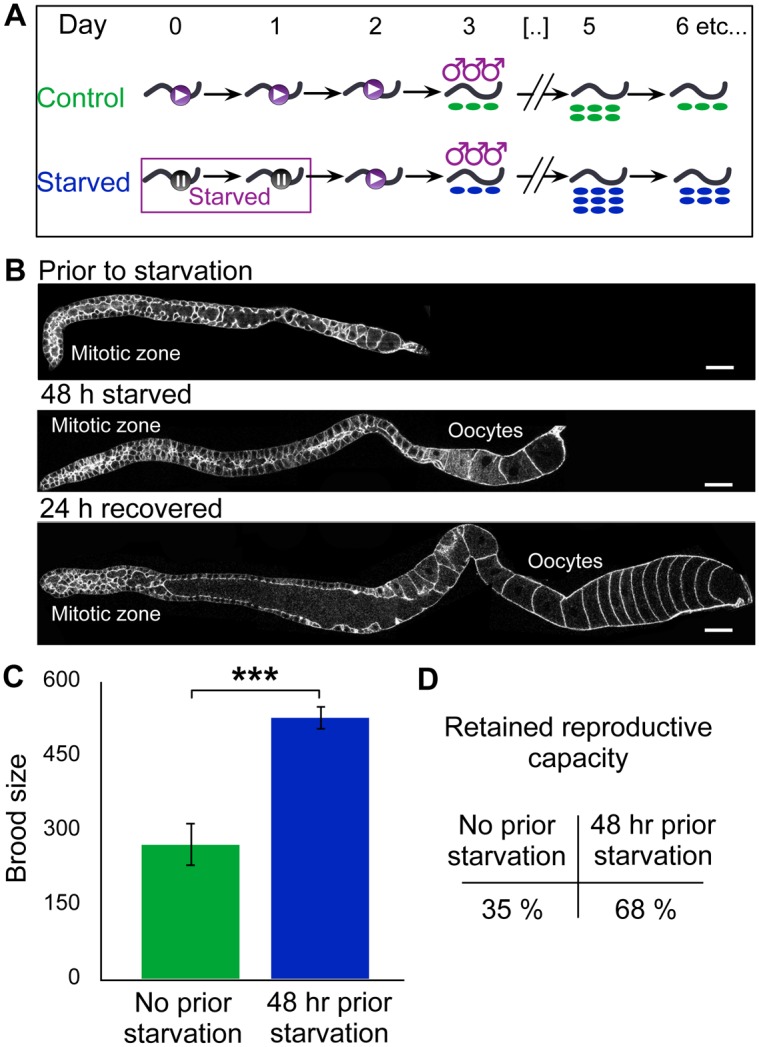
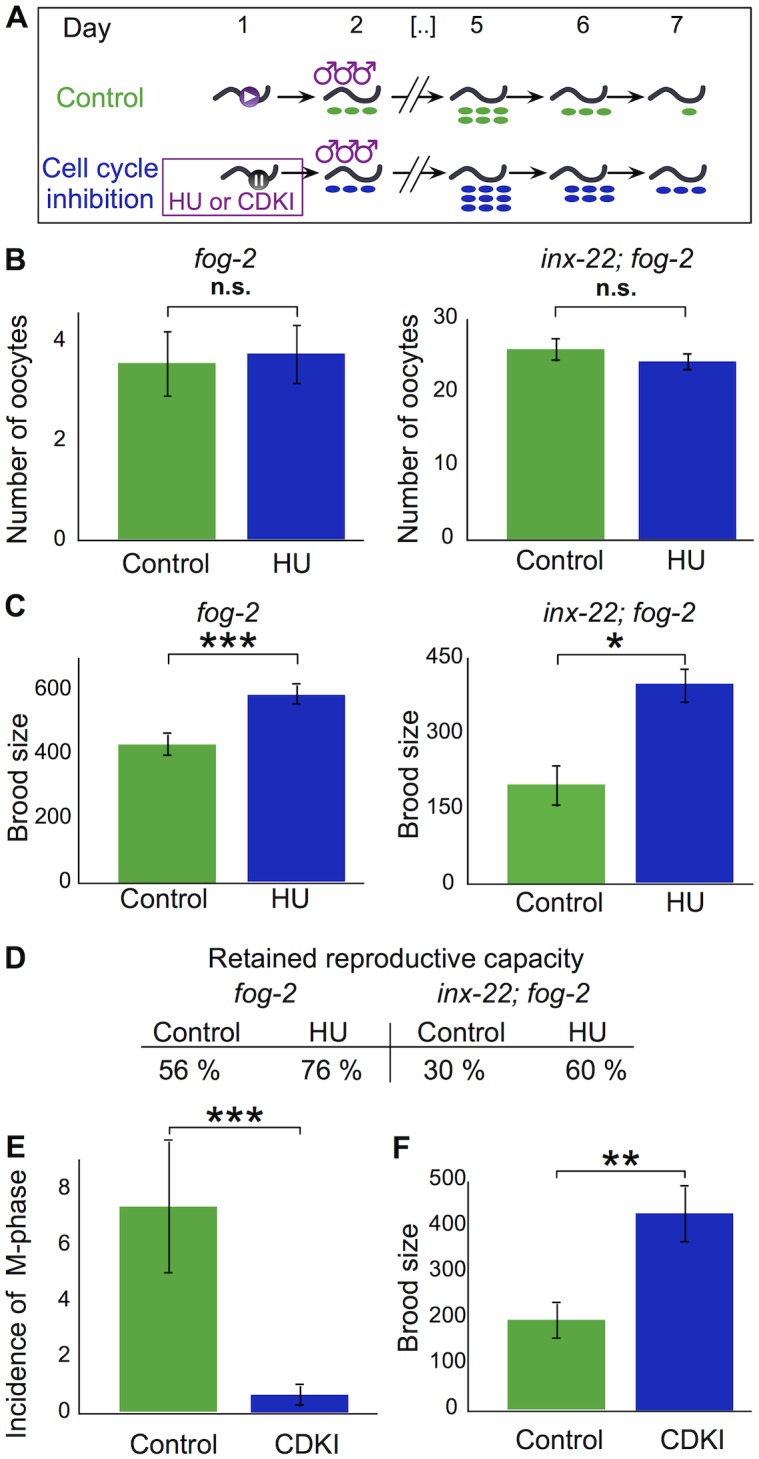
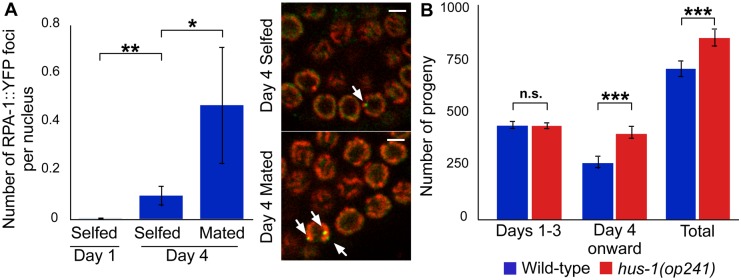
Self-renewing organs often experience a decline in function in the course of aging. It is unclear whether chronological age or external factors control this decline, or whether it is driven by stem cell self-renewal-for example, because cycling cells exhaust their replicative capacity and become senescent. Here we assay the relationship between stem cell cycling and senescence in the Caenorhabditis elegans reproductive system, defining this senescence as the progressive decline in "reproductive capacity," i.e. in the number of progeny that can be produced until cessation of reproduction. We show that stem cell cycling diminishes remaining reproductive capacity, at least in part through the DNA damage response. Paradoxically, gonads kept under conditions that preclude reproduction keep cycling and producing cells that undergo apoptosis or are laid as unfertilized gametes, thus squandering reproductive capacity. We show that continued activity is in fact beneficial inasmuch as gonads that are active when reproduction is initiated have more sustained early progeny production. Intriguingly, continued cycling is intermittent-gonads switch between active and dormant states-and in all likelihood stochastic. Other organs face tradeoffs whereby stem cell cycling has the beneficial effect of providing freshly-differentiated cells and the detrimental effect of increasing the likelihood of cancer or senescence; stochastic stem cell cycling may allow for a subset of cells to preserve proliferative potential in old age, which may implement a strategy to deal with uncertainty as to the total amount of proliferation to be undergone over an organism's lifespan.


Conflict of interest statement

The authors have declared that no competing interests exist.

Figures

Fig 1
Fig 1. Reproductive senescence rates correlate with gonad activity.
(A) Schematic of reproductive senescence assay, and brood sizes of females of various genotypes mated at increasing ages (n = 15–40 mothers for each genotype and time point). (B) Schematic of late reproductive activity assay, and brood sizes from day 7 for females mated at the onset of adulthood (day 0), on day 5 of adulthood, or both. For statistical tests see S1C Table. Error bars represent 83% confidence intervals; asterisks indicate significance of Wilcoxon rank sum test p-value.
Fig 2
Fig 2. Starvation delays reproductive senescence.
(A) Schematic of starvation experiment. (B) Phalloidin-stained fog-2 gonads before and after starvation. Scale bar: 25 μm. (C) Total brood size for fog-2 females mated after 2 days of starvation or control treatment. For statistical tests see S2C Table. (D) Reproductive capacity retained by fog-2 females after 2-day starvation or control treatment (computed by dividing numbers used in C by reproductive capacity at day 0). Error bars represent 83% confidence intervals; asterisks indicate significance of Wilcoxon rank sum test p-value.
Fig 3
Fig 3. Stem cell cycling drives reproductive senescence.
(A) Schematic of cell cycle inhibitor experiments. (B) Total number of oocytes produced by fog-2 or inx-22; fog-2 females during the HU treatment window. For statistical tests see S3A Table. (C) Brood size for fog-2 or inx-22; fog-2 females mated after the HU treatment window. For statistical tests see S3B Table. (D) Reproductive capacity retained by fog-2 or inx-22; fog-2 females after HU or control treatment (computed by dividing numbers used in C by reproductive capacity at day 0). (E) Incidence of cells in M-phase following 24 h treatment with CDK inhibitor Roscovitine or control treatment with DMSO only. For statistical tests see S3D Table. (F) Brood size for fog-2 females mated after the Roscovitine treatment window. For statistical tests see S3E Table. Error bars represent 83% confidence intervals; asterisks indicate significance of Wilcoxon rank sum test p-value.
Fig 4
Fig 4. DDR increases with past reproductive activity and curtails reproductive capacity.
(A) Average number of RPA-1::YFP foci per nucleus in late pachytene. Image panels show example RPA-1 foci (arrows; YFP: green; DNA: red). Scale bars: 2.5 μm. For statistical tests see S4A Table. (B) Total brood size is larger for mated hus-1(op241) (red bar) than for mated wild-type (blue bar). For statistical tests see S4B Table. Error bars represent 83% confidence intervals; asterisks indicate significance of Wilcoxon rank sum test p‑value. To test whether the DDR curtails reproductive activity, we utilized the hus-1 reduction of function allele op241. This mutation abrogates multiple forms of DDR [30] but preserves normal reproductive activity in selfed worms [31]. Mated hus-1(op241) hermaphrodites had a significantly larger brood size than wild-type controls (S4B Table and Fig 4B); the reproductive schedule was almost identical between days 1 and 3, but from day 4 onward op241 had a ~1.5-fold greater number of progeny. This shows that the DDR hastens reproductive senescence, by a mechanism that remains to be identified.
Fig 5
Fig 5. Mitotic zones in gonads with reduced reproductive activity intermittently occupy a dormant state.
(A) Representative z-projection images of continuous EdU labeling of wild-type and fog-1 (DNA: red; EdU: green). “Dormant” mitotic zones are defined by the absence of any EdU positive cell, and are marked with an asterisk. Almost all wild-type mitotic zones show activity within 1 h of continuous labeling, whereas fog-1 mitotic zones take in excess of 6 h to all have experienced activity. (B) Fractions of day 1 mitotic zones remaining unlabeled as a function of time on EdU-labeled food (n = 40–82 for each genotype and time point).
Fig 6
Fig 6. Slower average cell cycle progression and loss of synchrony in gonads with reduced reproductive activity.
(A, B) Principle of EdU pulse chase analysis. Three fictitious mitotic zones cycle steadily (A) or stochastically enter a dormant state (B; play and pause symbols within the squares). The position of each square on the circle represents mitotic zone cell cycle progression (progression from time of labeling highlighted by a colored band). A full revolution on the circle corresponds to all cells in the mitotic zone having undergone a full cycle. The red wedge in the bottom row shows average cycle progression (angle shown by red arrows) and the amount of dispersion between mitotic zones (width of the wedge, set to the inverse of the magnitude of the resultant computed as the vector sum of individual gonad positions). (C) Analysis of cell cycle progression after EdU pulse-chase. Mitotic zones from virgin females or old wild-type hermaphrodites lose synchrony at later chase times, as shown e.g. by wider wedges (virgin fog-2 data is repeated in rows 2 and 3 to facilitate comparisons). See also S5 Fig, S5 Table, S1 Movie, S1 Dataset and S1 Text.
Fig 7
Fig 7. Variability of remaining reproductive capacity in aging populations.
(A) According to a model by which gonads switch stochastically between dormant and active states, and according to which activity leads to progressive loss of reproductive capacity, there may be an increase with age in the population-level spread of remaining reproductive capacity. Color coding for worms is based on remaining reproductive capacity (lookup table on right). (B) Schematic of experiments used to measure reproductive capacity CV. (C) Reproductively-inactive female populations undergo an increase in reproductive capacity CV. Error bars represent 99% confidence intervals; for details see S6 Table).
Fig 8
Fig 8. Population density influences intermittent cycling in a dauer pheromone dependent fashion.
(A) Brood size of fog-1 females that had been kept at low or high density, and then mated at day 4 of adulthood (for statistical tests see S7A Table). Error bars represent 83% confidence intervals. Asterisks indicate significance of Wilcoxon rank sum test p‑value. (B) The percentage of mitotic zones that were in the dormant phase during a 1 h EdU labeling period at either day 1 of adulthood (fog-1) or day 3 of adulthood (wild-type and daf-22) for worms that had been kept at low or high density. For statistical tests see S7B–S7D Table. Asterisks indicate significance of Fisher’s exact test p-value.
Fig 9
Fig 9. Suboptimal kinetics of response to mating in genotypes and environmental conditions with high gonad dormancy.
Early female response to mating on day 3 of adulthood, as assayed by numbers of viable progeny laid per hour. Each point is computed from the number of progeny of one worm over a time window ending at corresponding position on x axis (n = 40 worms per genotype tracked over the time course; some points in the graph overlap). Red lines are moving averages. Error bars represent 83% confidence intervals; asterisks indicate significance of Wilcoxon rank sum test p-value.

References

    1. Klass M, Hirsh D. Non-ageing developmental variant of Caenorhabditis elegans. Nature. 1976;260: 523–525. - PubMed
    1. Hughes SE, Evason K, Xiong C, Kornfeld K. Genetic and pharmacological factors that influence reproductive aging in nematodes. PLoS Genet. 2007;3: e25 - PMC - PubMed
    1. Luo S, Kleemann GA, Ashraf JM, Shaw WM, Murphy CT. TGF-β and Insulin Signaling Regulate Reproductive Aging via Oocyte and Germline Quality Maintenance. Cell. 2010;143: 299–312. 10.1016/j.cell.2010.09.013 - DOI - PMC - PubMed
    1. Mendenhall AR, Wu D, Park S-K, Cypser JR, Tedesco PM, Link CD, et al. Genetic dissection of late-life fertility in Caenorhabditis elegans. J Gerontol A Biol Sci Med Sci. 2011;66: 842–854. 10.1093/gerona/glr089 - DOI - PMC - PubMed
    1. Hodgkin J, Barnes TM. More is not better: brood size and population growth in a self-fertilizing nematode. Philos Trans R Soc Lond B Biol Sci. 1991;246: 19–24. - PubMed

Publication types

MeSH terms