. 2016 Apr 14;11(4):e0152724.
doi: 10.1371/journal.pone.0152724. eCollection 2016.

Airway Microbiota in Severe Asthma and Relationship to Asthma Severity and Phenotypes

Affiliations

Airway Microbiota in Severe Asthma and Relationship to Asthma Severity and Phenotypes

Qingling Zhang et al. PLoS One. .

Abstract

Background: The lower airways harbor a community of bacterial species which is altered in asthma.

Objectives: We examined whether the lower airway microbiota were related to measures of asthma severity.

Methods: We prospectively recruited 26 severe asthma, 18 non-severe asthma and 12 healthy subjects. DNA was extracted from induced sputum and PCR amplification of the V3-V5 region of bacterial 16S rRNA gene was performed.

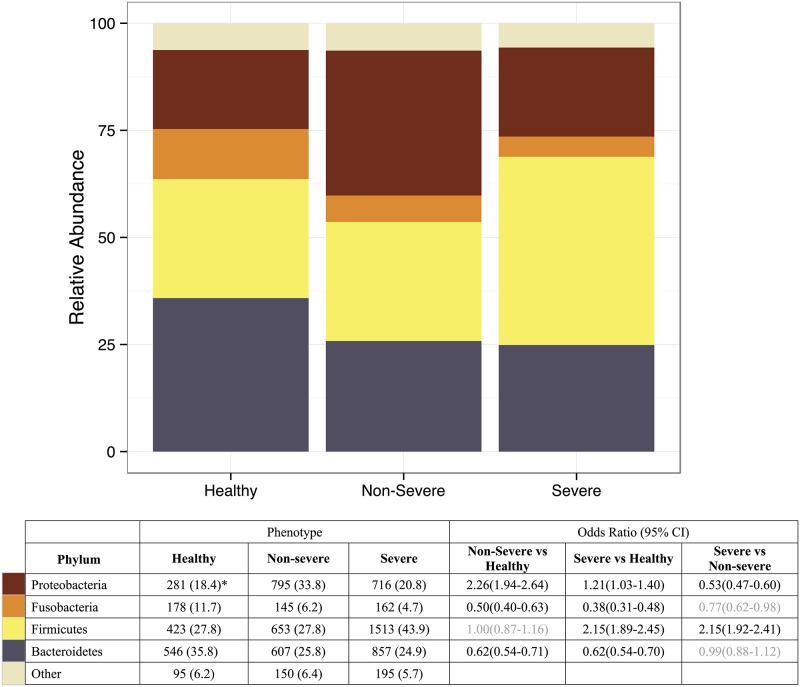
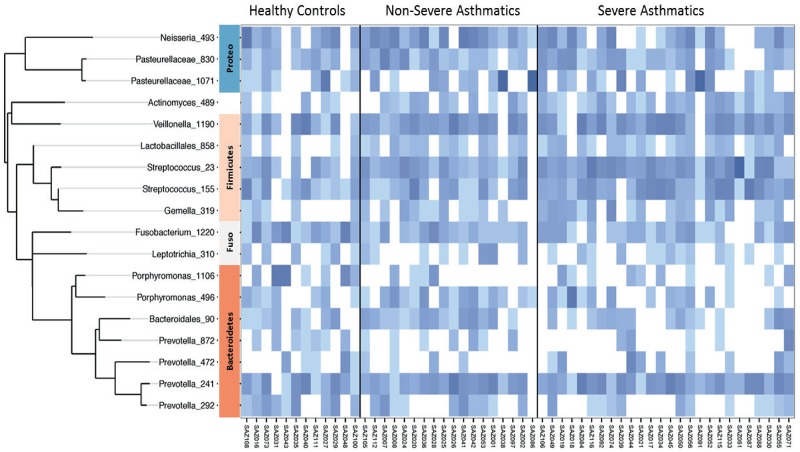
Results: We obtained 138,218 high quality sequences which were rarefied at 133 sequences/sample. Twenty OTUs had sequences ≥1% of total. There were marked differences in the distribution of Phyla between groups (P = 2.8x10-118). Bacteroidetes and Fusobacteria were reduced in non-severe and severe asthmatic groups. Proteobacteria were more common in non-severe asthmatics compared to controls (OR = 2.26; 95% CI = 1.94-2.64) and Firmicutes were increased in severe asthmatics compared to controls (OR = 2.15; 95%CI = 1.89-2.45). Streptococcal OTUs amongst the Firmicutes were associated with recent onset asthma, rhinosinusitis and sputum eosinophilia.

Conclusions: Sputum microbiota in severe asthma differs from healthy controls and non-severe asthmatics, and is characterized by the presence of Streptococcus spp with eosinophilia. Whether these organisms are causative for the pathophysiology of asthma remains to be determined.


Conflict of interest statement

Competing Interests: The authors have declared that no competing interests exist.

Figures

Fig 1
Fig 1. Distribution of bacterial Phyla in healthy controls and non-severe and severe asthmatics defined by sequencing of the 16S rRNA gene.
The distribution of bacterial phyla from 12 healthy subjects, 18 non-severe asthmatics and 26 severe asthmatics are shown. Compared to healthy controls, non-severe asthmatics showed a reduction in the prevalence of Bacteroidetes and Fusobacteria and an increase in Proteobacteria (all P<10−10). Severe asthmatics showed an increase in Firmicutes compared to controls and non-severe asthmatics, together with reduction in Bacteroidetes and Fusobacteria compared to controls (all P<10−10). The distribution of bacterial phyla is given in the accompanying lower Table as Operational Taxonomic Unit (OTU) counts with % total in brackets. The legend gives the odds ratios for each comparison. The overall χ2 for differences in phyla between phenotypic groups = 557.7 (P = 2.8x10-118). *OUT counts (% total).
Fig 2
Fig 2. Heat map of operational taxonomic units (OTUs) found in the sputum of asthmatics and non-asthmatic subjects.
The phylogenetic tree for the principal (>1% of total) OTUs is shown at the left. On the right, increasing depth of colour indicates relative abundance of the OTU in an individual sample. Major phyla are shown between the phylogenetic tree and the heat map. Proteo = Proteobacteria; Fuso = Fusobacteria.
Fig 3
Fig 3. Diversity of microbial communities in healthy, non-severe and severe asthmatics.
A. Boxplot of alpha diversity measures Species Richness and Shannon’s Diversity Index, which are not significantly different between groups. B Non metric multidimensional scaling of Bray Curtis distance split by group (stress 0.22). Here PERMANOVA (Adonis) indicates that community structure is significantly associated with asthma classification (P = 0.008) and this variable explains 6% of the variance.

References

    1. Chung KF. Defining phenotypes in asthma: a step towards personalized medicine. Drugs 2014; 74: 719–728. 10.1007/s40265-014-0213-9 - DOI - PubMed
    1. Moore WC, Meyers DA, Wenzel SE, Teague WG, Li H, Li X, et al. Identification of asthma phenotypes using cluster analysis in the Severe Asthma Research Program. Am J Respir Crit Care Med 2010; 181: 315–323. 10.1164/rccm.200906-0896OC - DOI - PMC - PubMed
    1. Chung KF, Wenzel SE, Brozek JL, Bush A, Castro M, Sterk PJ, et al. International ERS/ATS guidelines on definition, evaluation and treatment of severe asthma. Eur Respir J 2014; 43: 343–373. 10.1183/09031936.00202013 - DOI - PubMed
    1. Woodruff PG, Modrek B, Choy DF, Jia G, Abbas AR, Ellwanger A, et al. T-helper type 2-driven inflammation defines major subphenotypes of asthma. AmJRespir Crit Care Med 2009; 180: 388–395. - PMC - PubMed
    1. Peters MC, Mekonnen ZK, Yuan S, Bhakta NR, Woodruff PG, Fahy JV. Measures of gene expression in sputum cells can identify TH2-high and TH2-low subtypes of asthma. J Allergy Clin Immunol 2014; 133: 388–394. e385 10.1016/j.jaci.2013.07.036 - DOI - PMC - PubMed

Publication types

Substances