. 2016 May 24;10(5):5015-26.
doi: 10.1021/acsnano.5b07200. Epub 2016 May 10.

Imaging of Liver Tumors Using Surface-Enhanced Raman Scattering Nanoparticles

Affiliations

Imaging of Liver Tumors Using Surface-Enhanced Raman Scattering Nanoparticles

Chrysafis Andreou et al. ACS Nano. .

Abstract

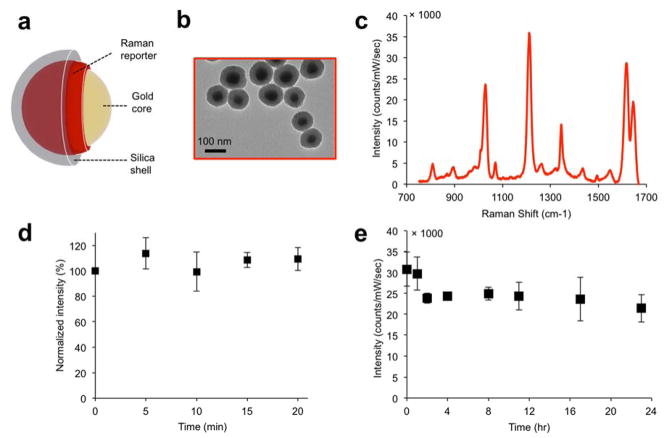
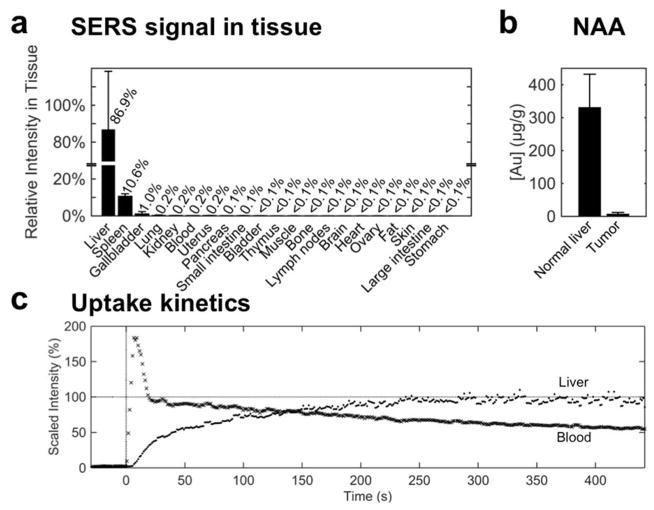
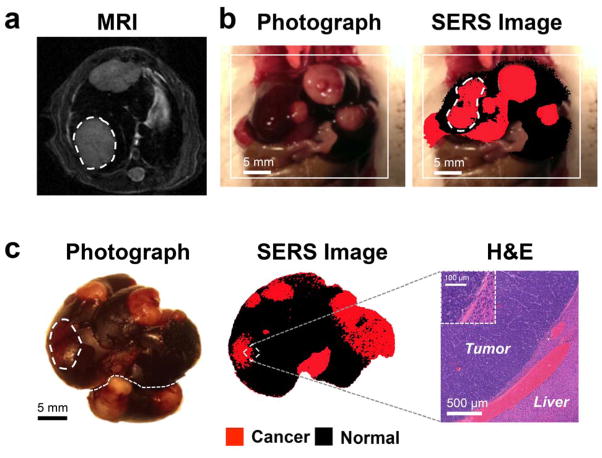
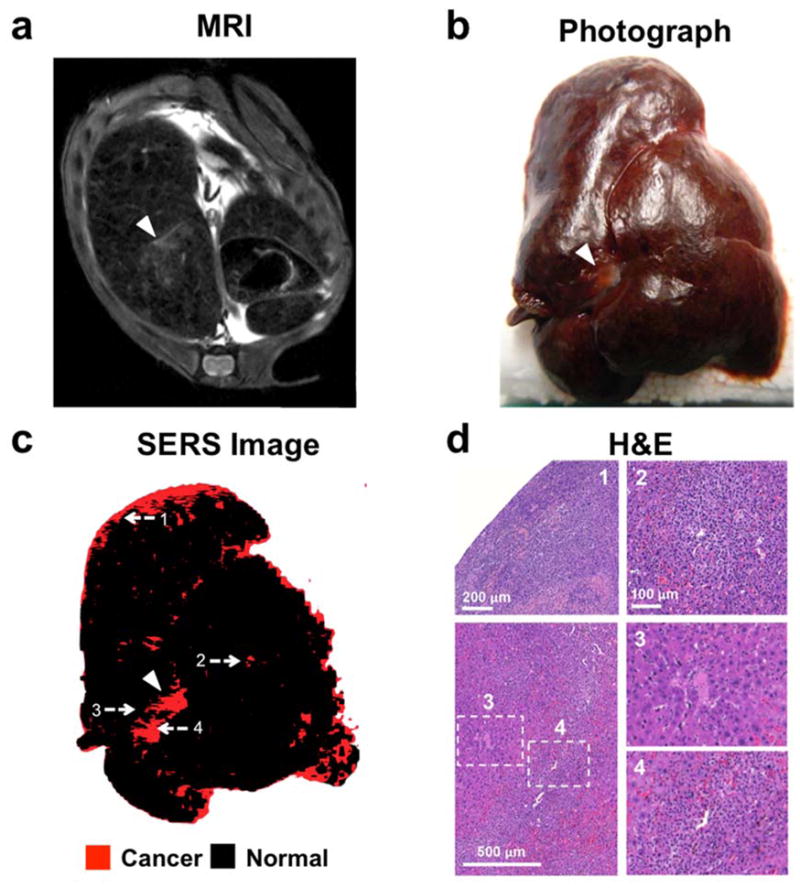
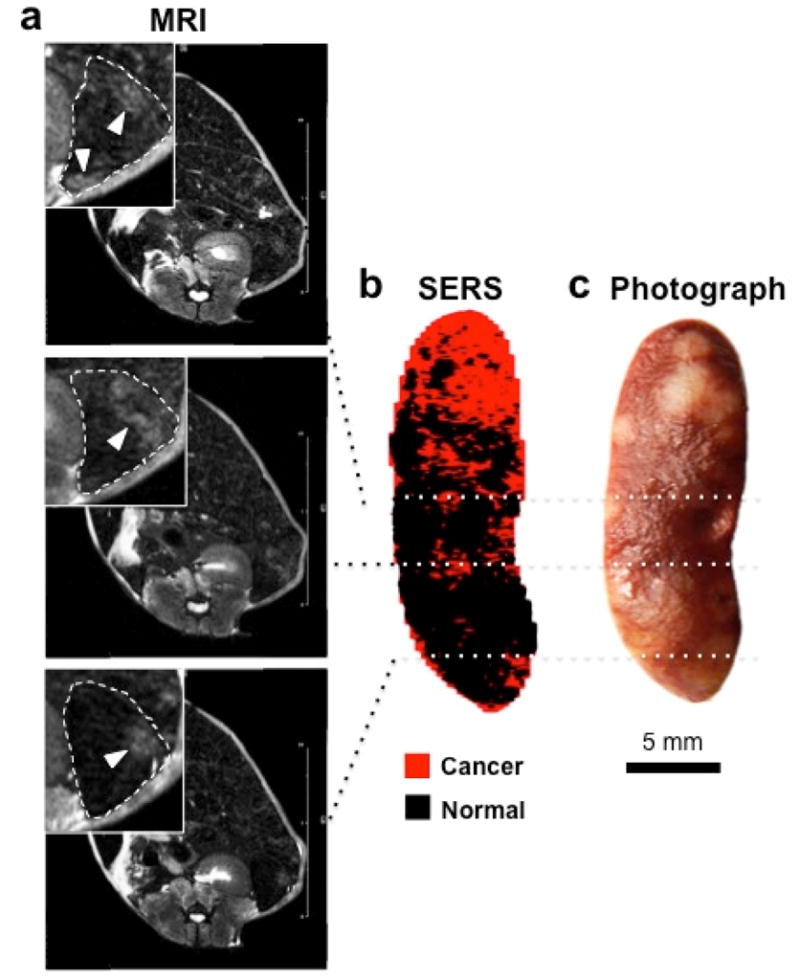
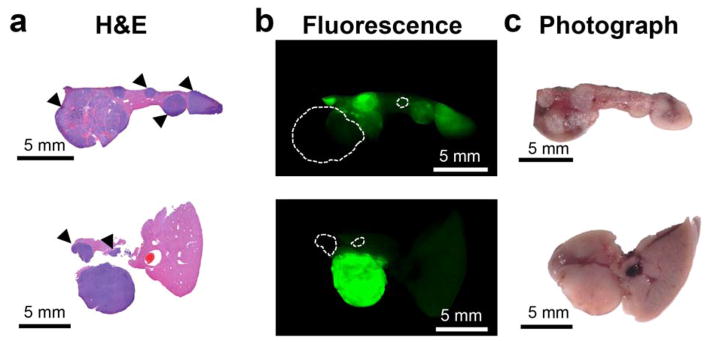
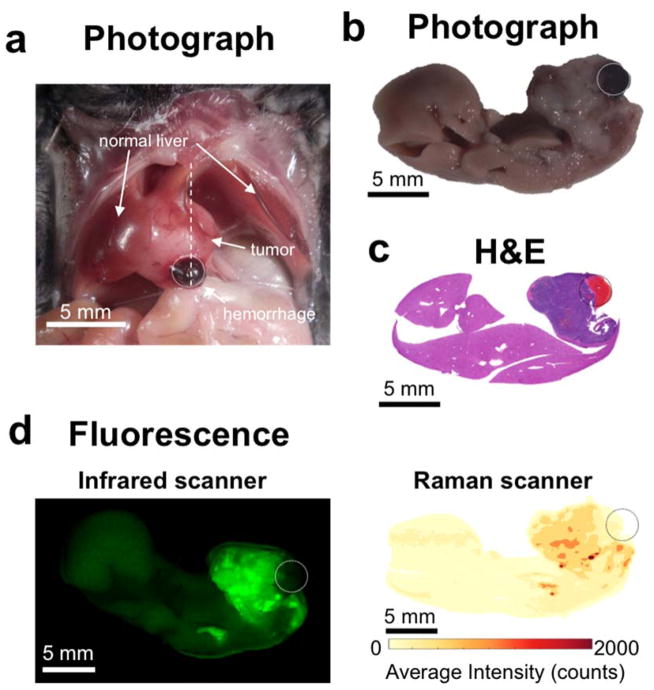
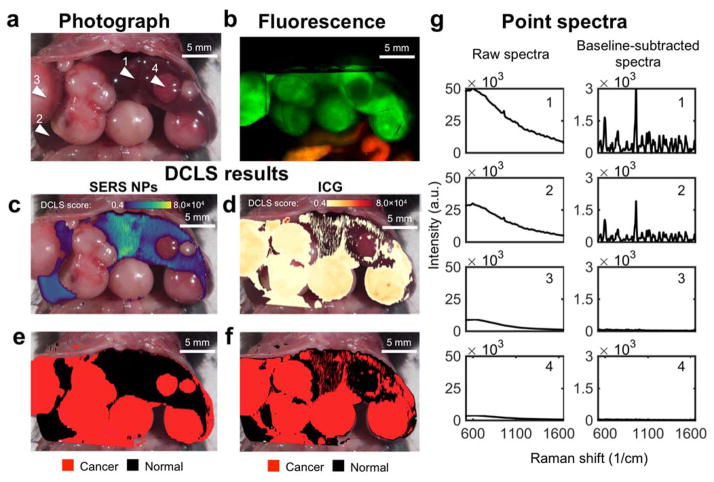
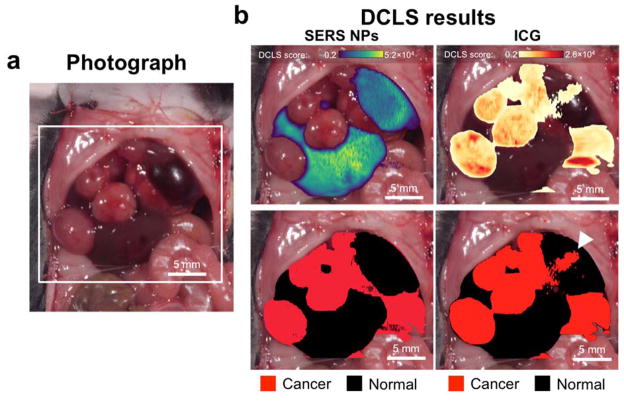
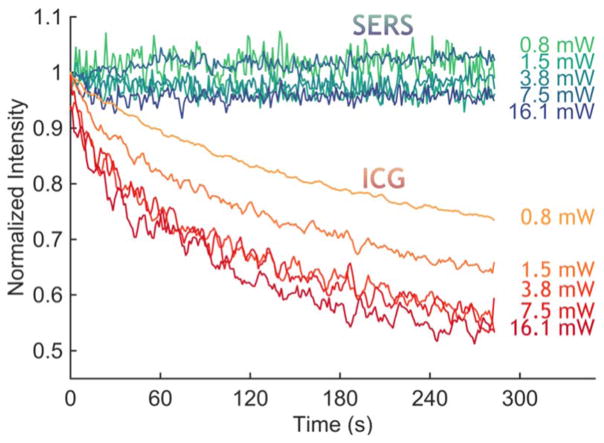
Complete surgical resection is the ideal first-line treatment for most liver malignancies. This goal would be facilitated by an intraoperative imaging method that enables more precise visualization of tumor margins and detection of otherwise invisible microscopic lesions. To this end, we synthesized silica-encapsulated surface-enhanced Raman scattering (SERS) nanoparticles (NPs) that act as a molecular imaging agent for liver malignancies. We hypothesized that, after intravenous administration, SERS NPs would avidly home to healthy liver tissue but not to intrahepatic malignancies. We tested these SERS NPs in genetically engineered mouse models of hepatocellular carcinoma and histiocytic sarcoma. After intravenous injection, liver tumors in both models were readily identifiable with Raman imaging. In addition, Raman imaging using SERS NPs enabled detection of microscopic lesions in liver and spleen. We compared the performance of SERS NPs to fluorescence imaging using indocyanine green (ICG). We found that SERS NPs delineate tumors more accurately and are less susceptible to photobleaching. Given the known advantages of SERS imaging, namely, high sensitivity and specific spectroscopic detection, these findings hold promise for improved resection of liver cancer.

Keywords: hepatocellular carcinoma; image-guided tumor resection; intraoperative imaging; nanoparticles; sarcoma; surface-enhanced Raman scattering.


Figures

Figure 1
Figure 1. SERS NP characterization
(a) Illustration and (b) transmission electron micrographs of the SERS NPs. (c) the SERS spectrum of the NPs depends on the Raman reporter molecule used (here, trans-1,2-bis(4-pyridyl)-ethylene (BPE)). (d) Signal stability (based on the intensity of the 1215 cm−1 band) of SERS NPs suspension under continuous laser irradiation (785 nm; 50 mW/cm2). (e) Signal stability of SERS NPs incubated in 50% mouse serum (v/v) over a 24 hour period.
Figure 2
Figure 2. Biodistribution and uptake of SERS NPs
(a) Signal intensity of spectra collected from tissue homogenates of healthy mice (C57BL/6, n=2), 18 hours after IV administration of SERS NPs. After adjusting for tissue weight, 99% of the SERS signal—signifying the presence of SERS NPs—was detected in the liver, spleen, and gallbladder. (b) Neutron activation analysis of liver vs. tumor tissue from the Myc-driven HCC mouse model (n=3) quantifies the gold content (core of the SERS NPs). This corroborates that the SERS NPs home predominantly into healthy liver tissue, and much less into tumor tissue. (c) Uptake kinetics of SERS NPs were established by monitoring the Raman intensity over time in the liver (·) and the abdominal aorta (x) beginning with a SERS NP bolus injection at t=0 s. The signal intensity (of the characteristic 960 cm−1 peak) is plotted, normalized by the final intensity in the liver. The SERS NPs are taken up by the liver with a time constant τ=77 s.
Figure 3
Figure 3. SERS NPs enable delineation of liver tumors (Genetic Myc-driven HCC mouse model)
(a) T2-weighted axial MR images through the liver show hyperintense lesions corresponding to the tumors (one of them is outlined with a dashed line). (b) Photograph and in vivo SERS image (overlaid) shows the liver with several tumors in red (outlined tumor corresponds in location to the tumor outlined on MRI). (c) Photograph and corresponding SERS image of the excised liver, showing multiple liver tumors (red). Histology with H&E staining confirms the precise delineation of the liver tumor margin by SERS imaging. Inset: Magnified view of the tumor-liver margin. SERS images were produced using DCLS, as described in Methods.
Figure 4
Figure 4. SERS NPs enable detection of microscopic liver tumors (Histiosarcomas; genetic Ink4A/Arf−/− mouse model)w
(a) T2-weighted axial fast spin echo MR image through the liver shows several foci that are T2-hyperintense relative to the T2-hypointense liver background (largest focus indicated with arrowhead). (b) Photograph of the excised liver, showing a focus of abnormal gray color (arrowhead), corresponding to the T2-hyperintense focus identified by MRI. (c) SERS image of the excised liver, demonstrating a focus of abnormal Raman signal (arrowhead) corresponding in location to the abnormality on MRI and the photograph. Many additional smaller Raman foci (red) are present, which were not visible by MRI or upon visual inspection. (d) H&E images correlating to the numbered locations on the SERS image confirm that SERS NPs were able to correctly identify very small cancerous lesions (as in examples 1, 2 and 4) and correctly distinguish them from adjacent healthy liver tissue (example 3). SERS images were produced using DCLS, as described in Methods.
Figure 5
Figure 5. SERS NPs enable detection of small tumors in the spleen. (Histiosarcomas; genetic Ink4A/Arf−/− mouse model)
(a) T2-weighted axial fast spin echo MR images at different levels through the spleen show several lesions that are T2-hyperintense relative to the rest of the spleen. Insets are magnified views outlined by dashed boxes (dashed lines: outline of the spleen; arrowheads: T2-hyperintense lesions). (b) DCLS-derived SERS image of the excised spleen shows foci of abnormal Raman signal (red) that correspond to the T2-hyperintense foci on MRI. (c) White light photograph corroborated the presence of tumors (bright lesions) in these locations. SERS images were produced using DCLS, as described in Methods.
Figure 6
Figure 6. Histopatological validation of the ability of ICG to demarkate tumors. ICG fails to visualize certain tumors
(a) H&E-stained liver slices from two animals (genetic Myc-driven HCC mouse model) are shown. (b) Although most tumors retain ICG fluorescence in higher concentrations than normal liver tissue, the accumulation is heterogenous. Tumors marked with arrowheads in (a) present intensities less than two-fold over the healthy tissue, which would likely be problematic to detect with certainty in a clinical setting. Dashed circles in b indicate those tumors that are completely missed as they are essentially invisible on the ICG fluorescence image. (c) Photograph of the section prior to embedding.
Figure 7
Figure 7. ICG misses area of tumor-associated hemorrhage
(a) Photograph of the exposed mouse abdomen, showing a large tumor with an associated hematoma (circled). (b) Photograph, and (c) H&E staining of the excised liver, sliced along the dotted line in (a). (d) Left: scan with the infrared fluorescence scanner demonstrates that ICG can visualize the tumor, but not the hemorrhage. Right: in the absence of SERS NPs, the Raman spectrometer faithfully captures the fluorescence of ICG. The average intensity across all wavenumbers is plotted.
Figure 8
Figure 8. Comparison of SERS NPs vs. ICG after co-injection of both contrast agents into the same HCC bearing mice
(a) Photograph of the exposed abdomen, showing multiple HCCs. Arrowhead 1 and 2 = normal liver; arrowhead 3 and 4 = HCC. (b) In situ fluorescence scan. (c, d) DCLS analysis identifies the presence of SERS signal from the NPs (c), and the fluorescence from ICG (d). (e) Areas identified as positive for SERS NPs are denoted as normal liver (black). Areas of low intensity (no SERS nor fluorescence) are rendered transparent, and the remaining areas are denoted as tumor (red). (f) The areas identified as positive for ICG are denoted as cancer (red), and as in (e) the remaining areas are denoted as normal. (g) Representative spectra collected from points 1–4 indicated in (a). The raw spectra (left) are dominated by the fluorescence, whereas, after baseline subtraction (right), the Raman bands become prominent. Points 1 and 2 are from normal liver tissue, 3 and 4 from tumor. ICG falsely identifies a tumor (arrowhead 4) as normal liver tissue.
Figure 9
Figure 9. Comparison of SERS NPs vs. ICG as contrast agents in vivo
(a) Photograph of the exposed mouse abdomen, showing multiple HCCs. (b) The signal from the two contrast agents is decoupled using DCLS. The scores on the SERS spectrum of the NPs and the fluorescent dye are shown on the top (left and right, respectively). The scores are used as masks to generate maps identifying tumors (bottom). The two contrast agents have similar performance when demarcating the tumors. However, the ICG exhibits a false positive area indicated by the arrowhead.
Figure 10
Figure 10. Photostability comparsion between ICG and SERS NPs in ex vivo liver tissue
With continuous illumination, the 785 nm laser bleached the ICG fluorescence signal from an ex vivo liver sample, within minutes for all tested intensities, whereas the SERS signal, measured as the intensity of a specific peak (1215 cm−1), remained stable.

References

    1. Ishizawa T, Gumbs AA, Kokudo N, Gayet B. Laparoscopic Segmentectomy of the Liver: From Segment I to VIII. Ann Surg. 2012;256:959–964. - PubMed
    1. Kudo H, Ishizawa T, Tani K, Harada N, Ichida A, Shimizu A, Kaneko J, Aoki T, Sakamoto Y, Sugawara Y, Hasegawa K, Kokudo N. Visualization of Subcapsular Hepatic Malignancy by Indocyanine-Green Fluorescence Imaging During Laparoscopic Hepatectomy. Surg Endosc. 2014;28:2504–2508. - PubMed
    1. Bonanni L, De’liguori Carino N, Deshpande R, Ammori BJ, Sherlock DJ, Valle JW, Tam E, O’Reilly DA. A Comparison of Diagnostic Imaging Modalities for Colorectal Liver Metastases. Eur J Surg Oncol. 2014;40:545–550. - PubMed
    1. Grimm J, Kircher MF, Weissleder R. Cell Tracking. Principles and Applications. Radiologe. 2007;47:25–33. - PubMed
    1. Kircher MF, Gambhir SS, Grimm J. Noninvasive Cell-Tracking Methods. Nat Rev Clin Oncol. 2011;8:677–688. - PubMed

Publication types

Substances