Multicenter Study
. 2016 Jul;39(7):391-8.
doi: 10.1002/clc.22541. Epub 2016 Apr 15.

Trends in the Burden of Adult Congenital Heart Disease in US Emergency Departments

Affiliations
Multicenter Study

Trends in the Burden of Adult Congenital Heart Disease in US Emergency Departments

Shikhar Agarwal et al. Clin Cardiol. 2016 Jul.

Abstract

Background: We assessed trends in incidence, in-hospital mortality, and admission among patients with adult congenital heart disease (ACHD) presenting to the emergency department (ED) from 2006 to 2012.

Hypothesis: There is a considerable burden of ACHD in the US EDs.

Methods: We used the 2006-2012 US Nationwide Emergency Department Sample. All ED visits with ACHD were identified using standard International Classification of Diseases, Ninth Edition, Clinical Modification codes.

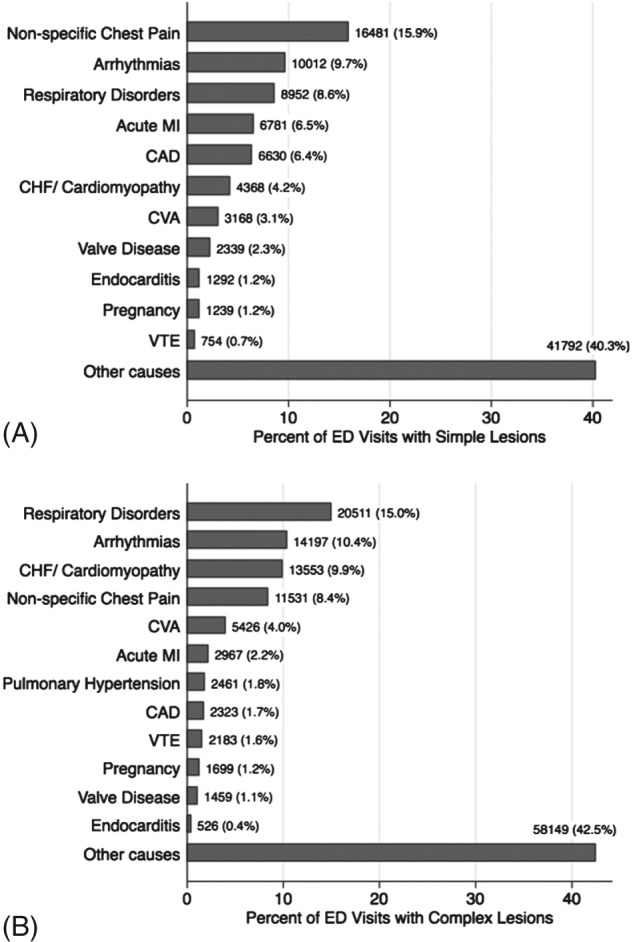
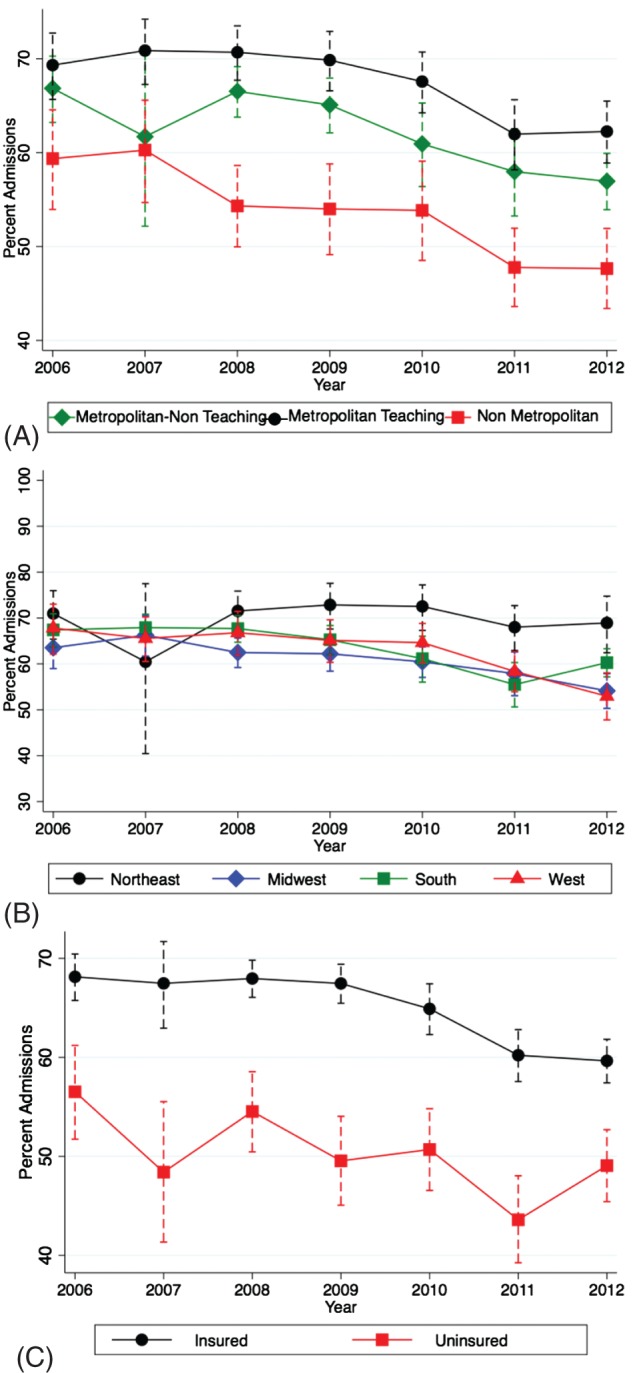
Results: The number of patients presenting to the ED with simple (40.6%) as well as complex (37.6%) ACHD across 2006-2012 increased significantly. Also, there was a considerable increase in prevalence of traditional cardiovascular risk factors among ACHD patients, including hypertension, diabetes, smoking, obesity, and chronic kidney disease. Besides miscellaneous noncardiovascular conditions, nonspecific chest pain (15.9%) and respiratory disorders (15.0%) were the most common reasons for ED visits among patients with simple and complex ACHD, respectively. Although there was a trend toward decrease in admissions across 2006-2012 (Ptrend < 0.001), the proportion of patients with ACHD presenting to ED requiring admission remained substantial (63.4%). Finally, there was significant variation in admission trends across different geographic locations, hospital types, insurance status, and ED volume among ACHD patients presenting to the ED.

Conclusions: There has been a progressive increase in number of ED visits among ACHD patients across 2006-2012 in the United States. Moreover, the cardiovascular risk-factor profile of ACHD patients has changed, adding to complexity in management. Current health care delivery to ACHD patients also shows significant geographical, hospital-based, and insurance status-based disparities.


Figures

Figure 1
Figure 1
Projected annual national estimates of ED visits among patients with ACHD. (A) Overall national estimates with 95% CIs. The black line demonstrates the estimated number of annual ED visits and corresponds to the left sided Y‐axis. The dotted lines around the effect estimates constituting the black line represent the 95% CI of the respective effect estimate. The colored bars represent the number of ED visits among ACHD patients, expressed per 100 000 ED visits and correspond to the right‐sided Y‐axis. The lines on top of the bars denote the standard error of the respective effect estimate. (B) National estimates stratified into simple, complex, and unclassified defects. The lines on top of the bars denote the standard error of the respective effect estimate. For each year, the bar on the left (dark gray) represents simple ACHD, the bar in the middle (blue) represents complex ACHD, and the bar on the right (light gray) represents unclassified ACHD. Abbreviations: ACHD, adult congenital heart disease; CI, confidence interval; ED, emergency department.
Figure 2
Figure 2
This figure demonstrates the primary reasons for presentation to the ED among patients with (A) simple ACHD and (B) complex ACHD. Abbreviations: ACHD, adult congenital heart disease; CAD, coronary artery disease; CHF, congestive heart failure; CVA, cerebrovascular accident; ED, emergency department; MI, myocardial infarction; VTE, venous thromboembolism.
Figure 3
Figure 3
In‐hospital mortality and admission. (A) Annual in‐hospital mortality among patients admitted with simple and complex ACHD. (B) Annual admissions among patients admitted with simple and complex ACHD. In this figure, the black line with circles indicates trends in simple ACHD and the red line with squares indicates trends in complex ACHD. The dotted lines around the effect estimates indicate the 95% CI of the respective effect estimate. Abbreviations: ACHD, adult congenital heart disease; CI, confidence interval.
Figure 4
Figure 4
Trend in admission across the study duration stratified by (A) hospital type, (B) hospital location, and (C) insurance status. The dotted lines around the effect estimates indicate the 95% CI of the respective effect estimate. Abbreviations: CI, confidence interval.

References

    1. Hsia RY, Kellermann AL, Shen YC. Factors associated with closures of emergency departments in the United States [published correction appears in JAMA. 2011;306:162]. JAMA. 2011;305:1978–1985. - PMC - PubMed
    1. Kellermann AL. Crisis in the emergency department. N Engl J Med. 2006;355:1300–1303. - PubMed
    1. Pitts SR, Pines JM, Handrigan MT, et al. National trends in emergency department occupancy, 2001 to 2008: effect of inpatient admissions versus emergency department practice intensity. Ann Emerg Med. 2012;60:679.e3–686.e3. - PubMed
    1. Tang N, Stein J, Hsia RY, et al. Trends and characteristics of US emergency department visits, 1997–2007. JAMA. 2010;304:664–670. - PMC - PubMed
    1. Storrow AB, Jenkins CA, Self WH, et al. The burden of acute heart failure on U.S. emergency departments. JACC Heart Fail. 2014;2:269–277. - PMC - PubMed

Publication types