. 2016 Apr 15:6:24560.
doi: 10.1038/srep24560.

Abnormal Population Responses in the Somatosensory Cortex of Alzheimer's Disease Model Mice

Affiliations

Abnormal Population Responses in the Somatosensory Cortex of Alzheimer's Disease Model Mice

Yossi Maatuf et al. Sci Rep. .

Abstract

Alzheimer's disease (AD) is the most common form of dementia. One of the neuropathological hallmarks of AD is the accumulation of amyloid-β plaques. Overexpression of human amyloid precursor protein in transgenic mice induces hippocampal and neocortical amyloid-β accumulation and plaque deposition that increases with age. The impact of these effects on neuronal population responses and network activity in sensory cortex is not well understood. We used Voltage Sensitive Dye Imaging, to investigate at high spatial and temporal resolution, the sensory evoked population responses in the barrel cortex of aged transgenic (Tg) mice and of age-matched non-transgenic littermate controls (Ctrl) mice. We found that a whisker deflection evoked abnormal sensory responses in the barrel cortex of Tg mice. The response amplitude and the spatial spread of the cortical responses were significantly larger in Tg than in Ctrl mice. At the network level, spontaneous activity was less synchronized over cortical space than in Ctrl mice, however synchronization during evoked responses induced by whisker deflection did not differ between the two groups. Thus, the presence of elevated Aβ and plaques may alter population responses and disrupts neural synchronization in large-scale networks, leading to abnormalities in sensory processing.


Figures
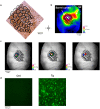
Figure 1
Figure 1. Mapping barrel fields in the barrel cortex.
(a) Example of barrel columns, stained by cytochrome oxidase histochemistry, in layer IV of the somatosensory cortex of a Crtl mouse. Barrel fields are labeled for identification (dashed lines represent the location of alpha, beta, gamma and delta barrels, extrapolated from other experiment). Scale bar, 300 μm. (b) VSD response map of a Ctrl mouse brain, imaged at 40 ms after stimulus onset, showing the spread of activation in the barrel cortex after C2 whisker deflection. Blood vessels are shown in gray. (n = 20 trials). (c) Example session: VSD response maps (∆F/F) evoked by D1 (left map) and C2 (middle map) whisker deflection, superimposed on the barrel columns map from A. Maps were measured at 20 ms after stimulation onset and averaged across trials (n = 20 trials for each condition). The schematic representation of the barrel columns from A, shown as black contour lines, are scaled and superimposed over the blood vessels pattern. Right map: The colored areas indicate the selected ROIs of whiskers C2 and D1 (red and blue, respectively). (d) Example of horizontal sections of layer II/III in the primary somatosensory area of Tg (right) and Ctrl (left) mice. Tissues were stained with Thioflavine-S (see Methods). The plaques are seen as bright green spots.
Figure 2
Figure 2. Whisker deflection evoked much higher response amplitude in the barrel cortex of Tg mice.
(a) Population response maps, evoked by single brief whisker deflection, in the barrel cortex of Ctrl (top; example session, n = 20 trials) and Tg (bottom; example session, n = 20 trials) mice. The numbers above the maps represents the time in ms after whisker stimulation onset. Note the colorbar on the right and ∆F/F range that is much larger for the Tg mouse. Blood vessels are marked in gray. The VSD maps were low-pass filtered with a 2D Gaussian filter (σ = 1.5 pixels) for visualization purposes only. (b) Time course of the VSD response, grand average analysis. Time course of the VSD response in C2 ROI of Crtl and Tg mice (ROIs are demonstrated in Fig. 1c, right map). The responses were averaged across mice (n = 6 Tg mice; n = 8 Ctrl mice). Whisker stimulation is at t = 0. Shaded areas represent ± 1SEM (c) Peak response amplitude, grand average analysis. Peak response amplitude evoked by single brief whisker deflection, averaged across all animals (Tg; n = 6 mice, Crtl; n = 8 mice). *p < 0.05, Wilcoxon rank sum. (d) Normalized time course of responses, grand average analysis. The response was normalized to peak response amplitude of each mice and averaged across mice (n = 6 Tg mice; n = 8 Ctrl mice). Shaded areas represent ± 1SEM.
Figure 3
Figure 3. The spatial extent of the evoked response was significantly larger in Tg mice.
(a) Schematic illustration of ring ROIs. The rings are four pixels wide (200μm) and are centered on the peak activation in space. The distance thus varies from zero (center of the rings) to 0.8 mm away from the center. The ring ROIs are numbered in ascending order according to their distance from the center of the barrel field (e.g. inner ring no. 1, most outer ring, no. 4). (b–c) Left: normalized time course response for each ring averaged over all pixels in the corresponding ROI. The response in each ring was normalized to the peak response of the inner ring. Whisker stimulation is at t = 0. Right: the time course in each ring was normalized to peak response. This highlights the differences in the latency to peak response between the rings. (d) The normalized amplitude, at 20, 40 and 80 ms after stimulation onset, as a function of the distance from the barrel center. Error bars represent ± 1SEM across mice (n = 6 Tg mice; n = 8 Ctrl mice). *p < 0.05 , Wilcoxon rank sum.
Figure 4
Figure 4. Tg mice exhibited a significant reduction of neural synchrony during the resting state.
(a) Example of spatial correlation maps in the spontaneous state from two mice. The time averaged spatial correlation maps were computed for pixels located in barrel C2 during spontaneous activity (see Methods for details). Maps were averaged over 2500 ms of spontaneous activity. Left, Crtl; Right, Tg. The color bar depicts the correlation range. (b) Spontaneous correlation, grand average analysis. Mean correlation values, for the observed and for the shuffled data, measured at the resting state from the barrel cortex of Crtl (blue colors) and Tg (red colors) mice. The correlations were averaged across mice (Tg n = 6 mice, Crtl n = 8 mice) and over all pixels located up to 200 μm from the central pixel. The correlation values were averaged over 2500 ms of spontaneous activity. In addition, for the spatially shuffled data, the presented correlation values were averaged over all shuffles (n = 100 iterations). Error bar is SEM over mice. *p < 0.05, Wilcoxon rank sum; ***p < 0.001, Wilcoxon signed-rank test. (c) Example of spatial correlation maps in the sensory evoked state from two mice. Averaged spatial correlation maps for sensory-evoked activity of pixels located in barrel C2. Left, Crtl; Right, Tg. (d) Grand average analysis of correlation across time. The correlation time course were averaged across mice (Tg n = 6 mice, Crtl n = 8 mice) and over all pixels that are located up to 200 μm from the central pixel. Shaded areas represent ± 1SEM across mice.

Similar articles

Cited by

References

    1. Hardy J. & Selkoe D. J. The Amyloid Hypothesis of Alzheimer’s Disease: Progress and Problems on the Road to Therapeutics. Science (80−) 297, 353–356 (2002). - PubMed
    1. Karran E., Mercken M. & Strooper B. De. The amyloid cascade hypothesis for Alzheimer’s disease: an appraisal for the development of therapeutics. Nat Rev Drug Discov 10, 698–712 (2011). - PubMed
    1. Masliah E. et al.. Synaptic and neuritic alterations during the progression of Alzheimer’s disease. Neurosci. Lett. 174, 67–72 (1994). - PubMed
    1. Spires-Jones T. L. et al.. Impaired spine stability underlies plaque-related spine loss in an Alzheimer’s disease mouse model. Am. J. Pathol. 171, 1304–1311 (2007). - PMC - PubMed
    1. Adalbert R. et al.. Severely dystrophic axons at amyloid plaques remain continuous and connected to viable cell bodies. Brain 132, 402–416 (2009). - PubMed