. 2016 Apr 15:6:24451.
doi: 10.1038/srep24451.

Functional traits help to explain half-century long shifts in pollinator distributions

Affiliations

Functional traits help to explain half-century long shifts in pollinator distributions

Jesús Aguirre-Gutiérrez et al. Sci Rep. .

Abstract

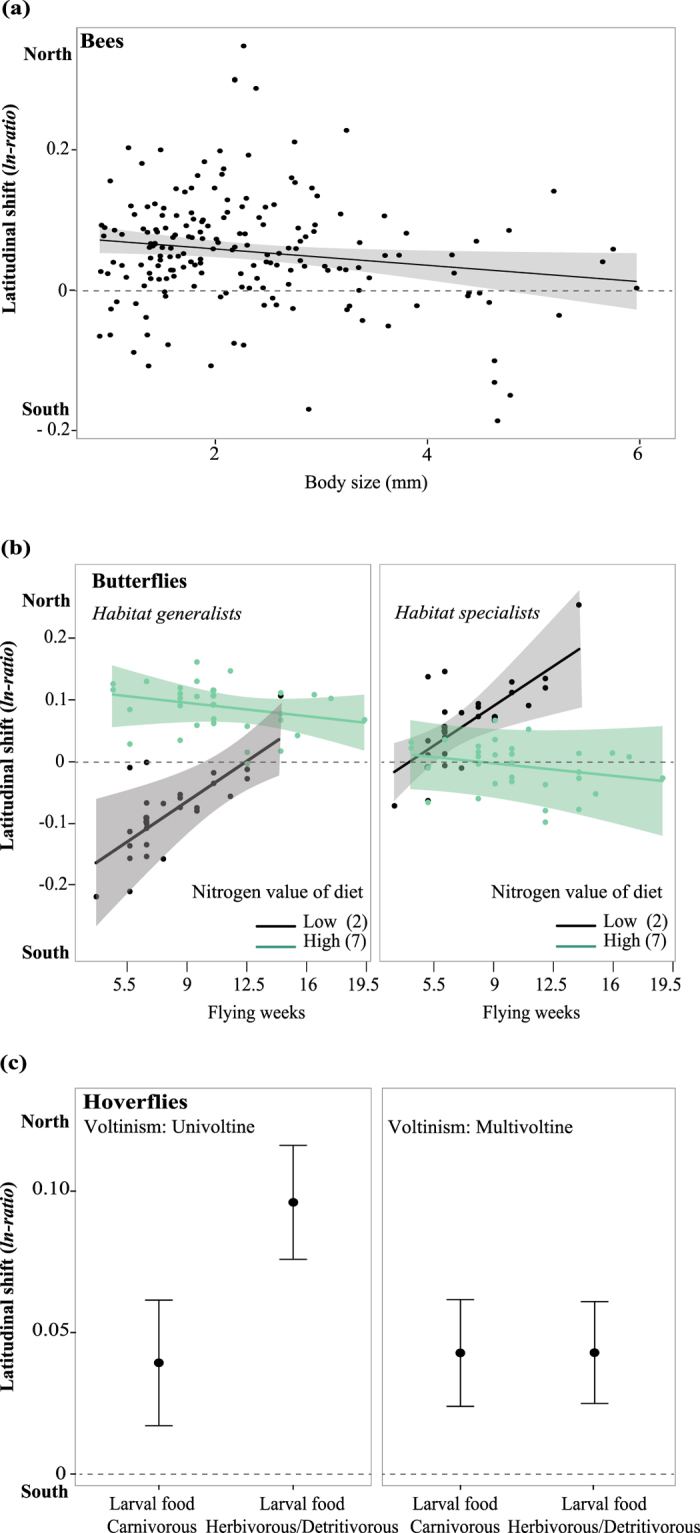
Changes in climate and land use can have important impacts on biodiversity. Species respond to such environmental modifications by adapting to new conditions or by shifting their geographic distributions towards more suitable areas. The latter might be constrained by species' functional traits that influence their ability to move, reproduce or establish. Here, we show that functional traits related to dispersal, reproduction, habitat use and diet have influenced how three pollinator groups (bees, butterflies and hoverflies) responded to changes in climate and land-use in the Netherlands since 1950. Across the three pollinator groups, we found pronounced areal range expansions (>53%) and modelled range shifts towards the north (all taxa: 17-22 km), west (bees: 14 km) and east (butterflies: 11 km). The importance of specific functional traits for explaining distributional changes varied among pollinator groups. Larval diet preferences (i.e. carnivorous vs. herbivorous/detritivorous and nitrogen values of host plants, respectively) were important for hoverflies and butterflies, adult body size for hoverflies, and flight period length for all groups. Moreover, interactions among multiple traits were important to explain species' geographic range shifts, suggesting that taxon-specific multi-trait analyses are needed to predict how global change will affect biodiversity and ecosystem services.


Figures

Figure 1
Figure 1. Half-century changes in species distributions of Dutch pollinators (bees, butterflies, hoverflies).
(a) Three aspects of species distributional changes between period 1 (1951–1970) and period 2 (1998–2014) are captured. Left: areal range changes (% change in geographic range size between periods) as obtained from back-transformed values of model estimates. Middle: latitudinal range shifts (latitudinal change of the range centroid between periods, with positive values representing northward shifts and negative values southwards shifts, in km). Right: longitudinal range shifts (longitudinal change of the range centroid between periods, with positive values representing eastward shifts and negative values westward shifts, in km). For all spatial range changes, the means ± 95% confidence interval across all species within a pollinator group are presented. For statistical details see Table S1. (b) Maps of net changes in the number of species per grid cell and pollinator group across the Netherlands. The maps illustrate the number of species colonising a grid cell between periods minus the number of species abandoning the same grid cell. Blue colours: grid cells with more range expansions than contractions. Red colours: grid cells with more range contractions than expansions. The maps were created using the R “raster” package (https://cran.r-project.org/web/packages/raster/index.html).
Figure 2
Figure 2. Areal range changes of pollinators (bees, butterflies, hoverflies) explained by species traits.
(a) Bee habitat generalists show on average greater areal range expansions than specialists. (b) Butterfly habitat generalists show range expansions whereas habitat specialists show contractions. (c) Areal range expansions of hoverflies are similar in magnitude for both habitat generalists and specialists. The effect of habitat specialisation is dependent on the species initial range size. (d) Hoverfly’s areal range changes depend on larval food and flight period length. Areal range changes of hoverflies with larvae feeding on animals increase more strongly with flight period length than those of species with larvae feeding on other resources. (e) Effect of body size on areal range changes of hoverflies. Large-bodied species increase range size more strongly than small-bodied species. For all plots the average prediction ±95% confidence intervals are shown. For statistical details see Supplementary Table S3.
Figure 3
Figure 3. Latitudinal range shifts of pollinators (bees, butterflies, hoverflies) explained by species traits.
(a) Effect of bee body size on latitudinal range shifts, with smaller species tending to shift more towards northern locations than larger species. (b) Butterfly latitudinal range shifts depend on habitat use (generalist vs. specialists), flight period length and larval host plant use. We present the model results for low (2) vs high (7) nitrophily values. Habitat generalists feeding on larval host plants with high nitrophily values (left panel: green dots) shift more towards the north than generalists feeding on plants with low nitrogen values (left panel: black dots). The opposite is observed for habitat specialists (right panel). Hence, butterfly species with larval host plants that have low nitrophily values (both panels: black dots) shift towards the south for generalists (left) but towards the north for specialists (right). Latitudinal range shifts of both specialists and generalists also depend on flight period, with northward shifts increasing with flying weeks when larval host plants have low nitrophily values, and decreasing when larval host plants have high nitrophily values. (c) Effect of voltinism and larval food plants on latitudinal shifts. Univoltine species (left panel) show smaller northward shifts in species which have larvae feeding on animals (carnivorous) compared to species with larval feeding on plants and organic matter (herbivorous/detritivorous. In contrast, there is no difference for multivoltine species (right panel). For all plots the average prediction ± 95% confidence intervals are shown. For statistical details see Supplementary Table S3.
Figure 4
Figure 4. Longitudinal range shifts of pollinators (bees, butterflies, hoverflies explained by species traits.
(a) Bee species with long flight periods show slightly stronger shifts towards western locations than species with shorter flight periods. (b) Longitudinal shifts of butterfly species further depend on habitat specialisation, with long-flying specialists shifting more towards eastern locations than long-flying habitat generalists. (c) Longitudinal shifts of hoverfly species depend on the diet of the larvae, i.e. species with herbivorous/detritivorous larvae shift towards eastern locations and species with carnivorous larvae shift towards the west. Average predictions ±95% confidence intervals are shown. For statistical details see Supplementary Table S3.

References

    1. Lawler J. J. et al. Projected land-use change impacts on ecosystem services in the United States. Proc. Natl. Acad. Sci. USA 111, 7492–7497 (2014). - PMC - PubMed
    1. IPCC. In Climate change 2014: Impacts, adaptation, and vulnerability. Part B: Regional aspects. Contribution of working group II to the fifth assessment report of the intergovernmental panel on climate change (ed. Barros V. R. et al.) 1–688 (Cambridge University Press, Cambridge, United Kingdom and New York, NY, USA, 2014).
    1. Steffen W. et al. Planetary boundaries: Guiding human development on a changing planet. Science 347, (6223):1259855 (2015). - PubMed
    1. European Environment Agency. In The European environment — state and outlook 2010: synthesis 222 (European Environment Agency, Copenhagen, 2010).
    1. Sala O. E. et al. Global biodiversity scenarios for the year 2100. Science 287, 1770–1774 (2000). - PubMed

Publication types

LinkOut - more resources